Nottingham East | |
---|---|
Borough constituency for the House of Commons | |
County | Nottinghamshire |
Electorate | 58,705 (2010) [1] |
Major settlements | Nottingham |
Current constituency | |
Created | 1974 |
Member of Parliament | Nadia Whittome (Labour) |
Seats | One |
Created from | Nottingham Central and Nottingham South |
1885–1955 | |
Seats | One |
Type of constituency | Borough constituency |
Created from | Nottingham |
Replaced by | Nottingham Central and Nottingham North |
Nottingham East is a constituency [n 1] represented in the House of Commons of the UK Parliament since 2019 by Nadia Whittome of the Labour Party. [n 2]
On average earners' incomes are slightly lower than the national average [3] and in 2010 unemployment stood at 7.4%, which was higher than the East Midlands average at the time of 3.6% [4] however the picture is not uniform across all 2011 Census Output Areas, some of which have incomes at the national average or above and together with the affordability of property in the area, those on the national average way or above generally have the ability to save, purchase property or enjoy a high standard of living. [5] [6]
The constituency covers the north-eastern part of the City of Nottingham. It includes the suburbs of Mapperley, Carrington and Sherwood, and the inner city areas of Hyson Green, St Ann's, Bakersfield and Sneinton.
2010–present: The City of Nottingham wards of Arboretum, Berridge, Dales, Mapperley, St Ann's, and Sherwood.
1983–2010: The City of Nottingham wards of Basford, Forest, Greenwood, Manvers, Mapperley, Radford, St Ann's, Sherwood, and Trent.
1974–1983: The County Borough of Nottingham wards of Bridge, Lenton, Manvers, Market, St Ann's, and Trent.
1950–1955: The County Borough of Nottingham wards of Byron, Manvers, Mapperley, and St Ann's.
1918–1950: The County Borough of Nottingham wards of Byron, Manvers, Mapperley, and St Mary's.
1885–1918: The Borough of Nottingham wards of Byron, Manvers, Mapperley, Robin Hood, and St Ann's.
Further to the 2023 Periodic Review of Westminster constituencies, enacted by the Parliamentary Constituencies Order 2023, the composition of the constituency from the 2024 United Kingdom general election will be (as they existed on 1st December 2020):
The City of Nottingham wards of Berridge, Castle, Dales, Hyson Green & Arboretum, Mapperley, St Ann's, and Sherwood. [7]
The Castle ward, which incorporates Nottingham city centre will be transferred from Nottingham South.
The present Nottingham East constituency was created in 1974, and first elected Jack Dunnett who had been Labour MP for the abolished Nottingham Central seat. Michael Knowles regained it for the Conservative Party in 1983, when some of the seat was transferred to the new Nottingham South constituency in boundary changes. Knowles held the seat with a reduced majority in 1987, but John Heppell gained it for Labour in 1992, and held the seat until he retired in 2010. Until 2019 it was held by Chris Leslie, initially for Labour Co-operative and later for Change UK. Leslie previously represented his hometown constituency of Shipley in West Yorkshire, from 1997 until losing his seat to Philip Davies in 2005. During his first term he joined the front benches serving as a junior minister as part of the Tony Blair Government and was briefly Shadow Chancellor after the 2015 general election. The incumbent MP, Nadia Whittome, is the current Baby of the House, aged 23 upon her election in 2019.
Party | Candidate | Votes | % | ±% | |
---|---|---|---|---|---|
Labour | Nadia Whittome [8] | ||||
Majority | |||||
Turnout | |||||
Swing | |||||
Party | Candidate | Votes | % | ±% | |
---|---|---|---|---|---|
Labour | Nadia Whittome | 25,735 | 64.3 | −7.2 | |
Conservative | Victoria Stapleton | 8,342 | 20.8 | −0.8 | |
Liberal Democrats | Robert Swift | 1,954 | 4.9 | +2.3 | |
The Independent Group for Change | Chris Leslie | 1,447 | 3.6 | New | |
Brexit Party | Damian Smith | 1,343 | 3.4 | New | |
Green | Michelle Vacciana | 1,183 | 3.0 | +1.2 | |
Majority | 17,393 | 43.5 | −6.4 | ||
Turnout | 40,004 | 60.4 | −3.3 | ||
Labour hold | Swing | −3.15 | |||
Party | Candidate | Votes | % | ±% | |
---|---|---|---|---|---|
Labour Co-op | Chris Leslie [13] | 28,102 | 71.5 | +16.9 | |
Conservative | Simon Murray | 8,512 | 21.6 | +0.8 | |
Liberal Democrats | Barry Holliday | 1,003 | 2.6 | −1.6 | |
UKIP | Robert Hall-Palmer | 817 | 2.1 | −7.8 | |
Green | Kat Boettge | 698 | 1.8 | −8.1 | |
Elvis and the Yeti Himalayan Preservation Party | David Bishop [14] | 195 | 0.5 | New | |
Majority | 19,590 | 49.9 | +16.1 | ||
Turnout | 39,327 | 63.7 | +5.5 | ||
Labour Co-op hold | Swing | +8.0 | |||
Party | Candidate | Votes | % | ±% | |
---|---|---|---|---|---|
Labour Co-op | Chris Leslie | 19,208 | 54.6 | +9.2 | |
Conservative | Garry Hickton | 7,314 | 20.8 | -2.9 | |
UKIP | Fran Loi | 3,501 | 9.9 | +6.5 | |
Green | Antonia Zenkevitch [17] | 3,473 | 9.9 | +7.1 | |
Liberal Democrats | Tad Jones | 1,475 | 4.2 | -20.1 | |
Independent | Seb Soar [18] | 141 | 0.4 | New | |
Independent | James Stephenson | 97 | 0.3 | New | |
Majority | 11,894 | 33.8 | +12.7 | ||
Turnout | 35,209 | 58.2 | +1.8 | ||
Labour Co-op hold | Swing | +6.1 | |||
Party | Candidate | Votes | % | ±% | |
---|---|---|---|---|---|
Labour Co-op | Chris Leslie | 15,022 | 45.4 | ||
Liberal Democrats | Sam Boote | 8,053 | 24.3 | ||
Conservative | Ewan Lamont | 7,846 | 23.7 | ||
UKIP | Pat Wolfe | 1,138 | 3.4 | ||
Green | Benjamin Hoare | 928 | 2.8 | ||
Christian | Parvaiz Sardar | 125 | 0.4 | ||
Majority | 6,969 | 21.1 | |||
Turnout | 33,112 | 56.4 | |||
Labour Co-op win (new boundaries) |
Party | Candidate | Votes | % | ±% | |
---|---|---|---|---|---|
Labour | John Heppell | 13,787 | 45.8 | -13.2 | |
Liberal Democrats | Issan Ghazni | 6,848 | 22.8 | +9.8 | |
Conservative | Jim Thornton | 6,826 | 22.7 | -1.6 | |
Green | Ashley Baxter | 1,517 | 5.0 | New | |
UKIP | Anthony Ellwood | 740 | 2.5 | New | |
Socialist Unity | Pete Radcliff | 373 | 1.2 | New | |
Majority | 6,939 | 23.0 | -11.7 | ||
Turnout | 30,091 | 49.6 | +4.1 | ||
Labour hold | Swing | -11.5 | |||
Party | Candidate | Votes | % | ±% | |
---|---|---|---|---|---|
Labour | John Heppell | 17,530 | 59.0 | -3.3 | |
Conservative | Richard Allan | 7,210 | 24.3 | +0.8 | |
Liberal Democrats | Tim Ball | 3,874 | 13.0 | +2.9 | |
Socialist Alliance | Pete Radcliff | 1,117 | 3.8 | New | |
Majority | 10,320 | 34.7 | -4.1 | ||
Turnout | 29,731 | 45.5 | -15.0 | ||
Labour hold | Swing | -2.0 | |||
Party | Candidate | Votes | % | ±% | |
---|---|---|---|---|---|
Labour | John Heppell | 24,755 | 62.3 | +9.7 | |
Conservative | Andrew Raca | 9,336 | 23.5 | −12.9 | |
Liberal Democrats | Kevin Mulloy | 4,008 | 10.1 | +2.3 | |
Referendum | Ben Brown | 1,645 | 4.1 | New | |
Majority | 15,419 | 38.8 | +22.6 | ||
Turnout | 39,744 | 60.5 | -9.6 | ||
Labour hold | Swing | ||||
Party | Candidate | Votes | % | ±% | |
---|---|---|---|---|---|
Labour | John Heppell | 25,026 | 52.6 | +10.6 | |
Conservative | Michael Knowles | 17,346 | 36.4 | -6.5 | |
Liberal Democrats | Timothy Ball | 3,695 | 7.8 | -6.9 | |
Green | Andrew Jones | 667 | 1.4 | New | |
Liberal | Charles Roylance | 598 | 1.3 | New | |
Natural Law | John Ashforth | 283 | 0.6 | New | |
Majority | 7,680 | 16.2 | +15.2 | ||
Turnout | 47,615 | 70.1 | +1.3 | ||
Labour gain from Conservative | Swing | +8.6 | |||
Party | Candidate | Votes | % | ±% | |
---|---|---|---|---|---|
Conservative | Michael Knowles | 20,162 | 42.9 | +2.5 | |
Labour | Mohammed Aslam | 19,706 | 42.0 | +4.9 | |
Liberal | Stephen Parkhouse | 6,887 | 14.7 | New | |
Red Front | Kenan Malik | 212 | 0.4 | New | |
Majority | 456 | 0.9 | |||
Turnout | 46,967 | 68.8 | +5.2 | ||
Conservative hold | Swing | -1.2 | |||
Party | Candidate | Votes | % | ±% | |
---|---|---|---|---|---|
Conservative | Michael Knowles | 17,641 | 40.4 | ||
Labour Co-op | Martyn Sloman | 16,177 | 37.1 | ||
SDP | Michael Bird | 8,385 | 19.2 | ||
Ind. Conservative | David Merrick | 1,421 | 3.3 | ||
Majority | 1,464 | 3.3 | |||
Turnout | 43,624 | 63.6 | -0.3 | ||
Conservative win (new boundaries) |
Party | Candidate | Votes | % | ±% | |
---|---|---|---|---|---|
Labour | Jack Dunnett | 15,433 | 50.5 | -0.7 | |
Conservative | Martin Brandon-Bravo | 12,199 | 39.9 | +7.1 | |
Liberal | JD Hiley | 2,270 | 7.4 | -6.3 | |
National Front | MA Cole | 426 | 1.4 | New | |
Socialist Unity | IB Juniper | 252 | 0.8 | New | |
Majority | 3,234 | 10.6 | |||
Turnout | 30,580 | 63.9 | +3.9 | ||
Labour hold | Swing | -3.9 | |||
Party | Candidate | Votes | % | ±% | |
---|---|---|---|---|---|
Labour | Jack Dunnett | 16,530 | 51.2 | +4.3 | |
Conservative | SM Swerling | 10,574 | 32.8 | -3.3 | |
Liberal | EJ Rowan | 4,442 | 13.8 | -3.2 | |
Ind. Labour Party | DW Peetz | 736 | 2.3 | New | |
Majority | 5,956 | 18.4 | +7.6 | ||
Turnout | 32,282 | 60.0 | -9.1 | ||
Labour hold | Swing | +3.8 | |||
Party | Candidate | Votes | % | ±% | |
---|---|---|---|---|---|
Labour | Jack Dunnett | 17,324 | 46.9 | ||
Conservative | Richard Shepherd | 13,346 | 36.1 | ||
Liberal | EJ Rowan | 6,294 | 17.0 | ||
Majority | 3,978 | 10.8 | |||
Turnout | 36,964 | 69.1 | |||
Labour win (new seat) |
Party | Candidate | Votes | % | ±% | |
---|---|---|---|---|---|
Labour | James Harrison | 20,865 | 47.77 | ||
Conservative | Sidney Shephard | 20,601 | 47.17 | ||
Liberal | Ruth Abrahams | 2,209 | 5.06 | ||
Majority | 264 | 0.60 | |||
Turnout | 43,675 | 83.34 | |||
Labour hold | Swing | ||||
Party | Candidate | Votes | % | ±% | |
---|---|---|---|---|---|
Labour | James Harrison | 20,404 | 46.5 | ||
Conservative | Louis Gluckstein | 18,079 | 41.2 | ||
Liberal | Edward Anthony Brooke Fletcher | 5,368 | 12.2 | ||
Majority | 2,325 | 5.3 | |||
Turnout | 43,851 | 84.3 | |||
Labour win (new boundaries) |
Party | Candidate | Votes | % | ±% | |
---|---|---|---|---|---|
Labour | James Harrison | 12,075 | 40.2 | +14.5 | |
Conservative | Louis Gluckstein | 11,227 | 37.4 | -20.3 | |
Liberal | Patrick Seely | 5,658 | 18.8 | +2.2 | |
Independent Labour | George Twells | 1,072 | 3.6 | New | |
Majority | 848 | 2.8 | N/A | ||
Turnout | 30,032 | 72.0 | +3.9 | ||
Labour gain from Conservative | Swing | ||||
General Election 1939–40: Another general election was required to take place before the end of 1940. The political parties had been making preparations for an election to take place from 1939 and by the end of this year, the following candidates had been selected;
Party | Candidate | Votes | % | ±% | |
---|---|---|---|---|---|
Conservative | Louis Gluckstein | 16,726 | 57.7 | +7.4 | |
Labour | M. Leon Freedman | 7,435 | 25.7 | +10.3 | |
Liberal | Arthur Comyns Carr | 4,819 | 16.6 | -17.7 | |
Majority | 9,291 | 32.0 | +16.0 | ||
Turnout | 28,980 | 68.1 | -10.7 | ||
Conservative hold | Swing | ||||
Party | Candidate | Votes | % | ±% | |
---|---|---|---|---|---|
Conservative | Louis Gluckstein | 17,484 | 50.3 | +18.5 | |
Liberal | Norman Birkett | 11,901 | 34.3 | -5.9 | |
Labour | Walter Windsor | 5,339 | 15.4 | -12.6 | |
Majority | 5,583 | 16.0 | N/A | ||
Turnout | 34,724 | 78.8 | -0.1 | ||
Conservative gain from Liberal | Swing | ||||
Party | Candidate | Votes | % | ±% | |
---|---|---|---|---|---|
Liberal | Norman Birkett | 14,049 | 40.2 | -1.4 | |
Unionist | Louis Gluckstein | 11,110 | 31.8 | -15.8 | |
Labour | James Baum | 9,787 | 28.0 | New | |
Majority | 2,939 | 8.4 | N/A | ||
Turnout | 34,946 | 78.9 | +4.2 | ||
Liberal gain from Unionist | Swing | +7.2 | |||
Party | Candidate | Votes | % | ±% | |
---|---|---|---|---|---|
Unionist | Edmund Brocklebank | 11,524 | 47.6 | +1.0 | |
Liberal | Norman Birkett | 10,078 | 41.6 | -11.8 | |
Communist | Tom Mann | 2,606 | 10.8 | New | |
Majority | 1,446 | 6.0 | N/A | ||
Turnout | 24,208 | 74.7 | +6.9 | ||
Unionist gain from Liberal | Swing | ||||
Party | Candidate | Votes | % | ±% | |
---|---|---|---|---|---|
Liberal | Norman Birkett | 11,355 | 53.4 | +13.1 | |
Unionist | John Houfton | 9,919 | 46.6 | -13.1 | |
Majority | 1,436 | 6.8 | N/A | ||
Turnout | 21,274 | 67.8 | +1.6 | ||
Liberal gain from Unionist | Swing | +13.1 | |||
Party | Candidate | Votes | % | ±% | |
---|---|---|---|---|---|
Unionist | John Houfton | 12,082 | 59.7 | -6.0 | |
Liberal | Edward Ernest Henry Atkin | 8,170 | 40.3 | N/A | |
Majority | 3,912 | 19.4 | -26.9 | ||
Turnout | 20,252 | 66.2 | +16.7 | ||
Unionist hold | Swing | ||||
Party | Candidate | Votes | % | ±% | |
---|---|---|---|---|---|
C | Unionist | John Houfton | 10,404 | 52.3 | -13.4 |
Labour Co-op | A.H. Jones | 5,431 | 27.3 | +7.9 | |
Liberal | Thomas George Graham | 4,065 | 20.4 | New | |
Majority | 4,973 | 25.0 | -21.3 | ||
Turnout | 19,900 | 66.3 | +16.8 | ||
Unionist hold | Swing | -10.6 | |||
Cindicates candidate endorsed by the coalition government. |
Party | Candidate | Votes | % | ±% | |
---|---|---|---|---|---|
C | Unionist | John Rees | 9,549 | 65.7 | |
Labour | Thomas Proctor | 2,817 | 19.4 | New | |
NFDDSS | Joseph Nathaniel Dennis Brookes | 2,166 | 14.9 | New | |
Majority | 6,732 | 46.3 | |||
Turnout | 14,532 | 49.5 | |||
Unionist win (new boundaries) | |||||
Cindicates candidate endorsed by the coalition government. |
General Election 1914–15: Another General Election was required to take place before the end of 1915. The political parties had been making preparations for an election to take place and by July 1914, the following candidates had been selected;
Party | Candidate | Votes | % | ±% | |
---|---|---|---|---|---|
Unionist | John Rees | 6,482 | 55.7 | −0.9 | |
Liberal | Thomas Dobson | 5,158 | 44.3 | +0.9 | |
Majority | 1,324 | 11.4 | −1.8 | ||
Turnout | 11,640 | 83.9 | +0.1 | ||
Registered electors | 13,866 | ||||
Unionist hold | Swing | −0.9 | |||
Party | Candidate | Votes | % | ±% | |
---|---|---|---|---|---|
Conservative | James Morrison | 6,274 | 56.6 | +5.9 | |
Liberal | Dudley Stewart-Smith | 4,804 | 43.4 | −5.9 | |
Majority | 1,470 | 13.2 | +11.8 | ||
Turnout | 11,078 | 83.8 | −4.0 | ||
Registered electors | 13,218 | ||||
Conservative hold | Swing | +5.9 | |||
Party | Candidate | Votes | % | ±% | |
---|---|---|---|---|---|
Conservative | James Morrison | 5,877 | 50.7 | +9.1 | |
Liberal | Henry Cotton | 5,725 | 49.3 | −9.1 | |
Majority | 152 | 1.4 | N/A | ||
Turnout | 11,602 | 87.8 | +5.0 | ||
Registered electors | 13,218 | ||||
Conservative gain from Liberal | Swing | +9.1 | |||
Party | Candidate | Votes | % | ±% | |
---|---|---|---|---|---|
Liberal | Henry Cotton | 6,020 | 58.4 | +12.7 | |
Conservative | Edward Bond | 4,290 | 41.6 | -12.7 | |
Majority | 1,730 | 16.8 | N/A | ||
Turnout | 10,310 | 82.8 | +7.9 | ||
Registered electors | 12,451 | ||||
Liberal gain from Conservative | Swing | +12.7 | |||
Party | Candidate | Votes | % | ±% | |
---|---|---|---|---|---|
Conservative | Edward Bond | 4,927 | 54.3 | +3.4 | |
Liberal | Edward Hervey Fraser | 4,148 | 45.7 | -3.4 | |
Majority | 779 | 8.6 | +6.8 | ||
Turnout | 9,075 | 74.9 | -7.9 | ||
Registered electors | 12,109 | ||||
Conservative hold | Swing | +3.4 | |||
Party | Candidate | Votes | % | ±% | |
---|---|---|---|---|---|
Conservative | Edward Bond | 4,900 | 50.9 | +4.1 | |
Liberal | Arnold Morley | 4,735 | 49.1 | −4.1 | |
Majority | 165 | 1.8 | N/A | ||
Turnout | 9,635 | 82.8 | +7.8 | ||
Registered electors | 12,451 | ||||
Conservative gain from Liberal | Swing | +4.1 | |||
Party | Candidate | Votes | % | ±% | |
---|---|---|---|---|---|
Liberal | Arnold Morley | Unopposed | |||
Liberal hold | |||||
Party | Candidate | Votes | % | ±% | |
---|---|---|---|---|---|
Liberal | Arnold Morley | 4,861 | 53.2 | +2.3 | |
Conservative | Harold Finch-Hatton | 4,284 | 46.8 | −2.3 | |
Majority | 577 | 6.4 | +4.6 | ||
Turnout | 9,145 | 81.6 | +11.0 | ||
Registered electors | 11,204 | ||||
Liberal hold | Swing | +2.3 | |||
Party | Candidate | Votes | % | ±% | |
---|---|---|---|---|---|
Liberal | Arnold Morley | 4,584 | 50.9 | −4.3 | |
Conservative | Harold Finch-Hatton | 4,418 | 49.1 | +4.3 | |
Majority | 166 | 1.8 | −8.6 | ||
Turnout | 9,002 | 70.6 | −3.8 | ||
Registered electors | 12,749 | ||||
Liberal hold | Swing | −4.3 | |||
Party | Candidate | Votes | % | ±% | |
---|---|---|---|---|---|
Liberal | Arnold Morley | 5,239 | 55.2 | ||
Conservative | Harold Finch-Hatton | 4,248 | 44.8 | ||
Majority | 991 | 10.4 | |||
Turnout | 9,487 | 74.4 | |||
Registered electors | 12,749 | ||||
Liberal win (new seat) |
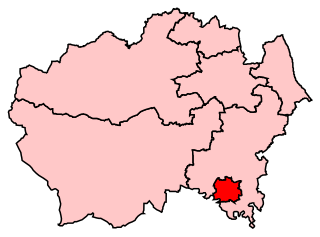
Edinburgh South is a constituency of the House of Commons of the UK Parliament created in 1885. The constituency has been held by Scottish Labour since 1987, being represented by Ian Murray since 2010. Murray was the only Labour MP in Scotland to retain his seat at the 2015 and 2019 general elections and this is one of only three seats never held by the Scottish National Party (SNP).
Rushcliffe is a constituency in Nottinghamshire represented in the House of Commons of the UK Parliament from 2019 by Ruth Edwards, a Conservative.
Chorley is a constituency in Lancashire represented in the House of Commons of the UK Parliament since 1997 by Lindsay Hoyle. Hoyle was originally elected for the Labour Party, but in 2019 became the Speaker, making him unaffiliated.
Barrow and Furness, formerly known as Barrow-in-Furness, is a constituency in Cumbria which has been represented in the House of Commons of the UK Parliament by Simon Fell of the Conservative Party since 2019.
Liverpool, Walton is a constituency represented in the House of Commons of the UK Parliament since 2017 by Dan Carden of the Labour Party. Carden won the highest percentage share of the vote in June 2017 of 650 constituencies, 85.7%. It is the safest Labour seat in the United Kingdom, and the safest seat in the country having been won by 85% of the vote in the most recent election in 2019.
Darlington is the parliamentary constituency for the eponymous market town in County Durham in the North East of England. It is currently represented in the House of Commons of the UK Parliament by Peter Gibson of the Conservative Party, who was first elected in 2019.
Normanton was a county constituency represented in the House of Commons of the Parliament of the United Kingdom. It elected one Member of Parliament (MP) by the first past the post system of election.
Newark is a constituency in Nottinghamshire, England. It is currently represented by Robert Jenrick of the Conservative Party who won the seat in a by-election on 5 June 2014, following the resignation of Patrick Mercer in April 2014.
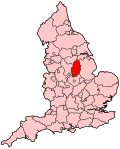
Sherwood is a constituency represented in the House of Commons of the UK Parliament since 2010 by Mark Spencer, a Conservative. The constituency's name is common with Sherwood Forest which is in the area.
Bassetlaw is a parliamentary constituency in Nottinghamshire, represented in the House of Commons of the UK Parliament since the 2019 general election by Brendan Clarke-Smith, a Conservative. Before that election, the seat had been part of the so-called "red wall", being held by the Labour Party since 1935.
Broxtowe is a parliamentary constituency in Nottinghamshire, England, represented in the House of Commons of the UK Parliament since 2019 by Darren Henry, a Conservative.
Nottingham South is a constituency of the Parliament of the United Kingdom, represented since 2010 by Lilian Greenwood of the Labour Party.
Nottingham North is a constituency represented in the House of Commons of the UK Parliament since 2017 by Alex Norris of the Labour and Co-operative party.
Mansfield is a constituency created in 1885 represented in the House of Commons of the UK Parliament since 2017 by Ben Bradley of the Conservative Party, who gained the seat at the 2017 general election, from the Labour Party. This is the first time the seat has been represented by a Conservative since its creation in 1885.
Gedling is a constituency in Nottinghamshire created in 1983 represented in the House of Commons of the UK Parliament since 2019 by Tom Randall of the Conservative Party. The seat was a safely Conservative until the Labour Party's landslide victory in 1997, when it was won for Labour by Vernon Coaker. Labour held Gedling until 2019, when it was regained by the Conservative Party.
Bristol East is a constituency recreated in 1983 covering the eastern part of the City of Bristol, represented in the House of Commons of the UK Parliament since 2005 by Kerry McCarthy of the Labour Party.
Edinburgh Central was a burgh constituency of the House of Commons of the Parliament of the United Kingdom from 1885 to 2005. It elected one Member of Parliament (MP) by the first past the post system of election.
Sherwood is a large district and ward of the city of Nottingham, England, 1.5 miles (2.4 km) north of the city centre. The population at the 2011 census was 15,414. It is bordered by Woodthorpe to the northeast, Mapperley to the east, Carrington to the south, New Basford and Basford to the west, and Daybrook and Bestwood to the north.
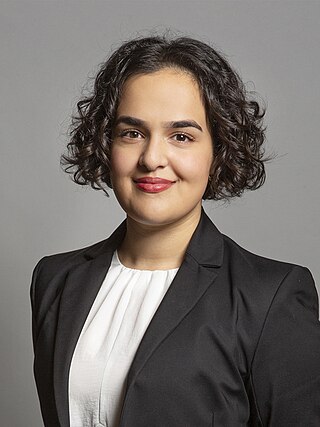
Nadia Edith Whittome is a British politician who is the Member of Parliament (MP) for Nottingham East first elected in the 2019 United Kingdom general election. A member of the Labour Party, she was elected at the age of 23, and was the youngest serving MP until the election of Keir Mather in 2023. She is a member of the Socialist Campaign Group and describes herself as a democratic socialist.