Leicester West | |
---|---|
Borough constituency for the House of Commons | |
County | Leicestershire |
Electorate | 65,432 (December 2010) [1] |
Current constituency | |
Created | 1974 |
Member of Parliament | Liz Kendall (Labour) |
Seats | One |
Created from | Leicester North West and Leicester South West |
1918–1950 | |
Seats | One |
Created from | Leicester |
Replaced by | Leicester North West and Leicester South West |
Leicester West is a constituency [n 1] represented in the House of Commons of the UK Parliament since 2010 by Liz Kendall of the Labour Party. [n 2] Along with the other two Leicester seats, it was held by Labour at the 2017 general election. Since its creation in 1918 the seat has sided with parties from the left wing of politics.
1918–1950: The County Borough of Leicester wards of Abbey, Newton, St Margaret's, Westcotes, and Wyggeston.
1974–1983: The County Borough of Leicester wards of Abbey, Newton, North Braunstone, St Margaret's, and Westcotes.
1983–2010: The City of Leicester wards of Abbey, Beaumont Leys, Mowmacre, New Parks, North Braunstone, Rowley Fields, St Augustine's, Westcotes, and Western Park.
2010–2024: The City of Leicester wards of Abbey, Beaumont Leys, Braunstone Park and Rowley Fields, Fosse, New Parks, Westcotes, and Western Park.
2024-: The City of Leicester wards of Abbey, Beaumont Leys, Braunstone Park and Rowley Fields, Fosse, Aylestone, New Parks, Westcotes, and Western Park.
Leicester West is the whitest of the three Leicester constituencies, and the one with the highest proportion of social housing. Some areas of the seat, such as Braunstone and Beaumont Leys, are made up of large local authority estates, and around 30% of the housing is council- or housing association-owned, the second-highest in the Midlands. The centre of the seat, the Westcotes area, is more inner-city in character and is popular with young professionals and students. [2]
Historically this used to be the safest Labour seat in Leicester—in the 1983 general election it was the only one to remain in Labour hands. However, the high Asian populations in Leicester South and Leicester East have pushed them away from the Conservative Party; while Leicester West is still a safe Labour seat, represented by that party since the Second World War, it is the most marginal of the three Leicester seats. [2] While it did, like the other two Leicester seats, see a significant swing to Labour in 2017, unlike the other two seats Liz Kendall's majority was not a record high for the constituency.
As of 2009, in the depths of the late-2000s recession, the constituency had the fourth-highest level of unemployment in Britain, with 13.8% of residents registered unemployed. Most of the unemployment is concentrated in areas such as Braunstone, which is traditionally one of the most deprived parts of the city. [3]
In 1950, the seat was replaced by the constituencies of Leicester North West and Leicester South West, until 1974. In that period, Leicester North West was represented by Barnett Janner until 1970, and then by his son Greville Janner.
Election | Member [4] | Party | |
---|---|---|---|
1918 | Joseph Frederick Green | Coalition National Democratic | |
1922 | Alfred Hill | Labour | |
1923 | Frederick Pethick-Lawrence | Labour | |
1931 | Ernest Pickering | Liberal | |
1935 | Harold Nicolson | National Labour | |
1945 | Barnett Janner | Labour | |
1950 | constituency abolished | ||
Feb 1974 | Greville Janner | Labour | |
1997 | Patricia Hewitt | Labour | |
2010 | Liz Kendall | Labour |
Party | Candidate | Votes | % | ±% | |
---|---|---|---|---|---|
Majority | |||||
Turnout | |||||
Swing | |||||
Party | Candidate | Votes | % | ±% | |
---|---|---|---|---|---|
Labour | Liz Kendall | 17,291 | 49.7 | -11.1 | |
Conservative | Amanda Wright | 13,079 | 37.6 | +6.2 | |
Liberal Democrats | Ian Bradwell | 1,808 | 5.2 | +3.1 | |
Brexit Party | Jack Collier | 1,620 | 4.7 | New | |
Green | Ani Goddard | 977 | 2.8 | +1.2 | |
Majority | 4,212 | 12.1 | -17.3 | ||
Turnout | 34,775 | 53.6 | -4.3 | ||
Labour hold | Swing | -8.7 | |||
Party | Candidate | Votes | % | ±% | |
---|---|---|---|---|---|
Labour | Liz Kendall | 22,823 | 60.8 | +14.3 | |
Conservative | Jack Hickey | 11,763 | 31.4 | +5.8 | |
UKIP | Stuart Young | 1,406 | 3.7 | -13.5 | |
Liberal Democrats | Ian Bradwell | 792 | 2.1 | -2.3 | |
Green | Mel Gould | 607 | 1.6 | -3.8 | |
Independent | David Bowley | 121 | 0.3 | New | |
Majority | 11,060 | 29.4 | +8.5 | ||
Turnout | 37,512 | 57.9 | +3.3 | ||
Labour hold | Swing | +4.3 | |||
Party | Candidate | Votes | % | ±% | |
---|---|---|---|---|---|
Labour | Liz Kendall | 16,051 | 46.5 | +8.1 | |
Conservative | Paul Bessant | 8,848 | 25.6 | -1.6 | |
UKIP | Stuart Young | 5,950 | 17.2 | +14.7 | |
Green | Peter Hague | 1,878 | 5.4 | +3.6 | |
Liberal Democrats | Ian Bradwell | 1,507 | 4.4 | -18.2 | |
TUSC | Heather Rawling | 288 | 0.8 | +0.4 | |
Majority | 7,203 | 20.9 | +9.7 | ||
Turnout | 34,522 | 54.6 | -0.6 | ||
Labour hold | Swing | +4.8 | |||
Party | Candidate | Votes | % | ±% | |
---|---|---|---|---|---|
Labour | Liz Kendall | 13,745 | 38.4 | -12.4 | |
Conservative | Celia Harvey | 9,728 | 27.2 | +2.8 | |
Liberal Democrats | Peter Coley | 8,107 | 22.6 | +4.4 | |
BNP | Gary Reynolds | 2,158 | 6.0 | New | |
UKIP | Stephen Ingall | 883 | 2.5 | New | |
Green | Geoff Forse | 639 | 1.8 | -3.0 | |
Independent | Steven Huggins | 181 | 0.5 | New | |
TUSC | Steve Score [10] | 157 | 0.4 | New | |
Pirate | Shaun Dyer | 113 | 0.3 | New | |
Independent | David Bowley | 108 | 0.3 | New | |
Majority | 4,017 | 11.2 | -16.1 | ||
Turnout | 35,819 | 55.2 | +2.6 | ||
Labour hold | Swing | -7.6 | |||
Party | Candidate | Votes | % | ±% | |
---|---|---|---|---|---|
Labour | Patricia Hewitt | 17,184 | 51.7 | −2.5 | |
Conservative | Sarah Richardson | 8,114 | 24.4 | −0.8 | |
Liberal Democrats | Zuffar Haq | 5,803 | 17.5 | +2.2 | |
Green | Geoff Forse | 1,571 | 4.7 | +1.5 | |
Socialist Alternative | Steve Score | 552 | 1.7 | New | |
Majority | 9,070 | 27.3 | -1.7 | ||
Turnout | 33,224 | 53.3 | +2.4 | ||
Labour hold | Swing | -0.8 | |||
Party | Candidate | Votes | % | ±% | |
---|---|---|---|---|---|
Labour | Patricia Hewitt | 18,014 | 54.2 | −1.0 | |
Conservative | Christopher Shaw | 8,375 | 25.2 | +1.5 | |
Liberal Democrats | Andy Vincent | 5,085 | 15.3 | +1.1 | |
Green | Matthew Gough | 1,074 | 3.2 | +1.8 | |
Socialist Labour | Sean Kirkpatrick | 350 | 1.1 | 0.0 | |
Socialist Alliance | Stephen Score | 321 | 1.0 | New | |
Majority | 9,639 | 29.0 | -2.5 | ||
Turnout | 33,219 | 50.9 | −12.2 | ||
Labour hold | Swing | -1.2 | |||
Party | Candidate | Votes | % | ±% | |
---|---|---|---|---|---|
Labour | Patricia Hewitt | 22,580 | 55.2 | +8.4 | |
Conservative | Richard Thomas | 9,716 | 23.7 | -14.8 | |
Liberal Democrats | Mark Jones | 5,795 | 14.2 | +0.9 | |
Referendum | William Shooter | 970 | 2.4 | New | |
Green | Geoff Forse | 586 | 1.4 | +0.3 | |
Socialist Labour | David Roberts | 452 | 1.1 | New | |
Socialist Alternative | Josephine Nicholls | 327 | 0.8 | New | |
BNP | Adrian Belshaw | 302 | 0.7 | New | |
National Democrats | Clive Potter | 186 | 0.5 | New | |
Majority | 12,864 | 31.5 | +23.2 | ||
Turnout | 40,914 | 63.1 | -10.6 | ||
Labour hold | Swing | +11.6 | |||
Party | Candidate | Votes | % | ±% | |
---|---|---|---|---|---|
Labour | Greville Janner | 22,574 | 46.8 | +2.3 | |
Conservative | John Guthrie | 18,596 | 38.5 | −3.6 | |
Liberal Democrats | Geoffrey F. Walker | 6,402 | 13.3 | −0.2 | |
Green | Claire D. Wintram | 517 | 1.1 | New | |
Natural Law | Jenny M. Rosta | 171 | 0.4 | New | |
Majority | 3,978 | 8.3 | +5.9 | ||
Turnout | 48,260 | 73.7 | +0.2 | ||
Labour hold | Swing | +2.9 | |||
Party | Candidate | Votes | % | ±% | |
---|---|---|---|---|---|
Labour | Greville Janner | 22,156 | 44.5 | -0.3 | |
Conservative | James Cooper | 20,955 | 42.1 | +1.0 | |
SDP | William Edgar | 6,708 | 13.5 | +0.8 | |
Majority | 1,201 | 2.4 | -1.3 | ||
Turnout | 49,819 | 73.5 | +4.7 | ||
Labour hold | Swing | -1.3 | |||
Party | Candidate | Votes | % | ±% | |
---|---|---|---|---|---|
Labour | Greville Janner | 20,837 | 44.8 | -8.8 | |
Conservative | Robert Meacham | 19,125 | 41.1 | +5.7 | |
SDP | Sumal Fernando | 5,935 | 12.8 | New | |
BNP | Ray Hill | 469 | 1.0 | New | |
Workers Revolutionary | B.J. Prangle | 176 | 0.4 | New | |
Majority | 1,712 | 3.7 | -14.5 | ||
Turnout | 46,542 | 68.8 | -3.5 | ||
Labour hold | Swing | -7.3 | |||
Party | Candidate | Votes | % | ±% | |
---|---|---|---|---|---|
Labour | Greville Janner | 26,032 | 53.60 | +0.69 | |
Conservative | Alastair Ross Goobey | 17,194 | 35.40 | +5.01 | |
Liberal | A. Lycett | 4,032 | 8.30 | -3.31 | |
National Front | P. Ash | 1,308 | 2.69 | -0.75 | |
Majority | 8,838 | 18.20 | |||
Turnout | 48,566 | 72.26 | |||
Labour hold | Swing | -4.32 | |||
Party | Candidate | Votes | % | ±% | |
---|---|---|---|---|---|
Labour | Greville Janner | 23,406 | 52.91 | ||
Conservative | A. Simpson | 13,446 | 30.39 | ||
Liberal | J. Windram | 5,135 | 11.61 | New | |
National Front | W. Newcombe | 2,253 | 5.09 | ||
Majority | 9,960 | 22.52 | |||
Turnout | 44,240 | 68.43 | |||
Labour hold | Swing | ||||
Party | Candidate | Votes | % | ±% | |
---|---|---|---|---|---|
Labour | Greville Janner | 27,195 | 56.28 | ||
Conservative | A. Simpson | 18,543 | 38.38 | ||
National Front | W. Newcombe | 2,579 | 5.34 | ||
Majority | 8,652 | 17.90 | |||
Turnout | 48,317 | 75.45 | |||
Labour win (new seat) |
Party | Candidate | Votes | % | ±% | |
---|---|---|---|---|---|
Labour | Barnett Janner | 20,563 | 53.34 | ||
National Labour | Harold Nicolson | 13,348 | 34.63 | ||
Liberal | Joseph Arnold Kirby | 4,639 | 12.03 | ||
Majority | 7,215 | 18.71 | N/A | ||
Turnout | 38,550 | 76.80 | |||
Labour gain from National Labour | Swing | ||||
Party | Candidate | Votes | % | ±% | |
---|---|---|---|---|---|
National Labour | Harold Nicolson | 15,821 | 43.73 | New | |
Labour | John Morgan | 15,734 | 43.49 | ||
Liberal | Horace Crawfurd | 4,621 | 12.77 | ||
Majority | 87 | 0.24 | N/A | ||
Turnout | 35,636 | 66.83 | |||
National Labour gain from Liberal | Swing | ||||
Party | Candidate | Votes | % | ±% | |
---|---|---|---|---|---|
Liberal | Ernest Pickering | 26,826 | 67.49 | ||
Labour | Frederick Pethick-Lawrence | 12,923 | 32.51 | ||
Majority | 13,903 | 34.98 | N/A | ||
Turnout | 39,749 | 74.64 | |||
Liberal gain from Labour | Swing | ||||
Party | Candidate | Votes | % | ±% | |
---|---|---|---|---|---|
Labour | Frederick Pethick-Lawrence | 22,635 | 55.3 | +4.1 | |
Unionist | Paul Emrys-Evans | 10,691 | 26.1 | New | |
Liberal | Charles William Hartshorn | 7,617 | 18.6 | −30.2 | |
Majority | 11,944 | 29.2 | +26.8 | ||
Turnout | 40,943 | 78.3 | +2.2 | ||
Registered electors | 52,318 | ||||
Labour hold | Swing | +17.2 | |||
Party | Candidate | Votes | % | ±% | |
---|---|---|---|---|---|
Labour | Frederick Pethick-Lawrence | 16,047 | 51.2 | +6.6 | |
Liberal | Maurice Alfred Gerothwohl | 15,310 | 48.8 | +18.6 | |
Majority | 737 | 2.4 | −12.0 | ||
Turnout | 31,357 | 76.1 | +0.1 | ||
Registered electors | 41,207 | ||||
Labour hold | Swing | −6.0 | |||
Party | Candidate | Votes | % | ±% | |
---|---|---|---|---|---|
Labour | Frederick Pethick-Lawrence | 13,634 | 44.6 | −0.4 | |
Liberal | Winston Churchill | 9,236 | 30.2 | +3.6 | |
Unionist | Alfred Instone | 7,696 | 25.2 | New | |
Majority | 4,398 | 14.4 | −2.2 | ||
Turnout | 30,566 | 76.0 | +3.5 | ||
Registered electors | 40,244 | ||||
Labour hold | Swing | −2.0 | |||
Party | Candidate | Votes | % | ±% | |
---|---|---|---|---|---|
Labour | Alfred Hill | 12,929 | 45.0 | +21.4 | |
National Democratic | Joseph Frederick Green | 8,137 | 28.4 | −48.0 | |
Liberal | Ernest Spero | 7,631 | 26.6 | New | |
Majority | 4,792 | 16.6 | N/A | ||
Turnout | 28,697 | 72.5 | +6.3 | ||
Registered electors | 39,604 | ||||
Labour gain from National Democratic | Swing | +34.7 | |||
Party | Candidate | Votes | % | ±% | |
---|---|---|---|---|---|
C | National Democratic | Joseph Frederick Green | 20,570 | 76.4 | |
Labour | Ramsay MacDonald | 6,347 | 23.6 | ||
Majority | 14,223 | 52.8 | |||
Turnout | 26,917 | 66.2 | |||
Registered electors | 40,634 | ||||
National Democratic win (new seat) | |||||
Cindicates candidate endorsed by the coalition government. |
Lewisham Deptford is a parliamentary constituency represented in the House of Commons of the UK Parliament since 2015 by Vicky Foxcroft of the Labour Party.
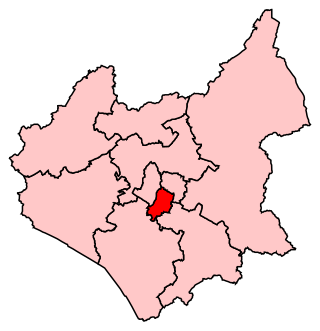
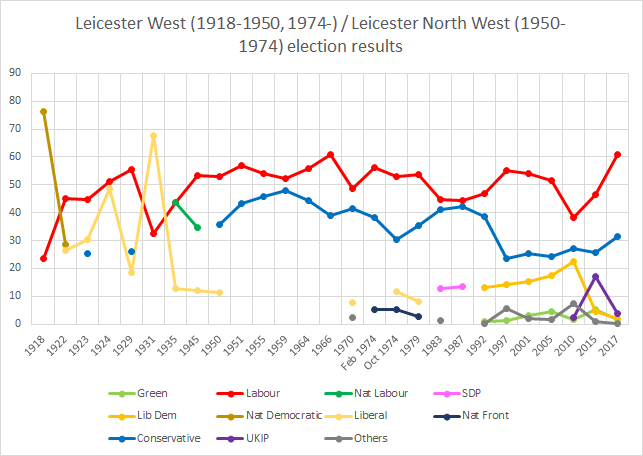
Leicester South is a constituency, recreated in 1974, represented in the House of Commons of the UK Parliament since 2011 by Jonathan Ashworth of the Labour Co-op Party. A previous version of the seat existed between 1918 and 1950. Except for a 2004 by-election when it was won by the Liberal Democrats, Leicester South has been held by the Labour Party since 1987.
Reading East is a constituency represented in the House of Commons of the UK Parliament since 2017 by Matt Rodda, of the Labour Party. The seat is one of two Labour seats from a total of eight seats in Berkshire.
Oxford East is a constituency represented in the House of Commons of the UK Parliament by Anneliese Dodds of the Labour Party, who also serves as party chair.
Oxford West and Abingdon is a constituency represented in the House of Commons of the UK Parliament since 2017 by Layla Moran, a Liberal Democrat.
Birmingham Selly Oak is a constituency in the West Midlands, represented in the House of Commons of the UK Parliament since 2010 by Steve McCabe of the Labour Party.
Wimbledon is a constituency in Greater London represented in the House of Commons of the UK Parliament. Since 2005, the seat has been held by Stephen Hammond of the Conservative Party.
East Ham is a constituency in the London Borough of Newham represented in the House of Commons of the UK Parliament since its creation in 1997 by Stephen Timms of the Labour Party.
Middlesbrough South and East Cleveland is a constituency created in 1997 represented in the House of Commons of the UK Parliament since 2017 by Simon Clarke of the Conservative Party.
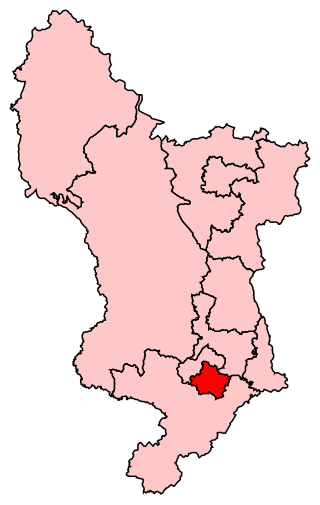
Derby South is a constituency formed of part of the city of Derby represented in the House of Commons of the UK Parliament since 1983 by veteran MP Margaret Beckett of the Labour Party. She has served under the Labour governments of Harold Wilson, James Callaghan, Tony Blair and Gordon Brown. She became interim Leader of the Labour Party in 1994 when John Smith suddenly died. She has also served under Neil Kinnock and Smith himself.
Nottingham South is a constituency of the Parliament of the United Kingdom, represented since 2010 by Lilian Greenwood of the Labour Party.
Stoke-on-Trent Central is a constituency in Staffordshire. It has been represented by Jo Gideon of the Conservative Party since the general election of 2019.
Stoke-on-Trent South is a constituency created in 1950, and represented in the House of Commons of the UK Parliament since 2017 by Jack Brereton, a Conservative. The local electorate returned a Labour MP in every election until 2017, when Brereton became its first Conservative MP. The seat is non-rural and in the upper valley of the Trent covering half of the main city of the Potteries, a major ceramics centre since the 17th century.
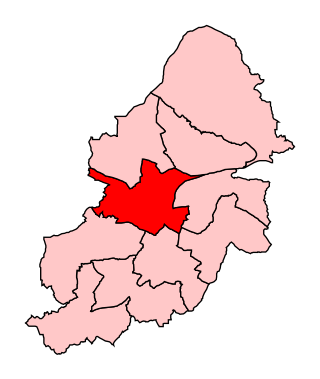
Birmingham Ladywood is a constituency of part of the city of Birmingham, represented in the House of Commons since 2010 by Shabana Mahmood of the Labour Party.
Halesowen and Rowley Regis is a constituency in the West Midlands represented in the House of Commons of the UK Parliament since 2010 by James Morris, a Conservative.
West Bromwich East is a constituency that is represented in the House of Commons of the UK Parliament by Nicola Richards of the Conservative Party, who was first elected at the 2019 United Kingdom general election.
West Bromwich West is a constituency represented in the House of Commons of the UK Parliament since 2019 by Shaun Bailey, a member of the Conservative Party.
Barking is a constituency in Greater London represented in the House of Commons of the UK Parliament. Since its formation in 1945, it has consistently returned a member of the Labour Party as its Member of Parliament (MP). Since 1994, its MP has been Margaret Hodge.
Gillingham and Rainham is a constituency in Kent represented in the House of Commons of the UK Parliament since its 2010 creation by Rehman Chishti, a Conservative. It replaced the previous constituency of Gillingham.