Demographics of South Africa

Last updated

Demographics of South Africa
South Africa single age population pyramid 2020.png
South Africa population pyramid in 2020
Population62 million (2022 Census) [1] [2]
Density48.1/km2 (125/sq mi)
Growth rate1.06% [2] :26
Birth rate19.5 births/1,000 population (2022 est.) [2] :21
Death rate11.0 deaths/1,000 population (2022) [2] :21
Life expectancy64.7 years (2019 est.)[ citation needed ]
  male64.8 years (2022 est.) [2] :15
  female71.3 years (2022 est.) [2] :15
Fertility rate2.34 children born/woman (2022 est.) [2] :15
Infant mortality rate24.3 deaths/1,000 (2022 est.) [2] :21
Age structure
0–14 years28.8% (2019 est.)[ citation needed ]
15–64 years65.2% (2019 est.)[ citation needed ]
65 and over6% (2019 est.)[ citation needed ]
Sex ratio
Total0.99 male(s)/female (2010 est.)[ citation needed ]
At birth1.02 male(s)/female[ citation needed ]
Under 151 male(s)/female[ citation needed ]
15–64 years1.02 male(s)/female[ citation needed ]
65 and over0.68 male(s)/female[ citation needed ]
Nationality
NationalitySouth African
Language
OfficialSee Languages of South Africa
Population density in South Africa (darker color = higher density) South Africa 2011 population density map (hex cells).svg
Population density in South Africa (darker color = higher density)

According to the 2022 census, the population of South Africa is about 62 million people of diverse origins, cultures, languages, and religions. [1] The South African National Census of 2022 was the most recent census held; the next will be in 2032. [3]

Contents

In 2011, Statistics South Africa counted 2.1 million foreigners in total. [4] Reports[ specify ] suggest that is an underestimation. The real figure may be as high as five million, [5] including some three million Zimbabweans. [6]

History

Historical population of South Africa Historical population of South Africa.svg
Historical population of South Africa

Population

Earlier Censuses, 1904 to 2011

1904 Census

South African population figures for the 1904 Census. [7]

Colony
Pop.
Group
Cape Colony Natal Transvaal Orange River
Colony
TotalPercent
Black  1,424,787904,041937,127225,1013,491,05667.5%
White 579,74197,109297,277142,6901,116,80521.6%
Coloured 395,0346,68624,22619,282445,2288.6%
Indian 10,242100,91811,321253122,7342.4%
Total2,409,8041,108,7541,269,951387,3155,175,463100.0%
% of S. Africa46.6%21.4%24.5%7.5%100%

1960 Census

Sources: Statesman's Year-Book 1967–1968; [8] Europa Year Book 1969 [9]

Province
Pop. Group
Cape of
Good Hope
Natal Transvaal Orange
Free State
TotalPercent
Black 3,011,0802,199,9204,633,3781,083,88610,928,26468.3%
White 1,003,207340,2351,468,305276,7453,088,49219.3%
Coloured 1,330,08945,253108,00725,9091,509,2589.4%
Indian 18,477394,85463,7877477,1253.0%
Total5,362,8532,980,2626,273,4771,386,54716,003,139100.0%
% of S. Africa33.5%18.6%39.2%8.7%100.0%

1904–85 national census numbers

Bantustan demographics were removed from South African census data during Apartheid and for this reason official figures on the national population of the country during that period will be inaccurate. [10]

Population Size by Race, 1904–85 (1,000 people)
YearBlacksWhitesColouredsAsiansTotal
Popu-
lation (1,000 people)
%Popu-
lation (1,000 people)
%Popu-
lation (1,000 people)
%Popu-
lation (1,000 people)
%Popu-
lation
(1,000 people)
Area included
19044,01967.3%1,11721.6%4458.6%1222.4%5,174South Africa
19113,49067.5%1,27621.4%5258.8%1522.6%5,972South Africa
19214,69767.8%1,52122.0%5457.9%1632.4%6,926South Africa
19366,59668.8%2,00320.9%7698.0%2202.3%9,588South Africa
19467,83068.6%2,37220.8%9288.1%2852.5%11,415South Africa
19518,56067.6%2,64220.9%1,1038.7%3672.9%12,672South Africa
196010,92868.3%3,08819.3%1,5099.4%4773.0%16,002South Africa
197011,89164.9%3,75920.5%2,03911.1%6303.4%18,319South Africa - excluding Transkei, Bophuthatswana, Venda & Ciskei
197015,34070.4%3,77317.3%2,0519.4%6302.9%21,794South Africa
198013,13563.9%4,22120.5%2,45912.0%7483.6%20,563South Africa - excluding Transkei, Bophuthatswana & Venda
198016,99268.0%4,51218.1%2,68810.8%8033.2%24,995South Africa - estimate
198515,16364.8%4,56919.5%2,83312.1%8213.51%23,386South Africa - excluding Transkei, Bophuthatswana, Venda & Ciskei
198519,05268.8%4,83717.5%2,3968.7%8793.2%27,704South Africa - estimate
YearBlacksWhitesColouredsAsiansTotalArea included

1996 Census

Source: The People of South Africa: Population Census, 1996 [11]

map
Population
Group
Province ↓
BlackWhiteColouredIndian/
Asian
OtherTotal% of
S.A.
1 Northern Cape in South Africa.svg Northern Cape 278,633111,844435,3682,26812,208840,3212.1%
2 Western Cape in South Africa.svg Western Cape 826,691821,5512,146,10940,376122,1483,956,8759.7%
3 Eastern Cape in South Africa.svg Eastern Cape 5,448,495330,294468,53219,35635,8496,302,52515.5%
4 KwaZulu-Natal in South Africa.svg KwaZulu-Natal 6,880,652558,182117,951790,81369,4238,417,02120.7%
5 Mpumalanga in South Africa.svg Mpumalanga 2,497,834253,39220,28313,08316,1202,800,7116.9%
6 Free State in South Africa.svg Free State 2,223,940316,45979,0382,80511,2622,633,5046.5%
7 Gauteng in South Africa.svg Gauteng 5,147,4441,702,343278,692161,28958,6547,348,42318.1%
8 Limpopo in South Africa.svg Northern Province
(Limpopo)
4,765,255117,8787,8215,51032,9044,929,36812.1%
9 North West in South Africa.svg North West 3,058,686222,75546,65210,09716,6353,354,8258.3%
Map of South Africa with provincial borders.svg South Africa Total31,127,631 4,434,6973,600,4461,045,596375,20440,583,573100%
Percent76.7%10.9%8.9%2.6%0.9%100%
Population Group →BlackWhiteColouredAsianOtherTotal% of RSA

2001 Census

Source: Statistics South Africa: Census 2001 [12]

Province
Pop. Group
Eastern Cape Free State Gauteng KwaZulu-Natal Limpopo Mpumalanga Northern Cape North West Western Cape TotalPercent
Black 5,635,0792,381,0736,522,7928,002,4075,128,6162,886,345293,9763,358,4501,207,42935,416,16679.0%
White 304,506238,7911,758,398483,448126,276203,244102,042244,035832,9014,293,6409.6%
Coloured 478,80783,193337,974141,88710,16322,158424,38956,9592,438,9763,994,5058.9%
Indian/Asian 18,3723,719218,015798,2758,58711,2442,3209,90645,0301,115,4672.5%
Total6,436,763 2,706,7758,837,1789,426,0175,273,6423,122,990822,7273,669,3494,524,33544,819,778100.0%
% of S.A.14.4%6.0%19.7%21.0%11.8%7.0%1.8%8.2%10.1%100%

2011 Census

Source: Census 2011: Census in Brief [13]

Province
Pop. Group
Eastern Cape Free State Gauteng KwaZulu-Natal Limpopo Mpumalanga Northern Cape North West Western Cape TotalPercent
Black 5,660,2302,405,5339,493,6848,912,9215,224,7543,662,219576,9863,152,0631,912,54741,000,938 79.2%
Coloured 541,85083,844423,594141,37614,41536,611461,89971,4092,840,4044,615,4018.9%
White 310,450239,0261,913,884428,842139,359303,59581,246255,385915,0534,586,8388.9%
Indian/Asian 27,92910,398356,574756,99117,88127,9177,82720,65260,7611,286,9302.5%
Other21,5956,79084,52727,1708,4599,59717,90310,44493,969280,4540.5%
Total6,562,053 2,745,59012,272,26310,267,3005,404,8684,039,9391,145,8613,669,3495,822,73451,770,560100.0%
% of S.A.12.7%5.3%23.7%19.8%10.4%7.8%2.2%7.1%11.2%100%
Historical population
YearPop.±% p.a.
1100,000    
1000300,000+0.11%
1500600,000+0.14%
1600700,000+0.15%
17001,000,000+0.36%
18201,550,000+0.37%
18702,547,000+1.00%
19045,175,463+2.11%
19115,972,757+2.07%
19136,153,000+1.50%
19216,927,403+1.49%
19369,587,863+2.19%
194611,415,925+1.76%
195013,683,162+4.63%
195515,384,557+2.37%
196017,396,367+2.49%
197022,502,502+2.61%
198029,077,143+2.60%
199036,793,490+2.38%
199541,426,810+2.40%
200144,819,777+1.32%
200748,502,063+1.32%
201151,770,560+1.64%
201655,653,654+1.46%
202262,027,503+1.82%
Note: Population estimates (1 AD - 1870 AD) are deduced from quantitative macroeconomic historical calculations. 1 (est.), 1000 (est.), 1500 (est.), 1600 (est.), 1700 (est.), 1820 (est.), 1870 (est.), 1913, [14] 1904 [7] 1904-1946, [15] [16] [17] 1950-2010, [18] 2001, 2011, 2015 [19]


Historical and projected population for the years 1 to 2100

UN Age and population estimates: 1950 to 2030

According to the 2019 revision of the United Nations Secretariat's World Population Prospects , South Africa's total population was 55,386,000 in 2015, compared to only 13,628,000 in 1950. In 2015, 29.3% of the people were children under the age of 15, 65.7% were between 15 and 64 years of age, and 5.0% were 65 or older. [20] All population estimates are rounded to the nearest thousand.

YearTotal populationPercentage
under 15
years old
Percentage
15 to 64
years old
Percentage
at least 65
years old
195013,628,00038.257.74.1
195515,207,00039.556.53.9
196017,100,00040.855.43.9
196519,385,00041.954.33.8
197022,070,00041.654.73.8
197525,195,00041.255.03.8
198028,557,00040.955.33.9
198532,679,00040.855.43.9
199036,801,00040.155.94.0
199541,436,00037.358.44.3
200044,968,00033.961.64.5
200547,881,00030.964.54.6
201051,217,00029.765.64.8
201555,386,00029.365.75.0
202059,309,00028.865.75.5
202562,803,00027.466.56.1
203065,956,00025.867.66.7

UN population projections: 2019 to 2100

U.N. Population projections
YearPop.±% p.a.
201958,558,000    
203065,956,000+1.09%
205075,518,000+0.68%
210079,191,000+0.10%
Note that the average percentage changes are per year (per annum), and not the total change over the period between estimates
Source: United Nations Secretariat [21]

[22] [ failed verification ]

Vital statistics

Statistics South Africa: From 2002 to present

The following statistics are obtained from the mid-year population estimates published by Statistics South Africa: [23]

  Population estimates for South Africa 2002-2020
Average populationLive birthsDeathsNatural changeCrude birth rate (per 1,000)Crude death rate (per 1,000)Natural change (per 1,000) Total fertility rates
200246,355,083983,092596,983386,10921.212.98.72.45
200346,806,354991,067617,135373,93221.213.28.02.42
200447,310,0501,057,881645,841412,04022.413.78.72.54
200547,860,3601,102,207673,977428,23023.014.18.92.59
200648,446,4141,137,157696,827440,33023.514.49.12.63
200749,088,6991,171,370696,160475,21023.914.29.72.65
200849,794,5601,196,958686,582510,37624.013.810.22.66
200950,544,9311,203,604643,045560,55923.812.711.12.62
201051,328,6621,203,967603,347600,62023.511.811.72.58
201152,129,1171,192,033561,381630,65222.910.812.12.51
201252,930,3561,184,320544,956639,36422.410.312.12.46
201353,751,0951,179,957535,678644,27922.010.012.02.42
201454,574,4011,177,893521,005656,88821.69.512.12.39
201555,406,6341,167,002525,739641,26321.19.511.62.35
201656,252,3361,145,354517,030628,32420.49.211.22.29
201757,097,8571,168,092515,722652,37020.59.011.52.33
201857,939,2261,182,107516,635665,47220.48.911.52.35
201958,775,0221,178,116518,613659,50320.08.811.22.34
202059,622,3501,173,943519,865654,07819.78.7112.33
202160,142,9781,166,304695,913470,39119.411.67.82.31
202262,027,5031,175,776663,075512,70118.9510.698.26
Mid-year population estimates for South Africa by population group and sex, 2020
Population GroupMaleFemaleTotal
Number% Distribution of MalesNumber% Distribution of FemalesNumber% Distribution of Total
Black African23,519,47480.724,634,25380.848,153,72780.8
Coloured2,555,2048.82,692,5368.85,247,7408.8
Indian/Asian787,6622.7753,4512.51,541,1132.6
White2,266,5357.82,413,2357.94,679,7707.8
Total29,128,875100.030,493,475100.059,622,350100.0
  Mid-year population estimates for South Africa by province, 2020

United Nations estimates, 2019

The Population Department of the United Nations prepared the following estimates. [20] (Natural increase or decrease over a time period is the difference between that period's live births and deaths, before accounting for inward or outward migration.)

PeriodLive births per yearDeaths per yearNatural Increase per yearCrude Birth Rate
(per 1,000 per year)
Crude Death Rate
(per 1,000 per year)
Natural Increase
(per 1,000 per year)
Total Fertility Rate (over av'ge woman's life)Infant Mortality Rate (per 100,000 live births)
1950–1955606,600292,400+ 314,20042.120.7+ 21.86.05134
1955–1960669,400293,800+ 375,60041.418.2+ 23.36.05121
1960–1965740,200304,600+ 435,60040.616.7+ 23.96.00112
1965–1970810,600313,600+ 497,00039.115.2+ 24.05.80103
1970–1975896,000315,400+ 580,60037.913.3+ 24.65.5089
1975–1980967,400309,800+ 657,60036.011.5+ 24.55.0571
1980–19851,099,200311,000+ 788,20035.910.2+ 25.74.9056
1985–19901,147,400299,400+ 848,00033.08.6+ 24.44.4046
1990–19951,074,600318,000+ 756,60027.58.1+ 19.33.5141
1995–20001,026,600448,000+ 578,60023.810.4+ 13.42.8847
2000–20051,051,600626,800+ 424,80022.713.5+  9.22.6154
2005–20101,166,200671,400+ 494,80023.513.6+ 10.02.6248
2010–20151,207,200557,200+ 650,00022.610.5+ 12.22.5533
2015–20201,185,000546,000+ 639,00020.79.5+ 11.12.4127
2020–20251,159,600573,200+ 586,40019.09.4+  9.62.3124
2025–20301,143,400604,400+ 539,00017.89.4+  8.42.2221
Total Fertility Rate = average number of children over a woman's lifetime; Infant Mortality Rate per 100,000 live births

Age and sex distribution

Population pyramid, 2011 Rza-age-2011.svg
Population pyramid, 2011
Age groupMaleFemale percentFemaleTotalPercent of RSA
0–147,969,88049.6%7,842,38815,812,26831.3%
15–6415,538,93451.8%16,696,60032,235,53463.7%
65+1,006,22251.8%1,532,7332,538,9555.0%
All ages24,515,03651.5%26,071,72150,586,757100%
Age groupMaleFemale percentFemaleTotalPercent of RSA
under 52,867,58549.6%2,817,8675,685,45211.0%
5–92,425,18149.7%2,394,5704,819,7519.3%
10–142,344,27549.0%2,250,6114,594,8868.9%
15–192,498,57250.1%2,504,9055,003,4779.7%
20–242,694,64649.9%2,679,8965,374,54210.4%
25–292,542,68249.7%2,516,6355,059,3179.8%
30–342,036,20649.5%1,992,8044,029,0107.8%
35–391,709,34750.7%1,758,4203,467,7676.7%
40–441,402,32852.4%1,546,2912,948,6195.7%
45–491,195,74054.4%1,424,5432,620,2835.1%
50–541,011,34954.4%1,206,9402,218,2894.3%
55–59811,95054.8%985,4581,797,4083.5%
60–64612,36455.8%773,4041,385,7682.7%
65–69401,54858.1%556,256957,8041.9%
70–74293,49860.8%454,832748,3301.4%
75–79165,28365.7%315,984481,2670.9%
80–84100,69468.8%222,222322,9160.6%
85-plus75,54370.5%180,130255,6730.5%
TOTAL25,188,79151.3%26,581,76951,770,560100%
Number of children 0–14Number of women 15–49ProportionFertility Rate
15,812,26413,866,4891.142.35

Age and race distribution

Age distribution within each racial group

By generation
Age groupAll races% of AllBlack African% of BlacksColoured% of Col'dWhite% of WhitesIndian or other Asian% of AsiansOthers% of others
0–1415,100,08929.2%12,702,32431.0%1,311,81128.4%771,18716.8%258,60220.1%56,16420.0%
15–6433,904,47965.5%26,502,32964.6%3,085,68466.9%3,165,96568.9%939,37973.0%211,12675.3%
65-plus2,765,9925.3%1,796,2854.4%217,9064.7%649,68614.2%88,9496.9%13,1644.7%
All ages51,770,560100%41,000,938(100%)4,615,401(100%)4,586,838(100%)1,286,930(100%)280,454(100%)
% of SA100%79.20%8.92%8.86%2.49%0.54%


Racial composition of each age group in 2015 (estimates)

Age groupAll races% of All Black% of BlacksColoured% of Col'dWhite% of WhitesIndian or other Asian% of Asians
0–1416,612,04330.23%14,244,66332.21%1,288,60126.66%789,49217.41%289,28521.24%
15–6435,465,49964.53%28,170,79763.69%3,299,77168.28%3,026,47566.75%968,64971.12%
65-plus2,879,3785.24%1,812,5354.10%244,5445.06%718,04115.84%104.0687.64%
All ages54,956,920100%44,227,995(100%)4,832,916(100%)4,534,008(100%)1,362,002(100%)
% of SA100%80.48%8.79%8.25%2.48%
By five-year cohorts
Age groupAll races% of AllBlack African% of BlacksColoured% of Col'dWhite% of WhitesIndian or Asian% of Asians
under 55,936,35010.80%5,156,50811.66%426,1568.82%254,9785.62%98,7087.25%
5 to 95,537,22510.08%4,746,11510.73%430,6668.91%263,3785.81%97,0657.13%
10 to 145,138,4689.35%4,342,0409.82%431,7798.93%271,1365.98%93,5126.87%
15 to 195,124,3739.32%4,292,2209.70%437,4129.05%295,7336.52%99,0077.27%
20 to 245,302,2469.65%4,461,51510.09%426,0138.81%306,4156.76%108,3047.95%
25 to 295,232,2549.52%4,437,57010.03%389,4298.06%287,4856.34%117,7718.65%
30 to 344,307,6937.84%3,535,1737.99%366,9557.59%281,3586.21%124,2069.12%
35 to 393,774,9216.87%3,001,9896.79%376,4887.79%279,4396.16%117,0058.59%
40 to 443,204,9525.83%2,444,9725.53%368,8867.63%288,3706.36%102,7257.54%
45 to 492,738,5804.98%2,004,0094.53%307,3636.36%335,4347.40%91,7746.74%
50 to 542,297,5864.18%1,619,2493.66%264,5935.47%332,9777.34%80,7675.93%
55 to 591,942,9423.54%1,334,8003.02%209,9334.34%328,9997.26%69,2105.08%
60 to 641,539,9532.80%1,039,3012.35%152,6983.16%290,0756.40%57,8794.25%
65 to 691,153,1592.10%737,5811.67%105,4032.18%265,8185.86%44,3573.26%
70 to 74805,1141.46%511,7231.16%65,4651.35%198,8764.39%28,9492.13%
75 to 79502,0050.91%313,8000.71%41,9780.87%128,6752.84%17,5521.29%
80-plus419,1000.76%249,4310.56%31,6980.66%124,6722.75%13,2100.97%
All ages54,956,920100%44,227,995(100%)4,832,916(100%)4,534,008(100%)1,362,002(100%)
% of SA100%80.48%8.79%8.25%2.48%
Age groupAll racesBlack African% of age grpColoured% of age grpWhite% of age grpIndian or Asian% of age grp
under 55,936,3505,156,50886.86%426,1567.18%254,9784.30%98,7081.66%
5 to 95,537,2254,746,11585.71%430,6667.78%263,3784.76%97,0651.75%
10 to 145,138,4684,342,04084.50%431,7798.40%271,1365.28%93,5121.82%
15 to 195,124,3734,292,22083.76%437,4128.54%295,7335.77%99,0071.93%
20 to 245,302,2464,461,51584.14%426,0138.03%306,4155.78%108,3042.04%
25 to 295,232,2544,437,57084.81%389,4297.44%287,4855.49%117,7712.25%
30 to 344,307,6933,535,17382.07%366,9558.52%281,3586.53%124,2062.88%
35 to 393,774,9213,001,98979.52%376,4889.97%279,4397.40%117,0053.10%
40 to 443,204,9522,444,97276.29%368,88611.51%288,3709.00%102,7253.21%
45 to 492,738,5802,004,00973.18%307,36311.22%335,43412.25%91,7743.35%
50 to 542,297,5861,619,24970.48%264,59311.52%332,97714.49%80,7673.52%
55 to 591,942,9421,334,80068.70%209,93310.80%328,99916.93%69,2103.56%
60 to 641,539,9531,039,30167.49%152,6989.92%290,07518.84%57,8793.76%
65 to 691,153,159737,58163.96%105,4039.14%265,81823.05%44,3573.85%
70 to 74805,114511,72363.56%65,4658.13%198,87624.70%28,9493.60%
75 to 79502,005313,80062.51%41,9788.36%128,67525.63%17,5523.50%
80-plus419,100249,43159.52%31,6987.56%124,67229.75%13,2103.15%
All ages54,956,92044,227,9954,832,9164,534,0081,362,002
% of SA80.48%8.79%8.25%2.48%

Racial composition of each age group in 2020 (estimates)

Source: [24]

Age groupAll races% of AllBlack African% of BlacksColoured% of Col'dWhite% of WhitesIndian or other Asian% of Asians
0–1417,050,95528.60%14,605,41630.33%1,408,55326.84%742,91315.87%294,07319.08%
15–6438,941,22165.31%31,368,17465.14%3,487,28466.45%2,988,63463.86%1,097,12971.19%
65-plus3,630,1746.09%2,180,1374.53%351,9036.71%948,22320.26%149,9119.73%
All ages59,622,350100%48,153,727(100%)5,247,740(100%)4,679,770(100%)1,541,113(100%)
% of SA100%80.76%8.80%7.85%2.58%
Age groupAll races% of AllBlack African% of BlacksColoured% of Col'dWhite% of WhitesIndian or Asian% of Asians
under 55,743,4509.63%4,940,75110.26%476,3229.08%226,7154.84%99,6626.47%
5 to 95,715,9529.59%4,890,89510.16%475,5189.06%249,9915.34%99,5486.46%
10 to 145,591,5539.38%4,773,7709.91%456,7138.70%266,2075.69%94,8636.16%
15 to 194,774,5798.01%4,031,7048.37%411,0567.83%243,2675.20%88,5525.75%
20 to 244,823,3678.09%4,043,4328.40%423,1808.06%254,4655.44%102,2906.64%
25 to 295,420,7549.09%4,586,7809.53%435,7468.30%267,6545.72%130,5748.47%
30 to 345,641,7509.46%4,769,4999.90%431,2748.22%296,1606.33%144,8179.40%
35 to 394,798,2938.05%3,962,7808.23%381,8587.28%308,9596.60%144,6969.39%
40 to 443,733,9426.26%2,988,9996.21%316,6116.03%306,4146.55%121,9187.91%
45 to 493,169,6485.32%2,393,3174.97%312,6655.96%352,6487.54%111,0187.20%
50 to 542,571,2634.31%1,834,1913.81%302,2245.76%337,8397.22%97,0096.29%
55 to 592,211,3093.71%1,546,6743.21%264,9675.05%314,4236.72%85,2455.53%
60 to 641,796,3163.01%1,210,7982.51%207,7033.96%306,8056.56%71,0104.61%
65 to 691,408,6652.36%918,6041.91%150,9412.88%281,3186.01%57,8023.75%
70 to 741,007,1741.69%619,1061.29%97,1271.85%248,6735.31%42,2682.74%
75 to 79637,0621.07%365,4090.76%56,8221.08%188,1234.02%26,7081.73%
80-plus577,2730.97%277,0180.58%47,0130.90%230,1094.92%23,1331.50%
All ages59,622,350100%48,153,727(100%)5,247,740(100%)4,679,770(100%)1,541,113(100%)
% of SA100%80.76%8.80%7.85%2.58%
Age groupAll racesBlack African% of age grpColoured% of age grpWhite% of age grpIndian or Asian% of age grp
under 55,743,4504,940,75186.02%476,3228.29%226,7153.95%99,6621.74%
5 to 95,715,9524,890,89585.57%475,5188.32%249,9914.37%99,5481.74%
10 to 145,591,5534,773,77085.37%456,7138.17%266,2074.76%94,8631.70%
15 to 194,774,5794,031,70484.44%411,0568.61%243,2675.10%88,5521.85%
20 to 244,823,3674,043,43283.83%423,1808.77%254,4655.28%102,2902.12%
25 to 295,420,7544,586,78084.62%435,7468.04%267,6544.94%130,5742.41%
30 to 345,641,7504,769,49984.54%431,2747.64%296,1605.25%144,8172.57%
35 to 394,798,2933,962,78082.59%381,8587.96%308,9596.44%144,6963.02%
40 to 443,733,9422,988,99980.05%316,6118.48%306,4148.21%121,9183.27%
45 to 493,169,6482,393,31775.51%312,6659.86%352,64811.13%111,0183.50%
50 to 542,571,2631,834,19171.33%302,22411.75%337,83913.14%97,0093.77%
55 to 592,211,3091,546,67469.94%264,96711.98%314,42314.22%85,2453.85%
60 to 641,796,3161,210,79867.40%207,70311.56%306,80517.08%71,0103.95%
65 to 691,408,665918,60465.21%150,94110.72%281,31819.97%57,8024.10%
70 to 741,007,174619,10661.47%97,1279.64%248,67324.69%42,2684.20%
75 to 79637,062365,40957.36%56,8228.92%188,12329.53%26,7084.19%
80-plus577,273277,01847.99%47,0138.14%230,10939.86%23,1334.01%
All ages59,622,35048,153,7275,247,7404,679,7701,541,113
% of SA80.76%8.80%7.85%2.58%

Fertility rate (The Demographic Health Survey)

Fertility rate (TFR) (Wanted Fertility Rate) and CBR (Crude Birth Rate): [25]

YearCBR (Total)TFR (Total)CBR (Urban)TFR (Urban)CBR (Rural)TFR (Rural)
199821.902.90 (2.3)19.22.25 (1.8)25.43.92 (2.9)
201622.32.6 (2.0)21.92.4 (1.9)23.13.1 (2.4)

Fertility rate (TFR) (Wanted Fertility Rate) by ethnic group.

YearTotalBlack AfricanWhiteColouredIndian/Asian
19982.9 (2.3)3.1 (2.4)1.9 (1.5)2.5 (2.1)
20162.6 (2.0)2.7 (2.1)1.5 (1.2)2.5 (1.9)1.7 (1.6)

Life expectancy

Life expectancy at birth from 1950 to 2020 (UN World Population Prospects): [26]

Life expectancy in South Africa Life expectancy by WBG -South Africa -diff.png
Life expectancy in South Africa
  Life expectancy in South Africa 1950–2020 (per 5 yr clusters)
PeriodLife expectancy
(years)
1950–195548.5
1955–1960Increase2.svg 51.3
1960–1965Increase2.svg 53.0
1965–1970Increase2.svg 54.8
1970–1975Increase2.svg 56.7
1975–1980Increase2.svg 57.3
1980–1985Increase2.svg 58.4
1985–1990Increase2.svg 61.0
1990–1995Increase2.svg 62.3
1995–2000Decrease2.svg 59.2
2000–2005Decrease2.svg 53.8
2005–2010Decrease2.svg 53.1
2010–2015Increase2.svg 59.5
2015–2020Increase2.svg 63.7
  Life expectancy in South Africa 1950–2021 (per 5 yr clusters)
[27]

Ethnic groups

Dominant population groups in South Africa.
African
Coloured
Indian or other Asian
White
None dominant
Little or no population South Africa 2011 dominant population group map (hex cells).svg
Dominant population groups in South Africa.
  African
  Coloured
  Indian or other Asian
  White
  None dominant
  Little or no population

Ethnic groups South Africa (1911)

   Black African (67%)
   White (21%)
   Coloured (9%)
   Asian (3%)

Ethnic groups South Africa (2021)

   Black African (80.9%)
   White (7.8%)
   Coloured (8.8%)
   Asian (2.6%)

Statistics South Africa asks people to describe themselves in the census in terms of five racial population groups. [28] The 2011 census figures for these groups were Black African at 80.2%, White at 8.4%, Coloured at 8.8%, Indian/Asian at 2.5%, and Other/Unspecified at 0.5%. [29]

The white percentage of the population has sharply declined. The first census in South Africa in 1911 showed that whites made up 22% of the population. This declined to 16% in 1980, [30] 8.9% in 2011 and 7.65% in 2022. [31] :21 Coloured South Africans replaced Whites as the largest minority group around 2010.

Languages

South Africa has twelve official languages: [32] isiZulu [29] 22.7%, isiXhosa [29] 16%, Afrikaans [29] 13.5%, English [29] 9.6%, Sepedi [29] 9.1%, Setswana [29] 8%, Sesotho [29] 7.6%, Xitsonga [29] 4.5%, siSwati [29] 2.5%, Tshivenda [29] 2.4%, isiNdebele [29] 2.1% and South African Sign Language. [33]

In this regard, it is third only to Bolivia and India in number. While all the languages are formally equal, some languages are spoken more than others. According to the 2022 census, the three most spoken languages in the household are Zulu (24.4%), Xhosa (16.3%), and Afrikaans (10.6%). [1]

The country also recognises several unofficial languages, including Sekholokoe, Fanagalo, Khwe, Lobedu, Nama, Northern Ndebele, Phuthi, San and South African Sign Language. [34] These unofficial languages may be used in certain official uses in limited areas where it has been determined that these languages are prevalent. Nevertheless, their populations are not such that they require nationwide recognition.

Many of the "unofficial languages" of the San and Khoikhoi people contain regional dialects stretching northwards into Namibia and Botswana, and elsewhere. These people, who are a physically distinct population from other Africans, have their own cultural identity based on their hunter-gatherer societies. They have been marginalised to a great extent, and many of their languages are in danger of becoming extinct.

Many white South Africans also speak other European languages, such as Portuguese (also spoken by black Angolans and Mozambicans), German, Serbian and Greek, while some Indians and other Asians in South Africa speak South Asian languages, such as Bhojpuri, Tamil, Hindi, Gujarati, Urdu and Telugu. Although many South Africans are of Huguenot (French) origin, South African French is spoken by fewer than 10,000 individuals country-wide. Congolese French is also spoken in South Africa by migrants.

The primary sign language of deaf South Africans is South African Sign Language. Other sign languages among indigenous peoples are also used.

By ethnicity

In 2011, the first language was Zulu for 28.1% of Black South African residents, Xhosa for 19.8%, Sepedi for 11.2%, Tswana for 9.7%, Sesotho for 9.3%, Tsonga for 5.5%, siSwati for 3.1%, Venda for 2.9%, English for 2.8%, Southern Ndebele for 2.6%, Afrikaans for 1.5%, while 3.4% had another first language. [35]

Among whites, Afrikaans was the first language for 59.1% of the population, compared to 35.0% for English. Other languages accounted for the remaining 5.9%. [35]

Religion

Religion in South Africa (2016) [36]

   Protestantism (71.2%)
   No religion (10.9%)
   Roman Catholicism (6.8%)
  Traditional African religion (4.4%)
   Islam (1.6%)
   Hinduism (1.0%)
   Judaism (0.1%)
  Other religions (2.7%)
  Undetermined (1.4%)

According to the 2022 national census, Christians accounted for 85.3% of the population. [1] This includes[ when? ] Protestant (36.6%), Zionist Christian (11.1%), Pentecostal/Charismatic (8.2%), Roman Catholic (7.1%), Methodist (6.8%), Dutch Reformed (6.7%), Anglican (3.8%); members of other Christian churches accounted for another 36% of the population. Muslims accounted for 1.5% of the population, Other 2.3%, and 1.4% were Unspecified and None 15.1%.[ citation needed ]

Muslims are largely found among the Coloured and Indian ethnic groups. They have been joined by black or white South African converts as well as immigrants from other parts of Africa. [37] South African Muslims claim that their faith is the fastest-growing religion of conversion in the country, with the number of black Muslims growing sixfold, from 12,000 in 1991 to 74,700 in 2004. As of 2023, converts from Islam to Christianity surpass those who convert from Christianity to Islam. [37] [38]

The Hindu population has its roots in the British colonial period, but later waves of immigration from India have also contributed to it. Most Hindus are of South Asian origin, but there are many who come from mixed racial stock. Some are converts due to the efforts of ISKCON.

Other minority religions in South Africa are Sikhism, Jainism, Baháʼí Faith and Judaism. [39]

By ethnicity

87.9% of Black residents are Christian, 9.5% have no religion, 0.2% are Muslim, 0.1% are Jewish, 1.22% are Hindu and 2.3% have other or undetermined beliefs.

71.8% of White residents are Christian, 23.8% have no religion, 0.2% are Muslim, 1.4% are Jewish, and 0.0% are Hindu. 2.7% have other or undetermined beliefs.

Other demographic statistics

Demographics development according to the United Nations South Africa Population 1950-2021 Forecast 2022-2032 UN World Population Prospects 2022.svg
Demographics development according to the United Nations

Demographic statistics according to the World Population Review in 2022. [40]

The following demographics are from the CIA World Factbook [41] unless otherwise indicated.

Population

57,516,665 (2022 est.)
55,380,210 (July 2018 est.)

Age structure

Population pyramid of South Africa in 2020 South Africa single age population pyramid 2020.png
Population pyramid of South Africa in 2020
0-14 years: 27.94% (male 7,894,742/female 7,883,266)
15-24 years: 16.8% (male 4,680,587/female 4,804,337)
25-54 years: 42.37% (male 12,099,441/female 11,825,193)
55-64 years: 6.8% (male 1,782,902/female 2,056,988)
65 years and over: 6.09% (2020 est.) (male 1,443,956/female 1,992,205)
0-14 years: 28.18% (male 7,815,651 /female 7,793,261)
15-24 years: 17.24% (male 4,711,480 /female 4,837,897)
25-54 years: 42.05% (male 11,782,848 /female 11,503,831)
55-64 years: 6.71% (male 1,725,034 /female 1,992,035)
65 years and over: 5.81% (male 1,351,991 /female 1,866,182) (2018 est.)

Birth rate

18.56 births/1,000 population (2022 est.) Country comparison to the world: 77th
19.9 births/1,000 population (2018 est.) Country comparison to the world: 78th

Death rate

9.26 deaths/1,000 population (2022 est.) Country comparison to the world: 52nd
9.3 deaths/1,000 population (2018 est.) Country comparison to the world: 57th

Total fertility rate

2.18 children born/woman (2022 est.) Country comparison to the world: 90th
2.26 children born/woman (2018 est.) Country comparison to the world: 91st

Population growth rate

0.93% (2022 est.) Country comparison to the world: 103rd
0.97% (2018 est.) Country comparison to the world: 114th

Median age

Total: 28 years. Country comparison to the world: 142nd
Male: 27.9 years
Female: 28.1 years (2020 est.)
Total: 27.4 years. Country comparison to the world: 144th
Male: 27.2 years
Female: 27.6 years (2018 est.)

Contraceptive prevalence rate

54.6% (2016)

Net migration rate

0 migrant(s)/1,000 population (2022 est.) Country comparison to the world: 98th
-0.9 migrant(s)/1,000 population (2018 est.) Country comparison to the world: 138th

Dependency ratios

Total dependency ratio: 52.5 (2015 est.)
Youth dependency ratio: 44.8 (2015 est.)
Elderly dependency ratio: 7.7 (2015 est.)
Potential support ratio: 12.9 (2015 est.)

Urbanization

Urban population: 68.3% of total population (2022)
Rate of urbanization: 1.72% annual rate of change (2020-25 est.)
Urban population: 66.4% of total population (2018)
Rate of urbanization: 1.97% annual rate of change (2015-20 est.)

Life expectancy at birth

Total population: 65.32 years. Country comparison to the world: 202nd
Male: 63.99 years
Female: 66.68 years (2022 est.)
Total population: 64.1 years (2018 est.)

Major infectious diseases

Degree of risk: intermediate (2020)
Food or waterborne diseases: bacterial diarrhea, hepatitis A, and typhoid fever
Water contact diseases: schistosomiasis

note: widespread ongoing transmission of a respiratory illness caused by the novel coronavirus (COVID-19) is occurring throughout South Africa; as of 6 June 2022, South Africa has reported a total of 3,968,205 cases of COVID-19 or 6,690.7 cumulative cases of COVID-19 per 100,000 population with a total of 101,317 cumulative deaths or a rate of 170.83 cumulative deaths per 100,000 population; as of 6 June 2022, 36.33% of the population has received at least one dose of COVID-19 vaccine

Ethnic groups

Black African 80.9%, Colored 8.8%, White 7.8%, Indian/Asian 2.6% (2021 est.)
note: Colored is a term used in South Africa, including on the national census, for persons of mixed race ancestry who developed a distinct cultural identity over several hundred years

Languages

Map showing the dominant languages in South Africa SAPS language.png
Map showing the dominant languages in South Africa
isiZulu (official) 24.7%, isiXhosa (official) 15.6%, Afrikaans (official) 12.1%, Sepedi (official) 9.8%, Setswana (official) 8.9%, English (official) 8.4%, Sesotho (official) 8%, Xitsonga (official) 4%, siSwati (official) 2.6%, Tshivenda (official) 2.5%, Khoi, Nama, and San languages 1.9% isiNdebele (official) 1.6% (2017 est.)
note: data represent language spoken most often at home

Education expenditures

6.8% of GDP (2020) Country comparison to the world: 22nd
6.1% of GDP (2017) Country comparison to the world: 34th

Literacy

Definition: age 15 and over can read and write (2015 est.)

Total population: 95%
Male: 95.5%
Female: 94.5% (2019)
Total population: 94.4%
Male: 95.4%
Female: 95.4% (2015 est.)

School life expectancy (primary to tertiary education)

Total: 14 years
Male: 13 years
Female: 14 years (2019)

Unemployment, youth ages 15-24

Total: 59.4%
Male: 55.4%
Female: 64.1% (2020 est.)

Immigration

COB data South Africa.PNG

South Africa hosts a sizeable refugee and asylum seeker population. According to the World Refugee Survey 2008, published by the U.S. Committee for Refugees and Immigrants, this population numbered approximately 144,700 in 2007. [42] Groups of refugees and asylum seekers numbering over 10,000 included people from Zimbabwe (48,400), the Democratic Republic of the Congo (24,800), and Somalia (12,900). [42] These populations mainly lived in Johannesburg, Pretoria, Durban, Cape Town, and Port Elizabeth. [42] Many refugees have now also started to work and live in rural areas in provinces such as Mpumalanga and KwaZulu-Natal.

Statistics SA assumes in some of their calculations that there are fewer than 2 million immigrants in South Africa. [43] Other institutions, like the police and Médecins Sans Frontières place estimate the figure at 4 million. [44] [45] [46] [47]

Immigration figures

Main countries of immigration in South Africa according to the 2011 Census and 2022 Census:

Source: 2022 South African census (2023) [48]
Place of birthPopulation, 2011Population, 2022Difference
Flag of Zimbabwe.svg  Zimbabwe 672,3081,012,059339,751 Increase2.svg
Flag of Mozambique.svg  Mozambique 393,231416,56423,333 Increase2.svg
Flag of Lesotho.svg  Lesotho 160,806227,77066,964 Increase2.svg
Flag of Malawi.svg  Malawi 86,606198,807112,201 Increase2.svg
Flag of the United Kingdom.svg  United Kingdom 81,72061,282-20,438 Decrease2.svg
Flag of Ethiopia.svg  Ethiopia 28,23058,13129,901 Increase2.svg
Flag of Namibia.svg  Namibia 40,57536,140-4,435 Decrease2.svg
Flag of India.svg  India 31,16527,350-3,815 Decrease2.svg
Flag of Nigeria.svg  Nigeria 26,34124,718-1,623 Decrease2.svg
Flag of Zambia.svg  Zambia 30,05424,625-5,429 Decrease2.svg
Flag of the Republic of the Congo.svg  Congo 26,06123,328-2,733 Decrease2.svg
Flag of Bangladesh.svg  Bangladesh 19,69620,8941,198 Increase2.svg
Flag of the Democratic Republic of the Congo.svg  DRC 25,63017,635-7,995 Decrease2.svg
Flag of Somalia.svg  Somalia 26,11615,838-10,278 Decrease2.svg
Flag of Pakistan.svg  Pakistan 17,24115,006-2,235 Decrease2.svg
Flag of Germany.svg  Germany 20,49412,139-8,355 Decrease2.svg
Flag of Botswana.svg  Botswana 12,3168,976-3,340 Decrease2.svg
Flag of Portugal.svg  Portugal 15,6267,615-8,011 Decrease2.svg

Immigration assumptions by Statistics South Africa to South Africa based on race. Negative numbers represent net migration from South Africa to other countries. [49]

Immigration to SA by Race
(Negative values indicate net migration from SA elsewhere)
YearAfricanAsianWhite
1985-2000632 63336 908-202 868
2001-2006565 91625 310-99 574
2006-2011815 78043 222-106 787
2011-2016972 99554 697-111 346
2016-2021894 36549 584-90 956

Urbanization

"Urban areas contain about two-thirds of the population; many of these consist of huge informal or squatter settlements." [50]

Graphs and maps

See also

Related Research Articles

<span class="mw-page-title-main">Demographics of Chad</span>

The people of Chad speak more than 100 languages and divide themselves into many ethnic groups. However, language and ethnicity are not the same. Moreover, neither element can be tied to a particular physical type.

<span class="mw-page-title-main">Demographics of Cameroon</span>

The demographic profile of Cameroon is complex for a country of its population. Cameroon comprises an estimated 250 distinct ethnic groups, which may be formed into five large regional-cultural divisions:

<span class="mw-page-title-main">Demographics of Cape Verde</span>

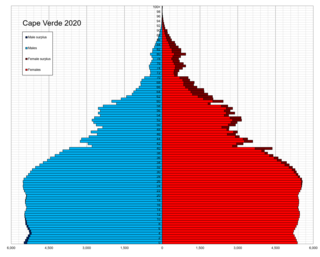
Demographic features of the population of Cape Verde include population density, ethnicity, education level, health of the populace, economic status, religious affiliations and other aspects of the population.

<span class="mw-page-title-main">Demographics of Ivory Coast</span>

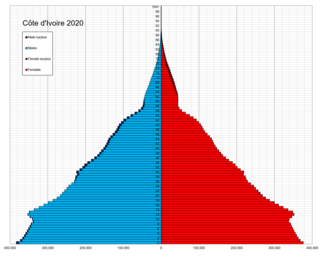
Demographic features of the population of Ivory Coast include population density, ethnicity, education level, health of the populace, economic status, religious affiliations and other aspects of the population.

<span class="mw-page-title-main">Demographics of Ethiopia</span>

The demographics of Ethiopia encompass the demographic features of inhabitants in Ethiopia, including ethnicity, languages, population density, education level, health, economic status, religious affiliations and other aspects of the population.

<span class="mw-page-title-main">Demographics of Ghana</span>

Demographic features of the population of Ghana include population density, ethnicity, education level, health of the populace, religious affiliations, and other aspects.

<span class="mw-page-title-main">Demographics of Kenya</span> Demographics of a country

The demography of Kenya is monitored by the Kenyan National Bureau of Statistics. Kenya is a multi-ethnic state in East Africa. Its total population was at 47,558,296 as of the 2019 census.

<span class="mw-page-title-main">Demographics of Lesotho</span>

Demographic features of the population of Lesotho include population density, ethnicity, education level, health of the populace, economic status, religious affiliations and other aspects.

<span class="mw-page-title-main">Demographics of Mauritius</span>

Mauritian society includes people from many different ethnic groups as well as a significant population of mixed-race people who have ancestry from more than one ethnic group. A majority of the republic's residents are the descendants of people from India. Mauritius also contains substantial populations from continental Africa, China, France, and the East African island nation of Madagascar. Mauritius had a population of 1,235,260 according to the final results of the 2022 Census. The population on the island of Mauritius was 1,191,280, and that of Rodrigues island was 43,650 ; Agalega island total population of 330. Mauritius has the second highest population density in Africa. According to the 2022 census, the average age of the population was 38 years. 2022 Census indicated that: The proportion of children aged below 15 years went down from 20.7% in 2011 to 15.4% in 2022; The share of persons aged 60 years and over has risen from 12.7% in 2011 to 18.7% in 2022.

<span class="mw-page-title-main">Demographics of Namibia</span>

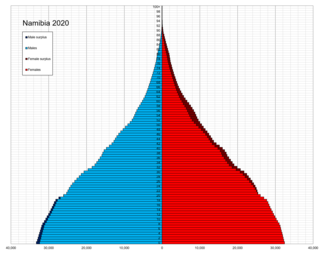
This is a demography of the population of Namibia including population density, ethnicity, education level, health of the populace, economic status, religious affiliations and other aspects of the population.

<span class="mw-page-title-main">Demographics of Seychelles</span>

Demographic features of the population of Seychelles include population density, ethnicity, education level, health of the populace, economic status, religious affiliations and other aspects of the population.

<span class="mw-page-title-main">Demographics of Sierra Leone</span>

The demographics of Sierra Leone are made up of an indigenous population from 18 ethnic groups. The Temne in the north and the Mende in the south are the largest. About 60,000 are Krio, the descendants of freed slaves who returned to Sierra Leone from Great Britain, North America and slave ships captured on the high seas. In addition, about 5,000 Lebanese, 1,000 Indians, and 5,000 Europeans reside in the country.

<span class="mw-page-title-main">Demographics of Sudan</span> Demographics of the country

The demographics of Sudan include the Sudanese people and their characteristics, Sudan, including population density, ethnicity, education level, health, economic status, religious affiliations, and other aspects of the population.

<span class="mw-page-title-main">Demographics of Eswatini</span>

Demographic features of the population of Eswatini include population density, ethnicity, education level, health of the populace, economic status, religious affiliations and other aspects of the population.

<span class="mw-page-title-main">Demographics of Tanzania</span>

Demographic features of the population of Tanzania include population density, ethnicity, education level, health of the populace, economic status, religious affiliations, and other aspects of the population.

<span class="mw-page-title-main">Demographics of Togo</span>

The demographics of Togo include ethnicity, population density, age, education level, health, economic status and religious affiliations.

<span class="mw-page-title-main">Demographics of Venezuela</span>

Venezuela is a country in South America. The Venezuelan people comprise a combination of heritages, primarily Native American and European. The historically present Native American, Spanish colonists, and African slaves have all contributed to varying degrees. Later, waves of European groups migrated to Venezuela in the 20th century, influencing many aspects of Venezuelan life, including its culture, language, food, and music though small in number.

<span class="mw-page-title-main">Demographics of Zimbabwe</span>

Demographic features of the population of Zimbabwe include population density, ethnicity, education level, health of the populace, economic status, religious affiliations and other aspects of the population.

<span class="mw-page-title-main">Demographics of Zambia</span>

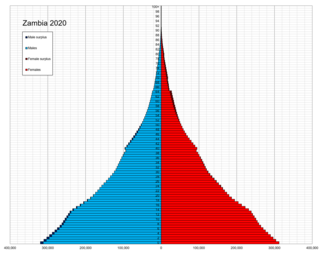
Demographic features of the population of Zambia include population density, ethnicity, education level, health of the populace, economic status, religious affiliations and others aspects of the population.

<span class="mw-page-title-main">Demographics of Uganda</span> Aspect of human geography in Uganda

Demographic features of the population of Uganda include population density, ethnicity, education level, health of the populace, economic status, religious affiliations and others.

References

  1. 1 2 3 4 "Statistics South Africa - Census Dissemination". census.statssa.gov.za. Retrieved 20 October 2023.
  2. 1 2 3 4 5 6 7 8 "Mid-year population estimates 2022" (PDF). stats sa. Retrieved 8 September 2022.
  3. "Census 2021 New Methodologies Test". Statistics South Africa (Stats SA). 20 July 2018. Archived from the original on 4 August 2018.
  4. "Table 3.5, Statistical release (Revised) P0301.4, Census 2011" (PDF). Statssa.gov.za. Archived from the original (PDF) on 13 November 2015. Retrieved 25 July 2016.
  5. "Nowhere left to go". The Economist. 20 May 2008. Retrieved 29 August 2017.
  6. "Escape From Mugabe: Zimbabwe's Exodus". Archived from the original on 24 January 2016.
  7. 1 2 Smuts I: The Sanguine Years 1870–1919, W.K. Hancock, Cambridge University Press, 1962, pg 219
  8. The Statesman's Year-Book, 1967–1968 (104th annual edition), edited by S.H. Steinberg, Macmillan, London; St. Martin's Press, New York, 1967, pages 1405–1424
  9. The Europa Year Book 1969, Volume II: Africa, The Americas, Asia, Australasia, Europa Publications, London, 1969, page 1286
  10. Ogura, Mitsuo (1996). "Urbanization and Apartheid in South Africa: Influx Controls and Their Abolition". The Developing Economies. 34 (4): 402–423. doi: 10.1111/j.1746-1049.1996.tb01178.x . ISSN   1746-1049. PMID   12292280.
  11. Statistics South Africa (1999). "The People of South Africa: Population Census, 1996" (PDF). Retrieved 19 April 2020.
  12. Statistics South Africa (2003). "Statistics South Africa: Census 2001" (PDF). Retrieved 20 April 2020.
  13. Statistics South Africa (2012). "Census 2011: Census in Brief" (PDF). Retrieved 20 April 2020.
  14. Angus Maddison (2010). "Statistics on World Population, GDP and Per Capita GDP, 1-2008 AD". University of Groningen . Retrieved 1 March 2016.
  15. The Statesman's Year-Book 1977–1978 (ed. John Paxton), St. Martin's Press, New York (& Macmillan, London), 1977, page 1296
  16. "City of Cape Town / Isixeko Sasekapa, Stad Kaapstad: Metropolitan Municipality & Main Places – Statistics & Maps on City Population". Citypopulation.de. Archived from the original on 29 August 2017. Retrieved 29 August 2017.
  17. "South Africa: Provinces and Major Urban Areas - Population Statistics in Maps and Charts". Citypopulation.de. Retrieved 29 August 2017.
  18. Population Division of the Department of Economic and Social Affairs of the United Nations Secretariat (2015). "Total Population - Both Sexes (XLS, 3.74 MB) - 2015 revision". United Nations. Archived from the original on 22 December 2015. Retrieved 1 March 2016.
  19. "Mid-year population estimates" (PDF). Statistics South Africa. 23 July 2015. Retrieved 1 March 2016.
  20. 1 2 "World Population Prospects - Population Division - United Nations". population.un.org. Archived from the original on 17 June 2020. Retrieved 6 February 2023.
  21. "World Population Prospects 2019: Data Booklet" (PDF). United Nations Department of Economic and Social Affairs Population Dynamics. Archived from the original (PDF) on 12 February 2020. Retrieved 21 March 2020.
  22. "South Africa Population 2023 (Live)". worldpopulationreview.com. Retrieved 2 April 2023.
  23. "Archived publications for: P0302". www.statssa.gov.za. Retrieved 19 April 2020.
  24. http://www.statssa.gov.za/publications/P0302/P03022020.pdf [ bare URL PDF ]
  25. "The DHS Program - Quality information to plan, monitor and improve population, health, and nutrition programs". Dhsprogram.com. Retrieved 29 August 2017.
  26. "World Population Prospects – Population Division – United Nations". Archived from the original on 19 September 2016. Retrieved 15 July 2017.
  27. "Life Expectancy at Exact Age x (ex) - Both Sexes (XLSX, 172.2 MB)". docs.google.com. Retrieved 2 April 2023. taken from "World Population Prospects - Population Division - United Nations". population.un.org. Retrieved 2 April 2023.
  28. Lehohla, Pali (5 May 2005). "Debate over race and censuses not peculiar to SA". Business Report. Archived from the original on 14 August 2007. Retrieved 25 August 2013. Others pointed out that the repeal of the Population Registration Act in 1991 removed any legal basis for specifying 'race'. The Identification Act of 1997 makes no mention of race. On the other hand, the Employment Equity Act speaks of 'designated groups' being 'black people, women and people with disabilities'. The Act defines 'black' as referring to 'Africans, coloureds and Indians'. Apartheid and the racial identification which underpinned it explicitly linked race with differential access to resources and power. If the post-apartheid order was committed to remedying this, race would have to be included in surveys and censuses, so that progress in eradicating the consequences of apartheid could be measured and monitored. This was the reasoning that led to a 'self-identifying' question about 'race' or 'population group' in both the 1996 and 2001 population censuses, and in Statistics SA's household survey programme.
  29. 1 2 3 4 5 6 7 8 9 10 11 12 "Africa :: SOUTH AFRICA". CIA The World Factbook. 2 November 2022.
  30. Study Commission on U.S. Policy toward Southern Africa (U.S.) (1981). South Africa: time running out : the report of the Study Commission on U.S. Policy Toward Southern Africa. University of California Press. p. 42. ISBN   0-520-04547-5.
  31. Census 2011: Census in brief (PDF). Pretoria: Statistics South Africa. 2012. ISBN   9780621413885.
  32. "Constitution of South Africa, Chapter 1, Section 6". Fs.gov.za. Archived from the original on 29 July 2009. Retrieved 30 May 2010.
  33. "The NA approves South African Sign Language as the 12th official language" (Press release).
  34. "The languages of South Africa". Media Club South Africa. Brand South Africa. December 2011. Archived from the original on 1 December 2017. Retrieved 24 November 2017.
  35. 1 2 "Community profiles > Census 2011". Statistics South Africa Superweb. Archived from the original on 30 September 2013. Retrieved 21 August 2013.
  36. "South Africa - Community Survey 2016". www.datafirst.uct.ac.za. Retrieved 25 November 2018.
  37. 1 2 "In South Africa, many blacks convert to Islam". Christian Science Monitor. 10 January 2002. Retrieved 29 August 2017.
  38. "Muslims say their faith growing fast in Africa". Religionnewsblog.com. 15 November 2004. Retrieved 7 November 2010.
  39. "South Africa – Section I. Religious Demography". U.S. Department of State. Retrieved 15 July 2006.
  40. "South Africa Population 2022", World Population Review, 2022
  41. "The World FactBook - South Africa", The World Factbook , 2022PD-icon.svg This article incorporates text from this source, which is in the public domain .
  42. 1 2 3 "World Refugee Survey 2008". U.S. Committee for Refugees and Immigrants. 19 June 2008. Archived from the original on 5 October 2007.
  43. "P03022009_6". Statssa.gov.za. Archived from the original on 5 August 2012. Retrieved 5 January 2014.
  44. "So where are Zimbabweans going?". 8 November 2005. Retrieved 6 February 2023.
  45. Slabbert, Antoinette (1 June 2009). "SA het baie meer mense as geraam" [SA population may be much larger than previously thought]. sake24.com. Archived from the original on 15 July 2011. Retrieved 6 February 2023.
  46. "South African Department of Home Affairs". Archived from the original on 18 September 2010. Retrieved 6 February 2016.
  47. South African Police Service 2009 Annual Report Archived 25 July 2013 at the Wayback Machine page 9 indicating the number exceeds 3 million
  48. "STATISTICAL RELEASE; Census 2022" (PDF). Retrieved 10 January 2024.
  49. "Mid-year population estimates 2022" (PDF). Statistics South Africa. 28 July 2022. Retrieved 14 November 2022.
  50. "South Africa: Settlement Patterns". Britannica.com. Retrieved 25 October 2017.

Further reading