Demographics of Winnipeg

Last updated

The demographics of Winnipeg reveal the city to be a typically Canadian one: multicultural and multilingual. Winnipeg is also prominent in the size and ratio of its First Nations population, which plays an important part in the city's makeup. About 12.4% of Winnipeggers are of Indigenous descent, which vastly exceeds the national average of 5.0%. [1]

Contents

Population

As of the Canada 2021 Census there were 749,607 people living in the City of Winnipeg, [2] with 834,678 living in the Winnipeg Census Metropolitan Area. [3] The median age of the population is 39 years old and the average is 40.

City Population
YearPop.±%
1871241    
18817,995+3217.4%
189126,529+231.8%
190142,540+60.4%
1911 136,035+219.8%
1921179,097+31.7%
1931218,785+22.2%
1941221,969+1.5%
1951235,710+6.2%
1961265,420+12.6%
1966257,005−3.2%
1971246,246−4.2%
1976560,874+127.8%
1981564,373+0.6%
1986592,551+5.0%
1991616,790+4.1%
1996 618,477+0.3%
2001 619,544+0.2%
2006 633,451+2.2%
2011 663,617+4.8%
2016 705,244+6.3%
2021 749,607+6.3%
The drastic population increase between 1971 and 1976 was due in part to Winnipeg's amalgamation in 1972. [4] [5] [6] [7] [8] [9]
Metro Area [10]
YearPop.±%
1991660,450    
1996 667,209+1.0%
2001 671,274+0.6%
2006 694,668+3.5%
2011 730,018+5.1%
2016 778,489+6.6%
2021 834,678+7.2%
Sources: [11] [12]

Ethnicity

City of Winnipeg

Ethnic Origins [13] [14]
PopulationPercentage
English137,07520.7
Scottish113,46517.1
Canadian 108,95516.4
German 105,91016.0
Ukrainian 98,86014.9
Irish85,80012.9
French85,02512.8
Filipino 58,2559.0

There is a large Indigenous community in Winnipeg. Per capita, Winnipeg has more Indigenous residents (12.4%) than any other major Canadian city (population 100,000+). [1] [15] Despite being only the seventh-largest city in Canada, Winnipeg has the largest total population of urban and off-reserve Indigenous people in one city (90,995), including the largest total Métis population (47,915), and the largest total First Nations population (40,290). [1] Per capita, Winnipeg is the Canadian city with the fourth-largest First Nations population (5.5%) and the largest Métis population (6.5%). [1]

Winnipeg also has the largest Filipino population (11.3%) of any major Canadian city, though the Toronto Filipino community is larger in absolute numbers (170,355 in Toronto, relative to 83,305 in Winnipeg). [1] Winnipeg's Filipino population is largely concentrated in the West End and North End areas of the city. The neighbourhood around Sargent Avenue and Arlington Street is 45% Filipino, [16] and the neighborhood around Sargent Avenue and Wall Street is 47% Filipino. [17] [18]

Winnipeg also has the largest multiracial population of any large Canadian city.[ citation needed ] There are 45,005 people of mixed race backgrounds in Winnipeg, making that both the highest ratio (6.9%) and in total numbers (Toronto is second with 42,795).[ citation needed ] This figure does not count Winnipegers of Métis background.

Panethnic groups in the City of Winnipeg (1996−2021)
Panethnic
group
2021 [1] 2016 [19] 2011 [20] 2006 [21] 2001 [22] 1996 [23]
Pop. %Pop.%Pop.%Pop.%Pop.%Pop.%
European [lower-alpha 1] 392,035412,645438,470460,045476,120495,485
Southeast Asian [lower-alpha 2] 93,59081,24563,39042,14535,02529,725
Indigenous 90,99584,30572,33563,74552,41543,460
South Asian 62,46037,57022,94015,08012,16511,330
African 40,08526,89017,41014,20011,2759,845
East Asian [lower-alpha 3] 28,09024,39519,06516,45013,39513,560
Middle Eastern [lower-alpha 4] 10,3157,0154,6404,0001,8801,600
Latin American 8,9106,7156,4755,3904,5003,890
Other/Multiracial [lower-alpha 5] 10,1808,6355,2654,6453,6702,735
Total responses736,660690,005649,995625,700610,450611,630
Total population749,607705,244663,617633,451619,544618,477
Note: Totals greater than 100% due to multiple origin responses

Metro Winnipeg

Panethnic groups in Metro Winnipeg (2001−2021)
Panethnic
group
2021 [24] [25] 2016 [26] 2011 [27] 2006 [28] 2001 [29]
Pop. %Pop.%Pop.%Pop.%Pop.%
European [lower-alpha 6] 460,240473,360495,445514,715523,405
Indigenous 102,07592,81078,42068,38555,755
Southeast Asian [lower-alpha 2] 94,70081,87563,74042,27535,125
South Asian 63,80538,10023,17515,29512,290
African 40,92027,37517,84014,47511,440
East Asian [lower-alpha 3] 28,52525,27019,37516,72013,470
Middle Eastern [lower-alpha 4] 10,4807,1104,7054,0201,955
Latin American 9,1606,8256,5605,4754,550
Other/Multiracial [lower-alpha 5] 10,5958,8105,3904,6803,735
Total responses819,715761,540714,635686,040661,725
Total population834,678778,489730,018694,668671,274
Note: Totals greater than 100% due to multiple origin responses
Top 20 Ethnic Origins in the Winnipeg CMA
Ethnic
origin
2021 [3] Ethnic
origin
2011 [30] Ethnic
origin
2006 [31]
Numbers %Numbers %Numbers %
English 124,22515.2 English 153,06021.4 English 156,29022.8
Scottish 114,49514.0 Scottish 126,32017.7 Scottish 126,74018.5
Ukrainian 108,00513.2 Canadian 123,44517.3 German 121,56517.7
German 102,04512.4 German 121,47017.0 Canadian 117,22517.1
Irish 88,93010.8 Ukrainian 115,23016.1 Ukrainian 110,33516.1
Filipino 81,1359.9 French 97,72013.7 French 97,41014.2
French*78,3859.6 Irish 94,82013.3 Irish 95,18513.9
Canadian 60,3207.4 Polish 58,5358.2 Polish 58,0508.5
Polish 54,4506.6 Métis 58,4408.2 Métis 42,1756.1
Métis 52,3706.4 Filipino 46,0706.4 Filipino 38,2755.6
East Indian 34,1954.2 First Nations 40,0105.6 First Nations 36,5155.3
Chinese 26,8453.3 Dutch 29,0604.1 Dutch 30,3104.4
Russian 25,3703.1 Russian 25,4154.1 Russian 23,3853.4
Dutch 25,1853.1 Chinese 20,4102.9 Italian 18,5802.7
First Nations*22,5402.7 East Indian 19,8552.8 Icelandic 17,6552.6
Italian 19,0602.3 Italian 18,4102.6 Chinese 16,6952.4
Mennonite 19,0102.3 Icelandic 18,2102.5 East Indian 13,5452.0
Icelandic 18,3352.2 Swedish 13,9101.9 Swedish 13,4702.0
Swedish 13,4101.6 Norwegian 12,3401.7 Jewish 12,2101.8
Punjabi 12,9651.6 Jewish 11,9951.7 Welsh 11,3501.6
Portuguese 11,7851.4 Portuguese 11,4901.6 Belgian 10,6801.6
Total819,715100Total727,500100Total686,040100
  • Indicates not otherwise specified, for example, French may be French Canadian or from France. Additionally, First Nations are now broken down into ethnicity, i.e. Cree, Ojibway, or in this case they may not have specified.

Future projections

Panethnic origin projections (2041)
2041 [32] [33] [34] [35]
Population%
European [nb 1] 430,500
Southeast Asian [lower-alpha 2] 168,000
Indigenous 145,500
South Asian 138,000
African 98,000
East Asian [lower-alpha 3] 67,000
Middle Eastern [lower-alpha 4] 28,000
Latin American 19,000
Other/multiracial 21,000
Projected Metro Winnipeg Population1,115,000

Language

City of Winnipeg

In 2011, Tagalog was officially the second most common mother tongue in Winnipeg, accounting for about 5% of the population, [36] followed by French which is the mother-tongue for about 4% of the population.

Metro Winnipeg

The question on knowledge of languages allows for multiple responses.

Knowledge of Languages in Metro Winnipeg
Language 2021 [37] 2011 [27] 2001 [38]
Pop. %Pop.%Pop.%
English 805,680711,285655,360
French 83,36576,76574,460
Tagalog 64,72545,74523,560
Punjabi 40,10512,0106,130
Hindi 23,6706,9003,245
Spanish 16,55013,47510,655
German 15,75523,48528,485
Mandarin 15,2403,5901,490
Ukrainian 9,72013,49020,865
Russian 9,6155,4953,100
Arabic 9,4704,4851,900
Portuguese 8,6056,5957,965
Cantonese 8,1654,3653,025
Urdu 6,2402,3151,115
Polish 6,1457,38011,005
Vietnamese 6,0153,8253,900
Yoruba 5,350
Italian 4,8605,4406,740
Gujarati 4,2801,310485
Tigrigna 4,1001,010
Korean 3,9002,660885
Hebrew 3,6902,5751,625
Amharic 3,3701,605
Ojibway 3,2652,2603,535
Ilocano 3,0151,165
Swahili 2,7751,200550
Bengali 2,660630275
Serbo-Croatian 2,6302,0853,535
Plautdietsch 2,190
Cree 1,8051,5552,850
Pampangan
(Kapampangan,
Pampango)
1,635
Somali 1,590735
Dutch 1,5651,9352,980
Iranian
Persian
1,525
Greek 1,5001,4351,655
Igbo 1,400
Cebuano 1,365
Japanese 1,310860975
Kurdish 1,170265365
Lao 1,1659601,285
Sinhala 1,160535425
Malayalam 1,09531090
Hungarian 1,0351,1401,680
Chinese, n.o.s6,4305,650
Persian 1,950810
Total
Responses
819,715714,635661,725
Total
Population
834,678730,018671,274

Religion

City of Winnipeg

In 2001, 21% of Winnipeg was not religious. [39] Ten years later, in 2011, 28.7% of the population was not religious (about 32% of males and 26% of females). [40] The trend continued into 2021, when 36.4% of residents reported no religion or secular perspectives. The largest religion was Christianity, at 50.4% of residents (63.7% in 2011). 24.0% were Catholic, 12.9% were Protestant, 8.9% were Christians of unspecified denomination, 1.7% were Orthodox Christians, and 3.0% were Other Christian (/Other Christian Related Traditions.) After Christianity, the next largest religion in Winnipeg was Sikhism, which grew from 1.5% to 4.4% of the population between 2011 and 2021. Muslims were 3.3% of the population (1.7% in 2011), Hindus were 2.0% (1.1% in 2011) , Jewish People were 1.5% (1.6% in 2011), Buddhists were 0.9% (1.0% in 2011) Adherents of Traditional (North American Indigenous) spirituality were 0.4% (0.3% in 2011) and Other Religions/Spiritual Traditions were 0.7% (0.4% in 2011.)

Religions in Winnipeg, 2021 [41]
ReligionNumbers%
Christian 371,345
Sikh 32,510
Muslim 24,170
Jewish 10,835
Hindu 14,745
Buddhist 6,860
Other religions5,440
Traditional (Aboriginal) Spirituality2,805
No religious affiliation267,945
Total Population736,660100%

Metro Winnipeg

Religious groups in Metro Winnipeg (1981−2021)
Religious group 2021 [42] 2011 [43] 2001 [44] 1991 [45] [46] 1981 [47] [48]
Pop. %Pop.%Pop.%Pop.%Pop.%
Christianity Christian cross.svg 419,660460,755487,175511,070502,390
Irreligion 300,190203,985139,535104,50553,685
Sikhism Khanda.svg 33,4359,8855,3203,2901,570
Islam Star and Crescent.svg 24,56511,2654,8053,2351,635
Hinduism Om.svg 14,9256,8403,6053,1051,440
Judaism Star of David.svg 11,16510,74012,76013,33015,350
Buddhism Dharma Wheel (2).svg 7,0106,3155,3655,0751,730
Indigenous spirituality 3,0101,850
Other 5,7553,0103,1701,990580
Total responses819,715714,640661,725645,610578,625
Total population834,678730,018671,274652,354584,842

Immigration

City of Winnipeg

According to the 2011 National Household Survey, [14] in the 10 year period 2001 to 2011, Winnipeg had 62,200 immigrants, which is just under 10% of the population (9.6%). Most of these (44,780) came in the last 5 years of that period.

Immigrants to Winnipeg by country of birth
(2006 to 2011) [14]
RankCountryNumbers%
1 Philippines 21,36047.7%
2 India 5,62512.6%
3 China 2,4205.4%
4 South Korea 1,0652.4%
5 Nigeria 8651.9%
6 Ukraine 7351.6%
7 United States of America 6001.3%
8 Ethiopia 5801.3%
9 Pakistan 5601.3%
10 Israel 5051.1%

Metro Winnipeg

The 2021 census reported that immigrants (individuals born outside Canada) comprise 207,950 persons or 25.4 percent of the total population of Metro Winnipeg. [49] While this represents a numerical increase, it is a significant proportional decline compared with one century prior, when the 1921 census reported that immigrants (individuals born outside Canada) comprised 85,233 persons or 47.6 percent of the total population of Winnipeg. [50] :366–367 [lower-alpha 7]

Immigrants in Metro Winnipeg by country of birth
Country of Birth2021 [49] [51] 2016 [52] [53] 2011 [54] [55] 2006 [56] [57] 2001 [58] [59] 1996 [60] [59] 1941 [61] :350–3511921 [50] :366–367 [lower-alpha 7]
Pop. %Pop.%Pop.%Pop.%Pop.%Pop.%Pop.%Pop.%
Flag of the Philippines.svg  Philippines 62,48557,16043,39024,96520,10517,845
Flag of India.svg  India 28,24519,63511,3106,2054,9154,455134130
Flag of the People's Republic of China.svg  China 8,9757,6056,0104,0603,4703,190676788
Flag of Nigeria.svg  Nigeria 7,5403,5251,325320285165
Flag of the United Kingdom.svg  United Kingdom 7,1857,5509,17010,38510,66513,20545,54644,186
Flag of Vietnam.svg  Vietnam 4,4004,1053,3753,3503,2953,065
Flag of the United States.svg  United States of America 4,3454,4704,5604,5904,3905,0556,7607,052
Flag of Ukraine.svg  Ukraine 4,2953,8203,3603,7653,5103,6604,623 [lower-alpha 8]
Flag of Poland.svg  Poland 3,9554,6805,1056,6007,4659,12513,3662,776
Flag of Pakistan.svg  Pakistan 3,7752,8451,4251,135570365
Flag of Germany.svg  Germany 3,7504,7955,1155,5505,9856,4805,045 [lower-alpha 9] 3,861 [lower-alpha 9]
Flag of Portugal.svg  Portugal 3,7454,0603,8654,3954,9405,430
Flag of South Korea.svg  South Korea 2,6802,5801,9601,370495580
Flag of Eritrea.svg  Eritrea 2,6101,320655285250315
Flag of Ethiopia.svg  Ethiopia 2,4552,2301,4901,440745620
Flag of Italy.svg  Italy 2,3402,6002,9603,3003,4903,655662689
Flag of Russia.svg  Russia 2,1352,1651,7851,6701,3551,72510,712 [lower-alpha 10] 8,701
Flag of Jamaica.svg  Jamaica 1,8401,6051,3001,3651,5501,50572 [lower-alpha 11] 100 [lower-alpha 11]
Flag of Syria.svg  Syria 1,690695185120602070 [lower-alpha 12] 69 [lower-alpha 12]
Flag of Brazil.svg  Brazil 1,59540533034522525054 [lower-alpha 13]
Total immigrants207,950181,965147,295121,255109,385111,69098,55185,233
Total responses819,715761,540714,640686,040661,730660,055290,540179,097
Total population834,678783,099730,018694,668676,594667,093290,540179,097

Income

The 2011 National Household Survey data showed that Winnipeg's after-tax median household income was $50,537. [62] This was slightly lower than the national average ($54,098), [63] and is in the bottom 10 of lowest median incomes in Canada. [64] A study in 2013 showed that Winnipeg had two of the three poorest postal code areas in all of Canada (R3A and R3B, both located in the inner city) in regards to family income; in fact these are the two poorest that are located in cities (the poorest was a First Nations reserve in the Cape Breton area). [65]

8,610 of Winnipeg's residents (who earn income) make and keep over $100,000 a year, which is 1.7% of the population. This ratio is higher nationally, at 2.6%.

The gender differences in income were less in Winnipeg by about 9% compared to the national medians. The median income for males in Winnipeg is $31,300, whereas for females the median is $23,739. This means a typical male makes about 31.9% more money than a typical female. This ratio is 40.5% nationwide.

Education

According to the 2011 National Household survey, [62] for those aged 25 to 64;

Notes

  1. Statistic includes all persons that did not make up part of a visible minority or an indigenous identity.
  2. 1 2 3 Statistic includes total responses of "Filipino" and "Southeast Asian" under visible minority section on census.
  3. 1 2 3 Statistic includes total responses of "Chinese", "Korean", and "Japanese" under visible minority section on census.
  4. 1 2 3 Statistic includes total responses of "West Asian" and "Arab" under visible minority section on census.
  5. 1 2 Statistic includes total responses of "Visible minority, n.i.e." and "Multiple visible minorities" under visible minority section on census.
  6. 2001-2016: Statistic includes all persons that did not make up part of a visible minority or an indigenous identity.

    2021: Statistic includes all persons belonging to the non-indigenous and non-visible minority “White” population group.
  7. 1 2 Data from the 1921 census details the City of Winnipeg, as no metropolitan area with suburbs existed at the time.
  8. Including Galicia
  9. 1 2 Including Austria
  10. All individuals born in the Soviet Union
  11. 1 2 All individuals born in the British West Indies
  12. 1 2 Including Lebanon
  13. All individuals born in South America

Related Research Articles

<span class="mw-page-title-main">Ethnic origins of people in Canada</span>

According to the 2021 Canadian census, over 450 "ethnic or cultural origins" were self-reported by Canadians. The major panethnic origin groups in Canada are: European (52.5%), North American (22.9%), Asian (19.3%), North American Indigenous (6.1%), African (3.8%), Latin, Central and South American (2.5%), Caribbean (2.1%), Oceanian (0.3%), and Other (6%). Statistics Canada reports that 35.5% of the population reported multiple ethnic origins, thus the overall total is greater than 100%.

Swedish Canadians are Canadian citizens of Swedish ancestry or Swedes who emigrated to and reside in Canada. The Swedish Canadian community in Canada numbered 349,640 in the 2016 population census. The vast majority of them reside west of Lake Superior, primarily in Winnipeg, Calgary, Edmonton and Vancouver. Toronto is the most popular settlement spot for newcomers. Despite having an influential presence and distinctive cultural bond, only 14,000 Canadian persons of Swedish descent speak Swedish.

The demographics of Toronto, Ontario, Canada make Toronto one of the most multicultural and multiracial cities in the world. In 2021, 57.0 percent of the residents of the metropolitan area belonged to a visible minority group, compared with 51.4 percent in 2016, and 13.6 percent in 1981. Toronto also has established ethnic neighbourhoods such as the multiple Chinatowns, Corso Italia, Little Italy, Little India, Greektown, Koreatown, Little Tokyo, Little Jamaica, Little Portugal, Little Malta, Roncesvalles (Polish), Bloor West Village (Ukrainian), which celebrate the city's multiculturalism. Data from the suburban municipalities are also included for some metrics as most of these municipalities are part of the Toronto CMA.

Danish Canadians are Canadian citizens of Danish ancestry. According to the 2006 Census, there were 200,035 Canadians with Danish background, 17,650 of whom were born in Denmark.

The demographics of Metro Vancouver indicate a multicultural and multiracial region. Metro Vancouver is a metropolitan area, with its major urban centre being Vancouver, British Columbia, Canada. The Vancouver census metropolitan area, as defined by Statistics Canada, encompasses roughly the same territory as the Metro Vancouver Regional District, a regional district in British Columbia. The regional district includes 23 local authorities. Figures provided here are for the Vancouver census metropolitan area and not for the City of Vancouver.

<span class="mw-page-title-main">Demographics of British Columbia</span>

British Columbia is a Canadian province with a population of about 5.5 million people. The province represents about 13.2% of the population of the Canadian population. Most of the population is between the ages of 15 and 49. About 60 percent of British Columbians have European descent with significant Asian and Aboriginal minorities and just under 30% of British Columbians are immigrants. Over half of the population is irreligious, with Christianity and Sikhism being the most followed religions.

<span class="mw-page-title-main">Demographics of Ontario</span>

Ontario, one of the 13 provinces and territories of Canada, is located in east-central Canada. It is Canada's most populous province by a large margin, accounting for nearly 40 percent of all Canadians, and is the second-largest province in total area. Ontario is fourth-largest in total area when the territories of the Northwest Territories and Nunavut are included. It is home to the nation's capital city, Ottawa, and the nation's most populous city, Toronto.

<span class="mw-page-title-main">Demographics of Alberta</span>

Alberta has experienced a relatively high rate of growth in recent years, due in large part to its economy. Between 2003 and 2004, the province saw high birthrates, relatively high immigration, and a high rate of interprovincial migration when compared to other provinces. Approximately 81% of the population live in urban areas and only about 19% live in rural areas. The Calgary–Edmonton Corridor is the most urbanized area in Alberta and is one of Canada's four most urban regions. Many of Alberta's cities and towns have also experienced high rates of growth in recent history. From a population of 73,022 in 1901, Alberta has grown to 4,262,635 in 2021 and in the process has gone from less than 1.5% of Canada's population to 11.5%. It is the fourth most populated province in Canada. Between the 2016 and 2021 censuses, the Alberta population grew by 4.8%.
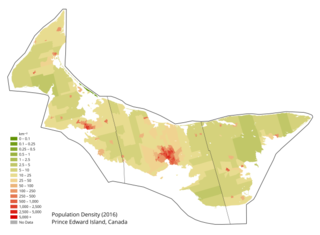
<span class="mw-page-title-main">Demographics of Prince Edward Island</span>

Prince Edward Island is a Canadian province. According to the 2011 National Household Survey, the largest ethnic group consists of people of Scottish descent (39.2%), followed by English (31.1%), Irish (30.4%), French (21.1%), German (5.2%), and Dutch (3.1%) descent. Prince Edward Island is mostly a white community and there are few visible minorities. Chinese people are the largest visible minority group of Prince Edward Island, comprising 1.3% of the province's population. Almost half of respondents identified their ethnicity as "Canadian." Prince Edward Island is by a strong margin the most Celtic and specifically the most Scottish province in Canada and perhaps the most Scottish place (ethnically) in the world, outside Scotland. 38% of islanders claim Scottish ancestry, but this is an underestimate and it is thought that almost 50% of islanders have Scottish roots. When combined with Irish and Welsh, almost 80% of islanders are of some Celtic stock, albeit most families have resided in PEI for at least two centuries. Few places outside Europe can claim such a homogeneous Celtic ethnic background. The only other jurisdiction in North America with such a high percentage of British Isles heritage is Newfoundland.
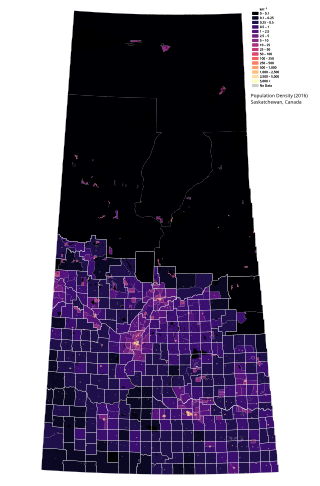
<span class="mw-page-title-main">Demographics of Saskatchewan</span>

Saskatchewan is the middle province of Canada's three Prairie provinces. It has an area of 651,900 km² (251,700 mi²) and a population of 1,132,505 (Saskatchewanians) as of 2021. Saskatchewan's population is made of 50.3% women and 49.7% men. Most of its population lives in the Southern half of the province.

<span class="mw-page-title-main">Demographics of Manitoba</span>

Manitoba is one of Canada's 10 provinces. It is the easternmost of the three Prairie provinces.

<span class="mw-page-title-main">Demographics of Newfoundland and Labrador</span>

Newfoundland and Labrador is a province of Canada on the country's Atlantic coast in northeastern North America. The province has an area of 405,212 square kilometres and a population in 2023 of 533,710, with approximately 95% of the provincial population residing on the Island of Newfoundland, with more than half of the population residing on the Avalon Peninsula. People from Newfoundland and Labrador are called "Newfoundlanders," "Labradorians", or "Newfoundlanders and Labradorians".
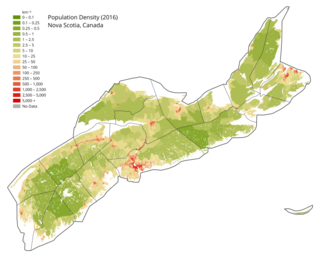
<span class="mw-page-title-main">Demographics of Nova Scotia</span> Demographics of region

Nova Scotia is a Canadian province located on the country's southeastern coast. It is the most populous province in Atlantic Canada, and its capital, Halifax, is a major economic centre of the region. Geographically, Nova Scotia is the second smallest province in Canada, with an area of 52,824.71 km2 (20,395.73 sq mi). As of 2021, it has a population of 969,383 people.

<span class="mw-page-title-main">Demographics of New Brunswick</span>

New Brunswick is one of Canada's three Maritime provinces and the only officially bilingual province in the country. The provincial Department of Finance estimates that the province's population in 2006 was 729,997 of which the majority is English-speaking but with a substantial French-speaking minority of mostly Acadian origin.

The Northwest Territories is a territory of Canada. It has an area of 1,171,918 square kilometres and a population of 41,786 as of the 2016 Canadian census.

Yukon is the westernmost of Canada's three northern territories. Its capital is Whitehorse. People from Yukon are known as Yukoners. Unlike in other Canadian provinces and territories, Statistics Canada uses the entire territory as a single at-large census division.
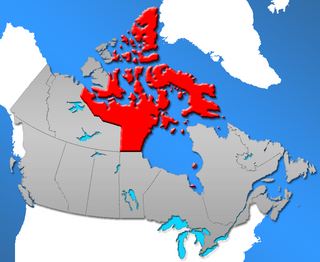
<span class="mw-page-title-main">Demographics of Nunavut</span>

Nunavut is a territory of Canada. It has a land area of 1,877,787.62 km2 (725,017.85 sq mi). It has a population of 36,858 in the 2021 Census. In the 2016 census the population was 35,944, up 12.7% from the 2011 census figure of 31,906. In 2016, 30,135 people identified themselves as Inuit, 190 as North American Indian (0.5%), 165 Métis (0.5%) and 5,025 as non-aboriginal (14.0%).

<span class="mw-page-title-main">Demographics of Calgary</span>

In the 2021 Census, the City of Calgary had a population of 1,306,784 residents, representing 30.7% of the 4,262,635 residents in all of Alberta, and 3.5% compared to a population of 36,991,981 in all of Canada. The total population of the Calgary census metropolitan area (CMA) was 1,481,806. Calgary is the largest city in Alberta, and the third-largest municipality and fifth-largest metropolitan area in Canada, as of 2021.

South African Canadians are Canadians of South African descent. Most South African Canadians are White South Africans, mostly of British and Afrikaner ancestry. According to the 2021 Canada census there were 51,590 South African-born immigrants in Canada. It includes those who hold or have ever held permanent resident status in Canada, including naturalized citizens. 12,270 people considered Afrikaans their mother tongue.

<span class="mw-page-title-main">Canada immigration statistics</span> Historic and contemporary immigration statistics of Canada

Since confederation in 1867 through to the contemporary era, decadal and demi-decadal census reports in Canada have compiled detailed immigration statistics. During this period, the highest annual immigration rate in Canada occurred in 1913, when 400,900 new immigrants accounted for 5.3 percent of the total population, while the greatest number of immigrants admitted to Canada in single year occurred in 2022, with 437,500 persons accounting for 1.1 percent of the total population.

References

  1. 1 2 3 4 5 6 Government of Canada, Statistics Canada (2022-10-26). "Census Profile, 2021 Census of Population". www12.statcan.gc.ca. Retrieved 2023-01-09.
  2. "2021 Census of Population - Winnipeg City Profile". Statistics Canada.
  3. 1 2 "2021 Census of Population - Winnipeg CMA Population". Statistics Canada.
  4. "Canada Year Book (CYB) Historical Collection" (PDF). 2008-03-31. Archived from the original (PDF) on 2014-10-19. Retrieved 2014-08-30., Censuses 1871–1931
  5. "Canada Year Book (CYB) Historical Collection" (PDF). 2008-03-31. Archived from the original (PDF) on 2013-12-09. Retrieved 2014-08-30., Census 1941–1951
  6. "Canada Year Book (CYB) Historical Collection" (PDF). 2008-03-31. Archived from the original (PDF) on 2014-12-23. Retrieved 2014-08-30., Census 1961
  7. "Canada Year Book (CYB) Historical Collection" (PDF). 2008-03-31. Archived from the original (PDF) on 2014-12-23. Retrieved 2014-08-30., Canada Year Book 1974: Censuses 1966, 1971
  8. "Canada Year Book (CYB) Historical Collection" (PDF). 2008-03-31. Archived from the original (PDF) on 2014-12-23. Retrieved 2014-08-30., Canada Year Book 1988: Censuses 1981, 1986
  9. , Census 1991–2006
  10. "Statistics Canada Metro Definitions". Statistics Canada.
  11. "Population and dwelling counts, for census metropolitan areas, 2006 and 2011 censuses – 100% data". Statistics Canada. 5 November 2008. Retrieved 22 February 2017.
  12. "Population and dwelling counts, for census metropolitan areas, 1991 and 1996 censuses – 100% data". Statistics Canada. 1997. Retrieved 22 February 2017.
  13. "Winnipeg City". Ethnocultural Portrait of Canada Highlight Tables, 2006 Census. Statistics Canada. 2008-04-02. Archived from the original on 2012-01-14. Retrieved 28 December 2009.
  14. 1 2 3 Canada, Government of Canada, Statistics (2013-05-08). "2011 National Household Survey Profile - Census subdivision". www12.statcan.gc.ca.{{cite web}}: CS1 maint: multiple names: authors list (link)
  15. Canada, Government of Canada, Statistics (2001-01-15). "Census Program". www12.statcan.gc.ca.{{cite web}}: CS1 maint: multiple names: authors list (link)
  16. Canada, Government of Canada, Statistics (2013-05-08). "2011 National Household Survey Profile - Census tract". www12.statcan.gc.ca.{{cite web}}: CS1 maint: multiple names: authors list (link)
  17. Canada, Government of Canada, Statistics (2013-05-08). "2011 National Household Survey Profile - Census tract". www12.statcan.gc.ca.{{cite web}}: CS1 maint: multiple names: authors list (link)
  18. Petz, Sarah. Filipinos find a home in Winnipeg as family ties drive immigration in Manitoba, National Post , May 29, 2014.
  19. Government of Canada, Statistics Canada (2021-10-27). "Census Profile, 2016 Census". www12.statcan.gc.ca. Retrieved 2023-01-09.
  20. Government of Canada, Statistics Canada (2015-11-27). "NHS Profile". www12.statcan.gc.ca. Retrieved 2023-01-09.
  21. Government of Canada, Statistics Canada (2019-08-20). "2006 Community Profiles". www12.statcan.gc.ca. Retrieved 2023-01-09.
  22. Government of Canada, Statistics Canada (2019-07-02). "2001 Community Profiles". www12.statcan.gc.ca. Retrieved 2023-01-09.
  23. Government of Canada, Statistics Canada (2019-07-02). "Profile of Census Divisions and Subdivisions, 1996 Census". www12.statcan.gc.ca. Retrieved 2023-01-09.
  24. Government of Canada, Statistics Canada (2022-09-21). "Indigenous identity by Registered or Treaty Indian status: Canada, provinces and territories, census metropolitan areas and census agglomerations with parts". www12.statcan.gc.ca. Retrieved 2023-01-09.
  25. Government of Canada, Statistics Canada (2022-10-26). "Visible minority and population group by generation status: Canada, provinces and territories, census metropolitan areas and census agglomerations with parts". www12.statcan.gc.ca. Retrieved 2023-01-09.
  26. Government of Canada, Statistics Canada (2021-10-27). "Census Profile, 2016 Census". www12.statcan.gc.ca. Retrieved 2023-01-09.
  27. 1 2 Government of Canada, Statistics Canada (2015-11-27). "NHS Profile". www12.statcan.gc.ca. Retrieved 2023-01-09.
  28. Government of Canada, Statistics Canada (2019-08-20). "2006 Community Profiles". www12.statcan.gc.ca. Retrieved 2023-01-09.
  29. Government of Canada, Statistics Canada (2019-07-02). "2001 Community Profiles". www12.statcan.gc.ca. Retrieved 2023-01-09.
  30. Canada, Government of Canada, Statistics (2013-05-08). "NHS Profile, Winnipeg, CMA, Manitoba, 2011".{{cite web}}: CS1 maint: multiple names: authors list (link)
  31. Canada, Government of Canada, Statistics (2008-04-02). "Ethnic origins, 2006 counts".{{cite web}}: CS1 maint: multiple names: authors list (link)
  32. Government of Canada, Statistics Canada (8 September 2022). "Canada in 2041: A larger, more diverse population with greater differences between regions". www12.statcan.gc.ca. Retrieved 4 September 2023.
  33. Government of Canada, Statistics Canada (8 September 2022). "Projected population by racialized group, generation status and other selected characteristics (x 1,000)". www12.statcan.gc.ca. Retrieved 4 September 2023.
  34. Government of Canada, Statistics Canada (6 October 2021). "Projections of the Indigenous populations and households in Canada, 2016 to 2041". www12.statcan.gc.ca. Retrieved 4 September 2023.
  35. Government of Canada, Statistics Canada (6 October 2021). "Projected population by Indigenous identity, age group, sex, area of residence, provinces and territories, and projection scenario, Canada (x 1,000)". www12.statcan.gc.ca. Retrieved 4 September 2023.
  36. "Tagalog is 2nd-most common mother tongue in Winnipeg - CBC News". cbc.ca.
  37. Government of Canada, Statistics Canada (2022-08-17). "Knowledge of languages by age and gender: Canada, provinces and territories, census metropolitan areas and census agglomerations with parts". www12.statcan.gc.ca. Retrieved 2022-10-04.
  38. Government of Canada, Statistics Canada (2013-12-23). "Various Non-official Languages Spoken (76), Age Groups (13) and Sex (3) for Population, for Canada, Provinces, Territories, Census Metropolitan Areas and Census Agglomerations, 2001 Census - 20% Sample Data". www12.statcan.gc.ca. Retrieved 2023-05-27.
  39. , Winnipeg Census Profiles
  40. , Religion Section of NHS (Winnipeg)
  41. "Census Profile, 2021 Census of Population-Winnipeg". Statistics Canada.
  42. Government of Canada, Statistics Canada (2022-10-26). "Census Profile, 2021 Census of Population". www12.statcan.gc.ca. Retrieved 2023-06-02.
  43. Government of Canada, Statistics Canada (2015-11-27). "NHS Profile". www12.statcan.gc.ca. Retrieved 2023-06-02.
  44. Government of Canada, Statistics Canada (2019-07-02). "2001 Community Profiles". www12.statcan.gc.ca. Retrieved 2023-06-02.
  45. Government of Canada, Statistics Canada (2019-03-29). "Profile of Census Metropolitan Areas and Census Agglomerations - Part A". www12.statcan.gc.ca. Retrieved 2023-06-02.
  46. Government of Canada, Statistics Canada (2019-03-29). "Profile of Census Metropolitan Areas and Census Agglomerations - Part B". www12.statcan.gc.ca. Retrieved 2023-06-02.
  47. Government of Canada, Statistics Canada (2013-04-03). "1981 Census of Canada : volume 2 - provincial series : population; language, ethnic origin, religion, place of birth, schooling". www12.statcan.gc.ca. Retrieved 2023-06-02.
  48. Government of Canada, Statistics Canada (2020-05-26). "Data tables, 1981 Census Profile for Census Metropolitan Areas and Census Agglomerations, 1981 Census - Part B". www12.statcan.gc.ca. Retrieved 2023-06-02.
  49. 1 2 Government of Canada, Statistics Canada (2023-06-21). "Place of birth and period of immigration by gender and age: Province or territory". www12.statcan.gc.ca. Retrieved 2023-11-04.
  50. 1 2 Government of Canada, Statistics Canada (2013-04-03). "Sixth census of Canada,1921 . v. 2. Population: age, conjugal condition, birthplace, immigration, citizenship, language, educational status, school attendance, blindness and deaf mutism". www12.statcan.gc.ca. Retrieved 2023-11-26.
  51. Government of Canada, Statistics Canada (2023-06-21). "Place of birth and period of immigration by gender and age: Census metropolitan areas and census agglomerations". www12.statcan.gc.ca. Retrieved 2023-11-11.
  52. Government of Canada, Statistics Canada (2019-06-17). "Data tables, 2016 Census Immigrant Status and Period of Immigration (11), Place of Birth (272), Age (7A) and Sex (3) for the Population in Private Households of Canada, Provinces and Territories, Census Divisions and Census Subdivisions, 2016 Census - 25% Sample Data". www12.statcan.gc.ca. Retrieved 2023-11-04.
  53. Government of Canada, Statistics Canada (2019-06-17). "Data tables, 2016 Census Citizenship (5), Place of Birth (272), Immigrant Status and Period of Immigration (11), Age (12) and Sex (3) for the Population in Private Households of Canada, Provinces and Territories, Census Metropolitan Areas and Census Agglomerations, 2016 Census - 25% Sample Data". www12.statcan.gc.ca. Retrieved 2023-11-11.
  54. Government of Canada, Statistics Canada (2019-01-23). "2011 National Household Survey: Data tables Profile - Immigration and Ethnocultural Diversity, and Aboriginal Peoples for Canada, Provinces, Territories, Census Divisions and Census Subdivisions, National Household Survey, 2011". www12.statcan.gc.ca. Retrieved 2023-11-04.
  55. Government of Canada, Statistics Canada (2019-01-23). "2011 National Household Survey: Data tables Citizenship (5), Place of Birth (236), Immigrant Status and Period of Immigration (11), Age Groups (10) and Sex (3) for the Population in Private Households of Canada, Provinces, Territories, Census Metropolitan Areas and Census Agglomerations, 2011 National Household Survey". www12.statcan.gc.ca. Retrieved 2023-11-11.
  56. Government of Canada, Statistics Canada (2009-03-23). "Place of birth for the immigrant population by period of immigration, 2006 counts and percentage distribution, for Canada, provinces and territories - 20% sample data". www12.statcan.gc.ca. Retrieved 2023-11-04.
  57. Government of Canada, Statistics Canada (2020-05-01). "2006 Census Topic-based tabulations Immigrant Status and Period of Immigration (8) and Place of Birth (261) for the Immigrants and Non-permanent Residents of Canada, Provinces, Territories, Census Metropolitan Areas and Census Agglomerations, 2006 Census - 20% Sample Data". www12.statcan.gc.ca. Retrieved 2023-11-04.
  58. Government of Canada, Statistics Canada (2013-12-23). "2001 Census Topic-based tabulations Immigrant Status and Period of Immigration (10A) and Place of Birth of Respondent (260) for Immigrants and Non-permanent Residents, for Canada, Provinces, Territories, Census Metropolitan Areas and Census Agglomerations, 2001 Census - 20% Sample Data". www12.statcan.gc.ca. Retrieved 2023-11-04.
  59. 1 2 Government of Canada, Statistics Canada (2013-12-23). "2001 Census Topic-based tabulations Selected Places of Birth (85) for the Immigrant Population, for Canada, Provinces, Territories, Census Metropolitan Areas and Census Agglomerations, 1996 and 2001 Censuses - 20% Sample Data". www12.statcan.gc.ca. Retrieved 2023-11-04.
  60. Government of Canada, Statistics Canada (2019-06-04). "Data tables, 1996 Census Immigrant Population by Place of Birth (260A) and Sex (3), Showing Period of Immigration (6), for Canada, Provinces, Territories and Census Metropolitan Areas, 1996 Census (20% Sample Data)". www12.statcan.gc.ca. Retrieved 2023-11-26.
  61. Government of Canada, Statistics Canada (2013-04-03). "Eighth census of Canada,1941 = Huitième recensement du Canada Vol. 3. Ages of the population classified by sex, conjugal condition, racial origin, religious denomination, birthplace, etc." www12.statcan.gc.ca. Retrieved 2023-12-03.
  62. 1 2 , National Household Survey (NHS) Profile, 2011
  63. Canada, Government of Canada, Statistics (2013-05-08). "2011 National Household Survey Profile - Province/Territory". www12.statcan.gc.ca.{{cite web}}: CS1 maint: multiple names: authors list (link)
  64. "Windsor, Ont. and Sherbrooke, Que. top 'low-income' list as new data reveals Canada's poorest cities". nationalpost.com. 11 September 2013.
  65. "Income by postal code: Mapping Canada's richest and poorest neighbourhoods". globalnews.ca. 2013-03-19.
  1. Statistic includes all persons that did not make up part of a visible minority or an aboriginal identity.