Demographics of the State of Palestine

Last updated

Demographics of State of Palestine
Palestine single age population pyramid 2020.png
Population pyramid of the State of Palestine in 2020
Population
Growth rate
  • 1.69% (West Bank – 2022 est.)
  • 2.02% (Gaza Strip – 2022 est.)
Birth rate
  • 24.42 births/1,000 population (West Bank – 2022 est.)
  • 27.67 births/1,000 population (Gaza Strip – 2022 est.)
Death rate
  • 3.4 deaths/1,000 population (West Bank – 2022 est.)
  • 2.91 deaths/1,000 population (Gaza Strip – 2022 est.)
Language
SpokenArabic, Hebrew (by Israeli settlers and many Palestinians)

Demographic features of the population of the area commonly described as Palestinian territories includes information on ethnicity, education level, health of the populace, economic status, religious affiliations and other aspects of that population.

Contents

According to a commonly used definition as relating to an application of the 1949 Armistice Agreement green line, the Palestinian territories have contributory parts of the West Bank (including East Jerusalem) and the Gaza Strip.

The Palestinian National Authority, the United Nations Security Council, [1] the United Nations General Assembly, [2] the European Union, [3] the International Court of Justice, [4] and the International Committee of the Red Cross [5] use the terminology "Palestinian territories" or "occupied Palestinian territories". Israel refers to the administrative division encompassing Israeli-controlled Jewish-majority civilian areas of Area C of the West Bank, excluding East Jerusalem, as Judea and Samaria Area (Hebrew : אֵזוֹר יְהוּדָה וְשׁוֹמְרוֹן, Ezor Yehuda VeShomron). [6]

Overview

Palestine (region)

The demographic statistics of The World Factbook and the Israel Central Bureau of Statistics estimated that the collective Palestinian (including Israeli Arabs) population in the region of Palestine, including Israel, the Golan Heights, the West Bank including East Jerusalem, and the Gaza Strip, amounted to 5.79 million people in 2017. [7] [8] Of these, 2.16 million Palestinians lived in the West Bank, 1.84 million lived in Israel, and 1.79 million lived in the Gaza Strip. [7] [8]

Demographics of Israeli and Palestinian Territories
Region &
Status
By nationalityTotal
Population
Year
Source
By ethnoreligious groupArea (km2)
IsraelisYear
Source
Palestinian
Non-Israeli
Citizens
YearJewishPalestinianOther
West Bank Areas A & B

(Some Palestinian control)

02,464,5662023
[9]
2,464,5662023
[9]
02,464,56602,808
[10]
Gaza Strip

(Some Palestinian control)

02,226,544mid-
2023
[9]
2,226,544mid-
2023
[9]
02,226,5440365
Seam Zone (Occupied) [11] 517,4071/2024
[12] [13]
300,0002019
[14] [15]
817,4072019/
1/1/24

[16]
517,407300,0000200
[17]
West Bank Area C (Full Israeli control)3,378
[10]
East Jerusalem

Annexed
[18] [19] [20]

259,814
of which Israeli Arab  ~18,982
2021
[21]
351,5702021
[21]
611,3842021
[21]
240,832370,552
of which Israeli Arab  ~18,982
0336
[17]
Total Area of the Region of Palestine outside the Green Line7,087
Green Line

De facto 1949–1967 borders [22]

8,660,2092019/
-21/-3

[23]
08,660,2092019/
-21/-3

[22]
6,422,761
74%
1,689,018
20%
554,000
6%
20,582
[22]
Golan Heights

Annexed
[18] [19] [20] [24]

53,000
Jews 27,000
Druze 24,000
Alawite 2,000
2021
[25]
02021
[25]
53,0002021
[25]
27,00026,00001,154
Total Area of the State of Israel as defined by the Israeli CBS22,072
CBS Total Population of Israel9,496,000~346,000
East Jerusalem Palestinians
9,842,0002023
[ citation needed ]
7,208,0002,080,000
Israeli cit. 1,734,000
Non-Israeli ~346,000
554,000
Total Region of Palestine combined14,833,110Sum7,208,000 (48.6%)7,071,000 (47.7%)
Israeli 1,734,000 (11.7%),
Non-Israeli 5,337,110 (36.0%)
554,000 (3.7%)25,650

Note: Israeli definitions

The definition of what constitutes the population of Israel varies depending on which territories are counted and which population groups are counted in each territory.

The Israel Central Bureau of Statistics ("CBS") definition of the Area of the State of Israel: [26]

  • includes East Jerusalem since 1967, which Israel unilaterally annexed
  • includes the Golan Heights since 1982, which Israel unilaterally annexed
  • excludes the West Bank other than East Jerusalem

The CBS' definition of the Population of Israel, however: [27]

  • includes non-Israeli Palestinians (as well as Israeli Arabs/Palestinians) in East Jerusalem who have permission to live there
  • includes Israeli settlers and others with Israeli residency permits living in the Area C of West Bank
  • excludes Palestinian/Arab/other residents of Area C and East Jerusalem who do not have Israeli citizenship or residence
  • excludes persons who are not registered (from 2008 on) and/or entered illegally, and foreign workers
Demographic map of Gaza, West Bank, Israel proper and the Golan Heights Demographic map of Palestine - Israel - with Legend.png
Demographic map of Gaza, West Bank, Israel proper and the Golan Heights

Palestinian Territories

Israeli estimates

The Israel Central Bureau of Statistics estimated (2017) that the collective population in the Palestinian territories amounted to 4,543,126 people in 2017. Thereof, 2,155,743 Arabs live in the West Bank, 1,795,183 Arabs live in the Gaza Strip, and 391,000 Jews live in the West Bank outside of East Jerusalem. [8] Approximately 214,600 Jews live in East Jerusalem. [28] East Jerusalem, once administered by Jordan, came under Israeli occupation after the 1967 Six-Day War. [29] In the Palestinian territories, c. 86% of the population is Arab (predominantly Sunni), c. 13% is Jewish, other <1% (cf. Israel: Jewish 74%, Arab 21%, other 5%). [8]

US CIA estimates

The demographic statistics of The World Factbook the 2023 estimated population of Israel including the Golan Heights and East Jerusalem is 9,043,387 (2023 est.). Of this population: [30]

  • Approximately 236,600 Israeli settlers lived in East Jerusalem (2021)
  • The split by ethnoreligious groups was Jewish 73.5% (of which Israel-born 79.7%, Europe/America/Oceania-born 14.3%, Africa-born 3.9%, Asia-born 2.1%), Palestinian and other Arab non-Jews 21.1%, other 5.4% (2022 est.)
  • By religion, the split was Jewish 73.5%, Muslim 18.1%, Christian 1.9%, Druze 1.6%, other 4.9% (2022 est.)

Palestinian estimates

According to the Palestinian Central Bureau of Statistics (PCBS), the number of Palestinians in the Palestinian Territories was 3,935,249 in 2009, resulting in a calculated population density of 654 capita per km2, of which 433 capita/km2 in the West Bank including Jerusalem and 4,073 capita/km2 in Gaza Strip. [31] In the mid-2009, the share of population less than 15 years was 41.9% and above 65 years 3%. [31]

UN estimates

According to the UN, the population in the State of Palestine was c. 4.9 million in 2017, resulting in an estimated population density of 817 capita per km2. [32] However, a Census held on 1 December 2017 resulted in a total of 4,781.245. The estimate of the Palestine Central Bureau of Statistics for mid 2023 showed a population total of 5,483,450.


Key derived statistics

Out of 224 listed countries and territories, in 2018, the West Bank ranked 48th with a total fertility rate (TFR) of 3.2, and the Gaza Strip ranked 31st with a TFR of 3.97 according to The World Factbook. [33] In 2018, the West Bank had an estimated population growth rate of 1.81% (country comparison to the world: 56th) and the Gaza Strip had a population growth rate of 2.25% (35th). [8] [34] [35]

Population (mid-year, millions) [36] [37] [38]
Year West Bank Gaza Total
19700.690.341.03
19800.900.461.36
19901.250.651.90
20001.981.133.11
20102.521.604.12
20142.731.824.55
Source: U.S. Census Bureau
20062.51.54.0
20092.481.453.94
Source: Palestinian Central Bureau of Statistics
NameArea
in
km2
Pop. [39]
Census
1 Dec 2017
Pop. [9]
Estimate
mid 2023
Pop.
density
mid 2023
(per km2)
West Bank [34] 5,6552,881,9543,256,906576
Gaza Strip [8] 3651,899,2912,226,5446,100
Total6,0204,781,2455,483,450911
Palestinian territories [40]
YearPop.±% p.a.
1997 2,783,084    
1998 2,871,568+3.18%
1999 2,962,226+3.16%
2000 3,053,335+3.08%
2001 3,138,471+2.79%
2002 3,225,214+2.76%
2003 3,314,509+2.77%
2004 3,407,417+2.80%
2005 3,508,126+2.96%
2006 3,611,198+2.94%
2007 3,719,189+2.99%
2008 3,825,512+2.86%
2009 3,935,249+2.87%
2010 4,048,403+2.88%
2011 4,168,860+2.98%
2012 4,293,313+2.99%
2013 4,420,549+2.96%
2014 4,550,368+2.94%
2015 4,682,467+2.90%
2016 4,816,503+2.86%
2017 4,952,168+2.82%
2021 5,227,193+1.36%
West Bank [40]
YearPop.±% p.a.
2012 2,649,020    
2013 2,719,112+2.65%
2014 2,790,331+2.62%
2015 2,862,485+2.59%
2016 2,935,368+2.55%
2017 3,008,770+2.50%
2021 3,120,448+0.92%
Gaza Strip [40]
YearPop.±% p.a.
2012 1,644,293    
2013 1,701,437+3.48%
2014 1,760,037+3.44%
2015 1,819,982+3.41%
2016 1,881,135+3.36%
2017 1,943,398+3.31%
2021 2,106,745+2.04%

Vital statistics

UN estimates

[41]

Mid-year population (thousands)Live births (thousands)Deaths (thousands)Natural change (thousands)Crude birth rate (per 1000)Crude death rate (per 1000)Natural change (per 1000) Total fertility rate (TFR) Infant mortality (per 1000 live births) Life expectancy (in years)
1950  945  46  20  2648.321.027.37.84142.345.79
1951  953  47  20  2748.520.927.77.84141.745.88
1952  963  47  20  2748.720.628.17.84140.546.09
1953  973  48  20  2848.920.428.57.83139.146.33
1954  985  49  20  2949.220.129.17.83137.546.61
1955  997  50  20  3049.419.829.67.82135.846.92
1956  1 010  51  20  3149.719.530.27.82133.847.27
1957  1 025  52  20  3249.919.130.87.81131.747.66
1958  1 040  53  20  3350.118.731.47.81129.448.08
1959  1 057  54  19  3450.318.332.07.81126.948.53
1960  1 074  55  19  3550.417.832.67.79124.349.01
1961  1 092  56  19  3650.417.333.17.79121.449.55
1962  1 110  57  19  3850.516.833.77.79118.450.12
1963  1 128  57  19  3950.416.334.27.78115.150.75
1964  1 142  58  18  4050.415.734.67.78111.751.38
1965  1 149  59  18  4150.315.235.17.78108.252.03
1966  1 148  59  17  4250.214.635.57.75104.752.69
1967  1 137  58  18  4150.115.234.97.74101.150.97
1968  1 123  57  16  4249.913.536.37.7197.754.03
1969  1 115  57  15  4249.713.036.67.6894.154.70
1970  1 118  56  14  4249.412.536.97.6590.655.35
1971  1 136  56  14  4349.212.037.27.6187.355.99
1972  1 167  57  14  4449.011.537.57.5984.056.65
1973  1 195  59  31  2849.226.023.27.5580.834.74
1974  1 225  61  13  4849.310.638.77.5277.857.98
1975  1 264  62  13  4949.110.238.97.4874.858.64
1976  1 301  64  13  5148.89.739.17.4471.659.32
1977  1 337  65  13  5348.49.339.17.3868.560.00
1978  1 374  66  12  5448.08.939.17.3365.660.66
1979  1 413  68  12  5647.68.439.27.2862.461.39
1980  1 454  69  12  5747.38.039.37.2359.262.11
1981  1 498  71  11  5947.07.639.47.1756.262.79
1982  1 546  73  11  6146.87.239.67.1253.463.45
1983  1 604  75  11  6446.66.939.77.0750.564.16
1984  1 674  78  11  6746.46.539.97.0147.964.80
1985  1 731  81  11  7046.16.239.96.9545.665.36
1986  1 775  82  11  7146.06.040.06.9143.665.86
1987  1 863  84  11  7446.05.740.26.8841.366.42
1988  1 963  90  11  7945.95.540.46.8539.266.84
1989  2 041  94  11  8345.95.340.66.8137.467.28
1990  2 125  98  11  8746.05.140.96.7835.867.93
1991  2 214  102  11  9145.94.940.96.7234.768.31
1992  2 310  105  11  9445.64.840.86.6333.368.59
1993  2 411  108  11  9744.84.740.16.5032.168.85
1994  2 515  110  11  9943.84.439.46.3430.769.41
1995  2 623  112  11  10142.84.338.56.1829.669.66
1996  2 734  114  11  10241.64.137.56.0028.670.06
1997  2 847  115  11  10440.54.036.55.8227.670.40
1998  2 951  118  12  10639.83.935.95.7026.870.63
1999  3 044  120  12  10839.23.835.35.5826.070.86
2000  3 140  121  13  10838.44.034.55.4425.370.39
2001  3 230  122  13  10937.74.133.65.3224.669.89
2002  3 309  123  13  11137.13.833.25.1924.170.97
2003  3 384  123  13  11036.13.832.35.0223.271.05
2004  3 460  124  13  11135.73.831.94.9422.471.18
2005  3 541  125  13  11235.23.631.64.8421.772.07
2006  3 628  125  13  11234.53.630.84.7221.071.92
2007  3 718  125  13  11233.63.630.04.6120.372.15
2008  3 809  128  14  11433.53.629.94.5019.972.41
2009  3 899  131  14  11733.43.629.94.4119.372.61
2010  3 992  135  14  12133.73.530.24.3818.673.00
2011  4 088  137  14  12333.43.529.94.2718.173.24
2012  4 184  138  14  12432.93.429.54.1617.673.47
2013  4 282  140  14  12532.53.329.24.0817.274.03
2014  4 380  143  17  12632.53.828.64.0417.672.62
2015  4 485  147  15  13232.73.329.44.0516.474.41
2016  4 594  147  15  13231.93.328.63.9415.974.55
2017  4 701  146  15  13131.03.327.73.8115.474.83
2018  4 806  145  16  12930.13.326.83.7115.074.79
2019  4 910  145  16  12929.53.226.23.6414.675.24
2020  5 019  145  18  12728.83.525.33.5714.174.40
2021  5 133  145  20  12628.23.824.43.5013.873.47

Births and deaths

[42] [43]

Average populationLive birthsDeathsNatural changeCrude birth rate (per 1000)Crude death rate (per 1000)Natural change (per 1000)Total fertility rate
2007122,59310,782111,811
2008126,32311,337114,9864.4
2009129,64811,907117,741
20104,048,403138,80910,810127,99934.32.731.6
20114,168,801133,32611,397121,92932.02.729.24.1
20124,293,313131,63211,782119,85030.72.727.9
20134,420,549127,45411,188116,26628.82.526.3
20144,550,368128,07313,390114,68328.12.925.2
20154,530,416132,99511,908121,08729.42.626.7
20164,632,025138,23812,202126,03629.82.627.2
20174,733,357140,44111,778128,66329.72.527.23.8
20184,854,013143,33412,452130,88229.52.627.0
20194,976,684139,24612,847126,39928.02.625.4
20205,101,152132,29114,106118,18525.92.823.2
20215,227,193

Population pyramids

Population by Sex and Age Group (Census 01.XII.2007) (Data have not been adjusted for underenumeration. Excluding data from the parts of Jerusalem which were annexed by Israel in 1967.):

Census (01/12/2007) :

Age groupMaleFemaleTotal%
Total1 747 2841 696 5443 443 828100
0–4266 052253 883519 93515.10
5–9239 156227 724466 88013.56
10–14238 306227 967466 27313.54
15–19211 464202 975414 43912.03
20–24158 374151 561309 9359.00
25–29128 068124 159252 2277.32
30–34108 945106 343215 2886.25
35–3990 15586 905177 0605.14
40–4481 18675 328156 5144.54
45–4960 83256 748117 5803.41
50–5441 60641 69583 3012.42
55–5932 01130 99963 0101.83
60–6422 06025 76947 8291.39
65–6913 85319 84433 6970.98
70–7412 68916 62729 3160.85
75–798 59912 53621 1350.61
80–844 8616 88811 7490.34
85–892 3183 0265 3440.16
90–948711 1332 0040.06
95+4645971 0610.03
unknown25 41423 83749 2510.14
Age groupMaleFemaleTotalPercent
0–14743 514709 5741 453 08842.19
15–64934 701902 4821 837 18353.35
65+43 65560 651104 3063.03
Population Estimates by Sex and Age Group (01.VII.2013):
Age groupMaleFemaleTotal%
Total2 245 4002 175 1494 420 549100
0–4333 246319 213652 45914.76
5–9295 678283 886579 56413.11
10–14275 428263 679539 10712.20
15–19262 267251 710513 97711.63
20–24230 888221 790452 67810.24
25–29182 448174 730357 1788.08
30–34144 721138 652283 3736.41
35–39122 846119 333242 1795.48
40–44103 233100 276203 5094.60
45–4987 96982 580170 5493.86
50–5470 53565 239135 7743.07
55–5948 91246 91095 8222.17
60–6432 35333 58165 9341.49
65–6921 98526 41448 3991.09
70–7414 20119 83134 0320.77
75–799 34413 72823 0720.52
80+9 34613 59722 9430.52
Age groupMaleFemaleTotalPercent
0–14904 352866 7781 771 13040.07
15–641 286 1721 234 8012 520 97357.03
65+54 87673 570128 4462.91

Source: [44]

Palestinian Central Bureau

fertility rate (Gaza)birth rate (Gaza)death rate (Gaza)Natural change(Gaza)
199745.44.740.7
200044.54.340.2
200542.23.939.3
200936.94.132.8
20104.937.14.033.1
201137.23.934.3
201337.13.734.4
fertility rate (West Bank)birth rate (West Bank)death rate (West Bank)Natural change(West Bank)
199741.25.136.1
200038.84.634.2
200534.54.130.4
200930.14.425.7
20103.830.14.225.9
201130.14.126.0
201329.74.025.7

Source: [45]

Life expectancy

Average life expectancy at age 0 of the total population. [46]

Life expectancy at birth in Palestine Life expectancy by WBG -West Bank and Gaza -diff.png
Life expectancy at birth in Palestine
PeriodLife expectancy in
Years
PeriodLife expectancy in
Years
1950–195546.61985–199067.1
1955–196048.21990–199568.9
1960–196550.81995–200070.3
1965–197054.12000–200571.2
1970–197557.52005–201072.0
1975–198061.02010–201572.9
1980–198564.4

Demographics of the West Bank

Population pyramid Gaza Strip 2016 Bevolkerungspyramide Gazastreifen 2016.png
Population pyramid Gaza Strip 2016
Population pyramid West Bank 2016 Bevolkerungspyramide Westjordanland 2016.png
Population pyramid West Bank 2016

The following demographic statistics are from The World Factbook, unless otherwise indicated.

Population

Total 2,939,418 (July 2018 est.); 71.72% of the population is Arab (predominantly Sunni), 28.28% is Jewish [8] (cf. Israel: Jewish 74%, Arab 21%, other 5%; and Gaza: Arab 99%) [47]

Age structure

0–14 years: 36.1% (male 518,376/female 491,676)

15–24 years: 21.8% (male 302,474/female 289,852)

25–54 years: 34.5% (male 489,559/female 475,402)

55–64 years: 4.7% (male 68,317/female 64,233)

65 years and over: 3.5% (male 44,662/female 53,943) (2018 est.)

Population growth rate

1.81% (2018 est.)

Birth rate

26 births/1,000 population (2018 est.)

Mortality rate

3.5 deaths/1,000 population (2018 est.)

Net migration rate

−4.4 migrant(s)/1,000 population (2018 est.)

Sex ratio

at birth: 1.06 male(s)/female

0–14 years: 1.05 male(s)/female

15–24 years: 1.04 male(s)/female

25–54 years: 1.03 male(s)/female

55–64 years: 1.06 male(s)/female

65 years and over: 0.73 male(s)/female

total population: 1.04 male(s)/female (2017 est.)

Infant mortality rate

total: 13.6 deaths/1,000 live births
male: 15.3 deaths/1,000 live births
female: 11.9 deaths/1,000 live births (2018 est.)

Life expectancy at birth

total population: 75.4 years
male: 73.4 years
female: 77.6 years (2018 est.)

Total fertility rate

3.2 children born/woman (2018 est.)

Nationality

noun: Arabs: Palestinian

Ethnic groups

Palestinian Arab: 83%
Israeli Jewish and other: 17%

Religions

Muslim 80–85% (predominantly Sunni)
Jewish 12–14%
Christian 1.0–2.5%, (mainly Greek Orthodox) [8]
Other religious minorities include Palestinian Metawalis, Palestinian Druze and Palestinian Baha'is.

Languages

Arabic (Palestinian Arabic, Modern Standard Arabic), English (compulsory in schools, widely[ quantify ] spoken by Palestinians), and Hebrew (spoken by Israeli Jews in the West Bank, and spoken by many[ quantify ] Palestinians) are commonly known.

Literacy

definition: age 15 and over can read and write
total population: 96.9%
male: 98.6%
female: 95.2% (2016 est.)

Demographics of the Gaza Strip

The following demographic statistics are from The World Factbook, unless otherwise indicated.

Population

Current: 2,098,389 (2023 est.) [34]

In 2023 approximately 2.1 million Palestinians lived in the Gaza Strip, [34] around 1.6 million of them UN-registered refugees. [52]

The Strip's population has continued to increase since that time, one of the main reasons being a total fertility rate of 3.38 children per woman (2023 est). In a ranking by total fertility rate, this places Gaza 42nd of 224 regions. [34]

Age structure

0–14 years: 44.1% (male 415,746/female 394,195)
15–24 years: 21.3% (male 197,797/female 194,112)
25–54 years: 28.5% (male 256,103/female 267,285)
55–64 years: 3.5% (male 33,413/female 30,592)
65 years and over: 2.6% (male 24,863/female 22,607) (2018 est.)

Population growth rate

2.25% (2018 est.)

Birth rate

30.5 births/1,000 population (2018 est.)

Mortality rate

3 deaths/1,000 population (2018 est.)

Net migration rate

−5 migrant(s)/1,000 population (2018 est.)

Sex ratio

at birth: 1.06 male(s)/female
0–14 years: 1.05 male(s)/female
15–24 years: 1.01 male(s)/female
25–54 years: 0.96 male(s)/female
55–64 years: 1.1 male(s)/female
65 years and over: 0.71 male(s)/female
total population: 1.02 male(s)/female (2017 est.)

Infant mortality rate

total population: 16/1,000 live births
male: 17.1/1,000 live births
female: 14.9/1,000 live births (2018 est.)

Life expectancy at birth

total population: 74.4 years
male: 72.7 years
female: 76.2 years (2018 est.)

Total fertility rate

3.97 children born/woman (2018 est.)

Nationality

noun: Palestinians
demonym: Palestinian

Ethnic groups

Palestinian/Arab 98.7%

Religions

Sunni Muslim 98–99%, Arab Christians 0.2% (2,000 to 3,000 est.), other, unaffiliated, unspecified <1.0% (2012 est.). [53] [34]

Languages

Arabic (Palestinian Arabic, Modern Standard Arabic), Hebrew (spoken by many older Gaza Palestinians), English (widely understood)

Literacy

definition: age 15 and over can read and write
total population: 96.9%
male: 98.6%
female: 95.2% (2016 est.)

See also

Notes

  1. Samaritans in the West Bank have Palestinian citizenship. (Sabella 2011, p. 75, n.4).

Related Research Articles

<span class="mw-page-title-main">Demographics of Israel</span>

The demographics of Israel, monitored by the Israel Central Bureau of Statistics, encompass various attributes that define the nation's populace. Since its establishment in 1948, Israel has witnessed significant changes in its demographics. Formed as a homeland for the Jewish people, Israel has attracted Jewish immigrants from Europe, Asia, Africa, and the Americas.

<span class="mw-page-title-main">Demographics of Jordan</span> Aspect of human geography in Jordan

Jordan has a population of more than 11.1 million inhabitants as of 2023. Jordanians are the citizens of Jordan. Around 94% of Jordanians are Arabs, while the remaining 6% belong to other ethnic minorities, including Circassians, Chechens, Armenians and Kurds. Around 2.9 million inhabitants are non-citizens, a figure including refugees, legal and illegal immigrants. Jordan's annual population growth rate stands at 3.05% as of 2023, with an average birth rate of 2.8. There were 1,977,534 households in Jordan in 2015, with an average of 4.8 persons per household.

<span class="mw-page-title-main">Palestinians</span> Ethnonational group of the Levant

Palestinians or Palestinian people, also referred to as Palestinian Arabs, are an ethnonational group descending from peoples who have inhabited the region of Palestine over the millennia, and who today are culturally and linguistically Arab.

<span class="mw-page-title-main">West Bank</span> Territory in West Asia

The West Bank, so called due to its relation to the Jordan River, is the larger of the two Palestinian territories. A landlocked territory near the coast of the Mediterranean Sea in the Levant region of West Asia, it is bordered by Jordan and the Dead Sea to the east and by Israel to the south, west, and north. The territory has been under Israeli occupation since 1967.

<span class="mw-page-title-main">Palestinian territories</span> Occupied Palestinian territory in the Middle East

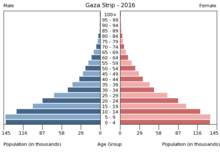
The Palestinian territories are the two regions of the former British Mandate for Palestine that have been occupied by Israel since the Six-Day War of 1967, namely the West Bank and the Gaza Strip. The International Court of Justice (ICJ) has referred to the West Bank, including East Jerusalem, as "the Occupied Palestinian Territory", and this term was used as the legal definition by the ICJ in its advisory opinion of July 2004. The term occupied Palestinian territory was used by the United Nations and other international organizations between October 1999 and December 2012 to refer to areas controlled by the Palestinian National Authority, but from 2012, when Palestine was admitted as one of its non-member observer states, the United Nations started using exclusively the name State of Palestine. The European Union (EU) also uses the term "occupied Palestinian territory". The government of Israel and its supporters use the label "disputed territories" instead.

<span class="mw-page-title-main">State of Palestine</span> Country in West Asia

Palestine, officially the State of Palestine, is a country in the Southern Levant region of West Asia. It comprises of two disconnected regions – the West Bank and the Gaza Strip. It shares borders with Israel to the west and north, Jordan to the east and Egypt to the southwest. Palestine's combined land area is 6,020 square kilometres (2,320 sq mi) while its population exceeds five million people. Its proclaimed capital is Jerusalem while Rafah is the largest city and Ramallah serves as the administrative center. The official language is Arabic. The majority of Palestinians practice Islam while Christianity also has a significant presence.

<span class="mw-page-title-main">One-state solution</span> Proposed resolution of the Israeli-Palestinian conflict

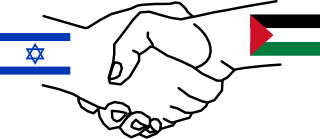
The one-state solution is a proposed approach to resolving the Israeli–Palestinian conflict, according to which one state would be established between the River Jordan and the Mediterranean. Proponents of this solution advocate a single state encompassing the currently recognized state of Israel, the West Bank and the Gaza Strip. The term one-state reality describes the belief that the current situation in Israel/Palestine is de facto a single state. The one-state solution is sometimes also called a bi-national state, owing to the hope that the state would be a homeland for both Jews and Palestinians.

<span class="mw-page-title-main">Rafah</span> Palestinian city in south Gaza Strip

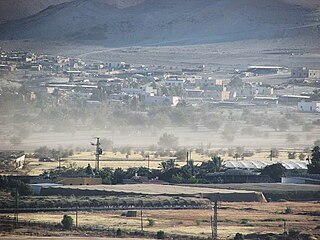
Rafah is a Palestinian city in the southern Gaza Strip. It is the capital of the Rafah Governorate of the State of Palestine, located 30 kilometers (19 mi) south-west of Gaza City. In 2017, Rafah had a population of 171,889. As a result of massive bombardment and ground assaults in Gaza City and Khan Yunis by Israel during the Israel–Hamas war, about 1.4 million people are believed to be sheltering in Rafah as of February 2024.

<span class="mw-page-title-main">Population statistics for Israeli settlements in the West Bank</span>

The population statistics for Israeli settlements in the West Bank are collected by the Israel Central Bureau of Statistics. As such, the data contains only population of settlements recognized by the Israeli authorities. Israeli outposts, which are illegal by Israeli law, are not tracked, and their population is hard to establish. All settlements in the West Bank were advised by the International Court of Justice to be unlawful.

<span class="mw-page-title-main">Qalqilya</span> Main city in the Qalqilya Governorate, West Bank, State of Palestine

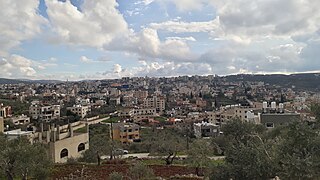
Qalqilya or Qalqiliya is a Palestinian city in the West Bank which serves as the administrative center of the Qalqilya Governorate of the State of Palestine. In the 2017 census, the city had a population of 51,683. Qalqilya is surrounded by the Israeli West Bank wall, with a narrow gap in the east controlled by the Israeli military and a tunnel to the Palestinian town of Hableh. Qalqilya is under the administration of the Palestinian National Authority, while remaining under Israeli military occupation. Oranges are a major part of the city's economy.

The population of the region of Palestine, which approximately corresponds to modern Israel and the Palestinian territories, has varied in both size and ethnic composition throughout the history of Palestine.

<span class="mw-page-title-main">Salfit</span> Municipality type A in State of Palestine

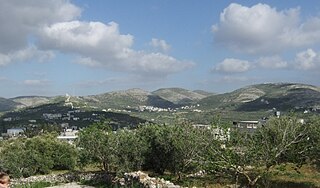
Salfit is a Palestinian city in the central West Bank, and the capital of the Salfit Governorate of the State of Palestine. Salfit is located at an altitude of 570 meters (1,870 ft), adjacent to the Israeli settlement of Ariel. According to the Palestinian Central Bureau of Statistics (PCBS), Salfit had a population of 10,911 in 2017. Since the 1995 Interim Agreement on the West Bank and the Gaza Strip, Salfit, located in Area A, has been administered by the Palestinian National Authority, while continuing under Israeli military occupation.

<span class="mw-page-title-main">'Atara</span> Municipality type D in Ramallah and al-Bireh, State of Palestine

'Atara is a Palestinian village in the Ramallah and al-Bireh Governorate, located 15 kilometers north of Ramallah in the central West Bank. It is situated along a mountain ridge line with four peaks and is built upon the second highest point in the West Bank at 810 meters above sea level. 'Atara's total land area consists of 9,545 dunams, most of which is cultivable.

<span class="mw-page-title-main">Fasayil</span> Municipality type D in Jericho, State of Palestine

Fasayil or Fasa'il, ancient Phasaelis, is a Palestinian village in the northeastern West Bank, a part of the Jericho Governorate, located 14 kilometres (8.7 mi) northwest of Jericho and about 40 kilometres (25 mi) southeast of Nablus. The closest Palestinian locality is Duma to the west. The village is located 2 km south of the Israeli settlement of Petza'el. According to the 2017 census by the Palestinian Central Bureau of Statistics (PCBS), the village had a population of 1,637.

<span class="mw-page-title-main">An-Naqura</span> Municipality type D in Nablus, State of Palestine

An-Naqura is a Palestinian village in the Nablus Governorate in northern West Bank, located 10 kilometers northwest of Nablus and adjacent to the Israeli settlement of Shavei Shomron. According to the Palestinian Central Bureau of Statistics (PCBS) census, the village had a population of 1,545 in 2007 and 1,786 in 2017. An-Naqura is administered by a ten-member village council headed by Muhammad Hashish.

<span class="mw-page-title-main">Kufeirit</span> Municipality type D in Jenin, State of Palestine

Kufeirit is a Palestinian village in the West Bank, located 16 km west of the city of Jenin in the northern West Bank. According to the Palestinian Central Bureau of Statistics, the town had a population of 2,446 inhabitants in mid-year 2006 and 3,068 by 2017.

<span class="mw-page-title-main">Ijnisinya</span> Municipality type D in Nablus, State of Palestine

Ijnisinya is a Palestinian village located six kilometres northwest of Nablus in the Nablus Governorate. Most of the working-age inhabitants live as farmers or governmental workers. It had a population of about 585 in 2017. Ijnisinya is governed by a village council.

People of the Palestinian territories—the West Bank and the Gaza Strip—are bound by differing laws that handle marital unions on the basis of the couple's national status and religious affiliation. After the 1948 Arab–Israeli War, the Palestinian residents of the Jordanian-annexed West Bank and the Egyptian-occupied Gaza Strip became subject to Jordanian marriage law and Egyptian marriage law, respectively. After the 1967 Arab–Israeli War, which saw Israel capture the Palestinian territories from Jordan and Egypt, those original laws largely remained in place.

<span class="mw-page-title-main">Ammuriya, Nablus</span> Local Development Committee in Nablus, State of Palestine

Ammuriya is a Palestinian village in the Nablus Governorate of the State of Palestine in the northern West Bank, located south of Nablus. According to the Palestinian Central Bureau of Statistics (PCBS) census, Ammuriya had a population of 371 in 2017. There were 48 households and five business establishments in the village.

References

  1. Resolution 446, Resolution 465, Resolution 484, among others
  2. "Applicability of the Geneva Convention relative to the Protection of Civilian Persons in Time of War, of 12 August 1949, to the Occupied Palestinian Territory, including Jerusalem, and the other occupied Arab territories". United Nations. 17 December 2003. Archived from the original on 3 June 2007. Retrieved 27 September 2006.
  3. "EU-Settlements Watch" (PDF). 1 February – 31 July 2002. Archived from the original (PDF) on 7 September 2009. Retrieved 23 May 2013.
  4. "Legal Consequences of the Construction of a Wall in the Occupied Palestinian Territory". International Court of Justice. 9 July 2004. Archived from the original on 28 August 2007. Retrieved 27 September 2006.
  5. "Conference of High Contracting Parties to the Fourth Geneva Convention: statement by the International Committee of the Red Cross". International Committee of the Red Cross. 5 December 2001. Archived from the original on 7 February 2011. Retrieved 27 September 2006.
  6. "Statistical Abstract of Israel 2012" (PDF). Archived from the original (PDF) on 15 December 2013. Retrieved 15 January 2013.
  7. 1 2 "Population of Israel on the Eve of 2018 – 8.8 Million". Press Release. Israel Central Bureau of Statistics. 31 December 2017. Retrieved 2 January 2018.
  8. 1 2 3 4 5 6 7 8 9 10 "CIA – The World Factbook: West Bank". Cia.gov. Retrieved 7 April 2019.
  9. 1 2 3 4 5 Gaza Strip and West Bank (except Jerusalem) estimate for mid-2023 as per "Estimated Population in the Palestine Mid-Year by Governorate,1997-2026". Palestinian Central Bureau of Statistics, State of Palestine. Retrieved 1 January 2024. Subtract a further est. 300,000 from the West Bank number which is the est. no. of Palestinians living in Area C under full Israeli control.
  10. 1 2 Office for the Coordination of Humanitarian Affairs. "Area C Humanitarian Response Plan Fact Sheet September 2010" (PDF). Archived from the original (PDF) on 11 October 2010. Retrieved 5 October 2010.
  11. "The Separation Barrier – Statistics". B'Tselem. 16 July 2012. Retrieved 5 April 2013. Data source: Israel 's Central Bureau of Statistics, The PA Central Bureau of Statistics and OCHA. All data on population updated to the end of 2005.
  12. Katz, Yaakov (1 January 2024). "WEST BANK Jewish Population Stats (not including eastern Jerusalem) UPDATED TO: JANUARY 1, 2024" (PDF). WestBankJewishPopulationStats.com. Retrieved 12 February 2024.
  13. Tia Goldenberg (2 February 2023). "Jewish settler population in the West Bank surpasses half a million". Los Angeles Times. Associated Press. Retrieved 31 December 2023.
  14. Biard, Michel (26 June 2019). "Addressing the Needs of Palestinian Households in Area C of the West Bank - Findings of the First Comprehensive Household Survey (January 2019) - occupied Palestinian territory". ReliefWeb. Oxfam. Retrieved 31 December 2023.
  15. "Occupied Palestinian Territory Area C of the West Bank" (PDF). UN Office for the Coordination of Humanitarian Affairs. August 2014. Retrieved 31 December 2023.
  16. Sum of Israeli and Palestinian estimates
  17. 1 2 Office for the Coordination of Humanitarian Affairs. "Barrier Report July 2009. Calculation based on East Jerusalem area of 346km2 being 97% west of the barrier, and 9.5% of the West bank including East Jerusalem being in the Seam Zone" (PDF). Archived from the original (PDF) on 13 October 2009. Retrieved 5 October 2010.
  18. 1 2 BBC News. Regions and territories: The Golan Heights.
  19. 1 2 United Nations. Security Council Resolutions, 1981.
  20. 1 2 Council on Foreign Relations. UN Security Council Resolution 497.
  21. 1 2 3 "Total" and "Jewish/Other" figures from "III/5 Population of Jerusalem by Population Group, Religious Identification, Quarter and Sub-Quarter, 2021 in Jerusalem Statistical Yearbook". Jerusalem Institute for Policy Research. 2021. Retrieved 31 December 2023.. From this number subtract 18,982 Arabs who have Israeli citizenship, viz. "Just 5 Percent of E. Jerusalem Palestinians Have Received Israeli Citizenship Since 1967". Haaretz. Retrieved 31 December 2023. East Jerusalem consists of Areas 2111–2911, all of Quarters 1, 4, and 16; in Quarter 5 Giv'at Shapira (French Hill), Ramat Eshkol, Giv'at Hamivtar and Ma'alot Dafna (but not Shmuel Hanavi), and in Quarter 13 East Talpiot.
  22. 1 2 3 Figure calculated from other sourced figures in table
  23. Derived from total CBS Population of Israel 31-Dec-2023 minus estimates for East Jerusalem Israelis and non-Israeli Palestinians, minus Golan Heights, minus 1/1/24 estimate of settlers in Area C
  24. Aji, Albert (26 March 2019). "Trump acceptance of Israeli control of Golan sparks protests". Associated Press. Retrieved 29 March 2019.
  25. 1 2 3 "'This is our moment': Israel okays major plan to boost Golan, double its population". The Times of Israel. 26 December 2021. Retrieved 31 December 2023.
  26. ""Area of the State of Israel", All Terms". Central Bureau of Statistics, State of Israel. Retrieved 31 December 2023.
  27. ""Population of Israel", All Terms". www.cbs.gov.il. Retrieved 31 December 2023.
  28. Korach, Michal; Maya Choshen (2018). Jerusalem: Facts and Trends 2018: The State of the City and Changing Trends (PDF). Jerusalem Institute for Policy Research – Publication no. 485. Jerusalem: Jerusalem Institute for Policy Research. OCLC   1164773453.
  29. Ian S. Lustick, "Has Israel Annexed East Jerusalem?", Middle East Policy , Vol. V, No. 1, pp. 34–45, January 1997; accessed 25 November 2014.
  30. "Israel". The World Factbook. Central Intelligence Agency. 31 January 2024. Retrieved 13 February 2024.
  31. 1 2 Palestine in Figures 2009 Palestinian Central Bureau of Statistics, May 2010
  32. "State of Palestine – General Information". United Nations. Retrieved 8 March 2018.
  33. "COUNTRY COMPARISON :: TOTAL FERTILITY RATE". The World Factbook. CIA. Archived from the original on 28 October 2009. Retrieved 13 May 2019.
  34. 1 2 3 4 5 6 "Middle East :: Gaza Strip — the World Factbook – Central Intelligence Agency". 6 June 2022.
  35. "COUNTRY COMPARISON :: POPULATION GROWTH RATE". The World Fact Book. CIA. Archived from the original on 27 May 2016. Retrieved 8 March 2018.
  36. US Census Bureau International Programs Archived 2013-10-14 at the Wayback Machine International Data Base IDB West Bank and Gaza
  37. Palestinians in figures 2009 Palestinian Central Bureau of Statistics May 2010
  38. Palestinians at the End of Year 2006 Palestinian Central Bureau of Statistics
  39. Palestinian Central Bureau of Statistics, 2018
  40. 1 2 3 "PCBS | Indicators". www.pcbs.gov.ps.
  41. United Nations Department of Economic and Social Affairs Population Division (2022). "World Population Prospects 2022 Demographic indicators by region, subregion and country, annually for 1950-2100" (XLS (91MB)). United Nations Population Division . 27 (Online ed.). New York: United Nations Department of Economic and Social Affairs, Population Division. rows 9941:10012,cols M,X,AE,S,AH,S,AA,AV,AI. Archived from the original on 9 August 2022.
  42. "PCBS | Number of Registered Live Births in Palestine* by Region and Governorate, 2007 - 2020". www.pcbs.gov.ps.
  43. "PCBS | Number of Registered Deaths in Palestine* by Region and Governorate, 2007 - 2020". www.pcbs.gov.ps.
  44. "Demographic Yearbook". United Nations. Retrieved 4 December 2015.
  45. "Palestinian Children – Issues and Statistics Annual Report, 2012" (PDF). www.pcbs.gov.ps. Retrieved 20 October 2023.
  46. "World Population Prospects – Population Division – United Nations". esa.un.org. Retrieved 26 August 2018.
  47. "Israel". The World Factbook . Cia.gov. Retrieved 8 March 2018.
  48. "West Bank settler population surged during Trump era, report says". The Times of Israel. Retrieved 28 January 2021.
  49. "Settlement population growth slows for 10th straight year". 9 January 2016. Retrieved 4 December 2019.
  50. Sabella, Bernard (2011). "The Status of Non-Muslims in a Palestinian State". In Ahlstand, Kajsa; Gunner, Goran (eds.). Non-Muslims in Muslim Majority Societies: With Focus on the Middle East and Pakistan. ISD LLC. pp. 73–75. ISBN   978-0-718-84301-4.
  51. Archived 28 September 2018 at the Wayback Machine Israeli CBS 2011 data
  52. "UNRWA: Palestine refugees". United Nations. Archived from the original on 17 December 2007. Retrieved 1 June 2010.
  53. Middle East Christians: Gaza pastor BBC News, 21 December 2005