Comparison of humans living today with all previous generations
This article lists current estimates of the world population in history. In summary, estimates for the progression of world population since the Late Middle Ages are in the following ranges:
Estimates for pre-modern times are necessarily fraught with great uncertainties, and few of the published estimates have confidence intervals; in the absence of a straightforward means to assess the error of such estimates, a rough idea of expert consensus can be gained by comparing the values given in independent publications. Population estimates cannot be considered accurate to more than two decimal digits; for example, the world population for the year2012 was estimated at 7.02, 7.06, and 7.08billion by the United States Census Bureau, the Population Reference Bureau, and the United Nations Department of Economic and Social Affairs, respectively, corresponding to a spread of estimates of the order of 0.8%.
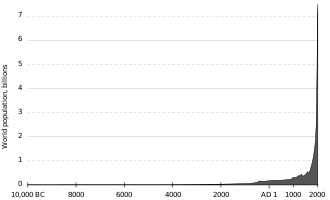
Graph of world population over the past 12,000years (Holocene)
As a general rule, the confidence of estimates on historical world population decreases for the more distant past. Robust population data exist only for the last two or three centuries. Until the late 18thcentury, few governments had ever performed an accurate census. In many early attempts, such as in Ancient Egypt and the Persian Empire, the focus was on counting merely a subset of the population for purposes of taxation or military service.[2] Published estimates for the 1stcentury ("AD1") suggest uncertainty of the order of 50% (estimates range between 150 and 330million). Some estimates extend their timeline into deep prehistory, to "10,000BCE", i.e., the early Holocene, when world population estimates range roughly between 1 and 10million (with an uncertainty of up to an order of magnitude).[3][4]
Estimates for yet deeper prehistory, into the Paleolithic, are of a different nature. At this time, human populations consisted entirely of non-sedentary hunter-gatherer populations, with anatomically modern humans existing alongside archaic human varieties, some of which are still ancestral to the modern human population due to interbreeding with modern humans during the Upper Paleolithic. Estimates of the size of these populations are a topic of paleoanthropology. A late human population bottleneck is postulated by some scholars at approximately 70,000years ago, during the Toba catastrophe, when Homo sapiens population may have dropped to as low as between 1,000 and 10,000individuals.[5][6] For the time of speciation of Homo sapiens, some 200,000years ago, an effective population size of the order of 10,000 to 30,000individuals has been estimated, with an actual "census population" of early Homo sapiens of roughly 100,000 to 300,000individuals.[7]
Estimates regarding the questions of "how many people have ever lived?" or "what percentage of people who have ever lived are alive today?" can be traced to the 1970s.[8] The more dramatic phrasing of "the living outnumber the dead" also dates to the 1970s, a time of population explosion and growing fears of human overpopulation in the wake of decolonization and before the adoption of China's one-child policy. The claim that "the living outnumber the dead" was never accurate. Arthur C. Clarke in 2001: A Space Odyssey (1968) has the claim that "Behind every man now alive stand 30ghosts, for that is the ratio by which the dead outnumber the living", which was roughly accurate at the time of writing.[9][10]
Recent estimates of the "total number of people who have ever lived" are in the order of 100billion.[10][11] The answer depends on the definition of "people", i.e., whether only Homo sapiens are to be counted, or all of the genus Homo; due to the small population sizes in the Lower Paleolithic, however, the order of magnitude of the estimate is not affected by the choice of cut-off date substantially more than by the uncertainty of estimates throughout the Neolithic to Iron Age.[12] Importantly, the estimate is also affected by the estimate of infant mortalities vs. stillborn infants, due to the very high rate of infant mortality throughout the pre-modern period. An estimate on the "total number of people who have ever lived" as of 1995 was calculated by Haub (1995) at "about 105billion births since the dawn of the human race" with a cut-off date at 50,000BC (beginning of the Upper Paleolithic), and inclusion of a high infant mortality rate throughout pre-modern history.[13]
Historical population
Before 1950
The following table uses astronomical year numbering for dates, negative numbers corresponding roughly to the corresponding year BCE (strictly speaking, for example, −8,000 = 8,001 BCE, etc.). The table starts counting approximately 10,000 years before present, or around 8,000 BCE, during the middle Greenlandian, about 1,700 years after the end of the Younger Dryas and 1,800 years before the 8.2-kiloyear event.
From the beginning of the early modern period until the 20thcentury, world population has been characterized by a rapid growth. For the period of Classical antiquity to the Middle Ages, roughly 500BCE to CE1500, there was also a general tendency of growth (estimated at a factor 4 to 5 over the 2,000-year period), but not strictly monotonic: A noticeable dip in world population is assumed due to the Black Death in the mid-14thcentury.[14]
After World War II, demographic data of some accuracy becomes available for a significant number of countries, and population estimates are often given as grand totals of numbers (typically given by country) of widely diverging accuracies. Some sources give these numbers rounded to the nearest million or the nearest thousand, while others give them without any rounding.
Taking these numbers at face value would be false precision; in spite of being stated to four, seven, or even ten digits, they should not be interpreted as accurate to more than three digits at best (estimates by the United States Census Bureau and by the United Nations differ by about 0.5–1.5%).
UN estimates (as of 2017) for world population by continent in 2000 and in 2050 (pie chart size to scale) AsiaAfricaEuropeCentral/South AmericaNorth AmericaOceania
The regional makeup of the world's has changed dramatically in the past two thousand years. In 1 CE, population in Asia was more than 4 times the European population,[18] and the combined population of Sub-Saharan Africa and Latin America totaled roughly 6 percent of the world's population. The total population of the "Western Offshoots"--the former British colonies of Canada, Australia, New Zealand, and the United States--made up less than 0.5% of the total. The distribution of population by region in 2022 looks very different: Latin America and Sub-Saharan Africa are home to nearly a quarter of the people in the world, and more than 5% live in the four "Western Offshoots" nations.
The rate of growth of the world's population changed dramatically as well, rising more than a hundred-fold from an average population growth of less than a tenth of a percent per year from 1-1000 CE to 1.9% average annual growth between 1950 and 1975. Growth has slowed substantially in the years since, averaging 1.1% annual growth between 2000 and 2022.
Population estimates by region, 1-2022 CE[17][18][19]
The historical population for many countries in the world is difficult to estimate before the past several hundred years due to incomplete recordkeeping or insufficient archaeological evidence. However, the Maddison Project has been able to estimate the populations of 43 countries back to 1 CE. They show that the two countries with the largest populations in 2022, India and China, were also the world's most populous countries more than two thousand years ago. Western European populations generally grew slowly until the late 18th century, when the Industrial Revolution caused both standards of living and populations to rise rapidly.
Population estimates, selected countries (in millions), by region, 1–2022 CE [19][32]
Country/Region
1
1000
1500
1600
1700
1820
1870
1900
1950
1975
2000
2022
East Asia
China
59.6M
59.0M
103.0M
160.0M
138.0M
381.0M
358.0M
400.0M
546.8M
916.4M
1,258.7M
1,401.7M
Japan
3.0M
7.5M
15.4M
18.5M
27.0M
31.0M
34.4M
44.1M
83.8M
111.6M
126.8M
124.8M
Eastern Europe
Albania
0.2M
0.2M
0.2M
0.2M
0.3M
0.4M
0.6M
0.8M
1.2M
2.4M
3.1M
2.8M
Bulgaria
0.5M
0.8M
0.8M
1.3M
1.3M
2.2M
2.6M
4.0M
7.3M
8.7M
8.1M
6.7M
Czechoslovakia (former)
1.0M
1.3M
3.0M
4.5M
4.5M
7.7M
10.2M
12.1M
12.4M
14.8M
15.6M
16.1M
Hungary
0.3M
0.5M
1.3M
1.3M
1.5M
4.1M
5.9M
7.1M
9.3M
10.5M
10.2M
9.7M
Poland
0.5M
1.2M
4.0M
5.0M
6.0M
10.4M
16.9M
24.8M
24.8M
34.0M
38.3M
37.9M
Romania
0.8M
0.8M
2.0M
2.0M
2.5M
6.4M
9.2M
11.0M
16.3M
21.2M
22.3M
19.3M
USSR (former)
3.9M
7.1M
17.0M
20.7M
26.6M
54.8M
88.7M
124.5M
179.6M
254.5M
288.7M
294.4M
Yugoslavia (former)
1.5M
1.8M
2.3M
2.8M
2.8M
5.2M
8.3M
11.2M
16.3M
20.7M
22.5M
20.9M
Latin America
Mexico
2.2M
4.5M
7.5M
2.5M
4.5M
6.6M
9.2M
13.6M
28.5M
60.7M
98.4M
125.2M
Middle East and North Africa
Algeria
2.0M
2.0M
1.5M
2.3M
1.8M
2.7M
3.8M
5.5M
8.9M
16.1M
30.5M
44.1M
Egypt
4.5M
5.0M
4.0M
5.0M
4.5M
4.2M
7.1M
12.1M
21.2M
37.0M
67.4M
110.6M
Iran
4.0M
4.5M
4.0M
5.0M
5.0M
6.6M
8.4M
11.0M
16.4M
33.3M
65.4M
85.1M
Iraq
1.0M
2.0M
1.0M
1.3M
1.0M
1.1M
1.6M
2.6M
5.2M
11.1M
22.7M
40.4M
Libya
0.4M
0.5M
0.5M
0.5M
0.5M
0.5M
1.0M
2.6M
5.1M
7.2M
Morocco
1.0M
2.0M
1.5M
2.3M
1.8M
2.7M
3.8M
5.1M
9.3M
17.7M
28.7M
37.1M
Tunisia
0.8M
1.0M
0.8M
1.0M
0.8M
0.9M
1.2M
1.9M
3.5M
5.7M
9.5M
11.9M
Turkey
8.0M
7.0M
6.3M
7.9M
8.4M
10.1M
11.8M
15.0M
21.1M
40.5M
65.9M
87.2M
South and South East Asia
India
75.0M
75.0M
110.0M
135.0M
165.0M
209.0M
253.0M
284.5M
359.0M
607.0M
1,018.7M
1,349.1M
Indonesia
2.8M
5.2M
10.7M
11.7M
13.1M
17.9M
32.7M
45.1M
82.6M
131.2M
211.4M
273.4M
Sub-Saharan Africa
Ethiopia
0.5M
1.0M
2.0M
2.3M
2.5M
3.2M
20.6M
33.8M
65.2M
117.9M
Mozambique
0.1M
0.3M
1.0M
1.3M
1.5M
2.1M
6.3M
10.4M
16.8M
28.9M
South Africa
0.1M
0.3M
0.6M
0.7M
1.0M
1.6M
2.5M
6.2M
13.6M
25.8M
47.0M
63.4M
Sudan (former)
2.0M
3.0M
4.0M
4.2M
4.4M
5.2M
6.3M
12.5M
26.8M
46.5M
Western Europe
Austria
0.5M
0.7M
2.0M
2.5M
2.5M
3.4M
4.5M
6.0M
6.9M
7.6M
8.1M
9.1M
Belgium
0.3M
0.4M
1.4M
1.6M
2.0M
3.4M
5.1M
6.7M
8.6M
9.8M
10.3M
11.7M
Denmark
0.2M
0.4M
0.6M
0.7M
0.7M
1.2M
1.9M
2.6M
4.3M
5.1M
5.4M
5.9M
Finland
0.0M
0.0M
0.3M
0.4M
0.4M
1.2M
1.8M
2.6M
4.0M
5.2M
5.6M
5.2M
France
5.0M
6.5M
15.0M
18.5M
21.5M
31.3M
38.4M
40.6M
42.5M
54.0M
60.8M
68.3M
Germany
3.0M
3.5M
12.0M
16.0M
15.0M
24.9M
39.2M
54.4M
68.4M
78.7M
81.5M
83.8M
Greece
2.0M
1.0M
1.0M
1.5M
1.5M
2.3M
3.7M
5.0M
7.6M
9.1M
10.7M
10.4M
Italy
8.0M
5.0M
10.5M
13.1M
13.3M
20.2M
27.9M
33.7M
47.1M
55.6M
57.0M
59.0M
Netherlands
0.2M
0.3M
1.0M
1.5M
1.9M
2.3M
3.6M
5.1M
10.1M
13.7M
15.9M
17.7M
Norway
0.1M
0.2M
0.3M
0.4M
0.5M
1.0M
1.7M
2.2M
3.3M
4.0M
4.5M
5.5M
Portugal
0.4M
0.6M
1.0M
1.1M
2.0M
3.3M
4.3M
5.4M
8.4M
9.4M
10.2M
10.2M
Spain
3.8M
4.0M
6.8M
8.2M
8.8M
12.2M
16.2M
18.6M
28.1M
35.6M
40.6M
57.6M
Sweden
0.2M
0.4M
0.6M
0.8M
1.3M
2.5M
4.2M
5.1M
7.0M
8.2M
8.9M
10.5M
Switzerland
0.3M
0.3M
0.7M
1.0M
1.2M
2.0M
2.7M
3.3M
4.7M
6.4M
7.3M
8.8M
United Kingdom
0.8M
2.0M
3.9M
6.2M
8.6M
21.2M
31.4M
41.2M
50.1M
56.2M
59.2M
68.1M
Western Offshoots
Australia
0.4M
0.4M
0.5M
0.5M
0.5M
0.3M
1.8M
3.7M
8.3M
13.8M
18.9M
25.8M
Canada
0.1M
0.2M
0.3M
0.3M
0.2M
0.8M
3.8M
5.5M
14.0M
23.2M
30.8M
38.7M
United States
0.7M
1.3M
2.0M
1.5M
1.0M
10.0M
40.2M
76.3M
152.3M
216.0M
282.2M
333.3M
References
↑range of estimates for average growth rates over the preceding century according to the data cited under #Historical population; The average growth rate for the 14th century is low as a consequence of the Black Death.
↑Kurt, A. (1995). The Ancient Near East, c. 3000–330 BCE. Vol. 2. London: Routledge. p. 695.
↑Per Sjödin, Agnès E Sjöstrand, Mattias Jakobsson and Michael G B Blum, "Resequencing data provide no evidence for a human bottleneck in Africa during the penultimate glacial period" Mol Biol Evol (2012) DOI: 10.1093/molbev/mss061. "A small human effective population size, on the order of 10,000 individuals, which is smaller than the effective population size of most great apes, has been interpreted as a result of a very long history, starting ~ 2 mya, of small population size, coined as the long-necked bottle model (Harpending et al. 1998; Hawks et al. 2000). Our findings are consistent with this hypothesis, but, depending on the mutation rate, we find either an effective population size of NA = 12,000 (95% C.I. = 9,000–15,500 when averaging over all three demographic models) using the mutation rate calibrated with the human-chimp divergence or an effective population size of NA = 32,500 individuals (95% C.I. = 27,500–34,500) using the mutation rate given by whole-genome trio analysis (The 1000 Genomes Project Consortium 2010) (supplementary figure 4 and table 6, Supplementary Material online). Not surprisingly, the estimated effective mutation rates θ = 4NAμ are comparable for the two mutation rates we considered, and are equal to 1.4 × 10⁻³/bp/generation (95% C.I. = (1.1–1.7) × 10−3). Relating the estimated effective population size to the census population size during the Pleistocene is a difficult task because there are many factors affecting the effective population size (Charlesworth 2009). Nevertheless, based on published estimates of the ratio between effective and census population size, a comprehensive value on the order of 10% has been found by Frankham (1995). This 10% rule roughly predicts that 120,000−325,[0]00 individuals (depending on the assumed mutation rate)"
↑Haub (1995): "at some time back in the 1970s, some now-forgotten writer made the statement that 75 percent of the people who had ever been born were alive at that moment." Haub (1995) is the basis of a 2007 article in Scientific American, "Fact or Fiction". Scientificamerican.com.
↑Kapitza, 'The phenomenological theory of world population growth', Physics-Uspekhi 39(1) 57–71 (1996) cites estimates ranging between 80 and 150 billion (Sergei P Kapitza, 'The phenomenological theory of world population growth', Physics-Uspekhi 39(1) 57–71, 1996), citing K. M. Weiss, Human Biology 56637, 1984, and N. Keyfitz, Applied Mathematical Demography, New York: Wiley, 1977). Haub (1995) cited 105 billion, updated to 107 billion as of 2011 in Haub, Carl (October 2011). "How Many People Have Ever Lived on Earth?". Population Reference Bureau. Archived from the original on April 24, 2013. Retrieved April 29, 2013.
↑Haub (1995): "Clearly, the period 8000 B.C. to 1 A.D. is key to the magnitude of our number, but, unfortunately, little is known about that era. ... of course, pushing the date of humanity's arrival on the planet before 50,000 B.C. would also raise the number, although perhaps not by terribly much."
↑Haub (1995): "Life expectancy at birth probably averaged only about 10 years for most of human history. Estimates of average life expectancy in Iron Age France have been put at only 10 or 12 years. Under these conditions, the birth rate would have to be about 80 per 1,000 people just for the species to survive. ... Our birth rate assumption will greatly affect the estimate of the number of persons ever born. Infant mortality in the human race's earliest days is thought to have been very high—perhaps 500 infant deaths per 1,000 births, or even higher. ... Birth rates were set at 80 per 1,000 per year through 1 A.D. and at 60 per 1,000 from 2 A.D. to 1750. Rates then declined to the low 30s by the modern period. (For a brief bibliography of sources consulted in the course of this alchemy, see [Colin McEvedy and Richard Jones 1978])." "So, our estimate here is that about 5.5 percent of all people ever born are alive today." Using the UN estimates for birth rates ( "UNdata: Crude birth rate". United Nations. 25 August 2011.) and world population (U.S. Census Bureau, International Data Base), there were an estimated 3.0 billion births during 1995–2016, so that based on the estimate by Haub (1995), the figures for 2017 would be "about 108 billion births" and "about 7 percent of all people ever born are alive today."
12Haub (1995): "The average annual rate of growth was actually lower from 1 A.D. to 1650 than the rate suggested above for the 8000 B.C. to 1 A.D. period. One reason for this abnormally slow growth was the Black Plague. This dreaded scourge was not limited to 14th century Europe. The epidemic may have begun about 542 A.D. in Western Asia, spreading from there. It is believed that half the Byzantine Empire was destroyed in the 6th century, a total of 100 million deaths."
12These tables use data from the most recent Maddison database (2023) for estimates for 1820-2022, but because the most recent database does not contain estimates for world population or sub-saharan african population before 1820, the most recent Maddison database containing those estimates--the last database compliled by Angus Maddison in 2010--are used in their place.
↑Klein Goldewijk, K., A. Beusen, M. de Vos and G. van Drecht (2011). The HYDE 3.1 spatially explicit database of human induced land use change over the past 12,000 years, Global Ecology and Biogeography20(1): 73-86. doi:10.1111/j.1466-8238.2010.00587.x (pbl.nlArchived 2021-04-23 at the Wayback Machine ). HYDE (History Database of the Global Environment), 2010. HYDE 3.1 gives estimates for 5000 BC, 1000 BC and "AD 0". HYDE estimates are higher than those by Colin McEvedy (1978) but lower than those by Massimo Livi Bacci (1989, 2012). (graphs (itbulk.org)).
12Slightly updated data from original paper in French: (a) Jean-Noël Biraben, 1980, "An Essay Concerning Mankind's Evolution", Population, Selected Papers, Vol. 4, pp. 1–13. Original paper in French: (b) Jean-Noël Biraben, 1979, "Essai sur l'évolution du nombre des hommes", Population, Vol. 34 (no. 1), pp. 13–25.
12Colin McEvedy and Richard Jones, 1978, Atlas of World Population History, Facts on File, New York, ISBN0-7139-1031-3.
12Ralph Thomlinson, 1975, Demographic Problems: Controversy over population control, 2nd Ed., Dickenson Publishing Company, Ecino, CA, ISBN0-8221-0166-1.
12John D. Durand, 1974, "Historical Estimates of World Population: An Evaluation", University of Pennsylvania, Population Center, Analytical and Technical Reports, Number 10.
12Colin Clark, 1967, Population Growth and Land Use, St. Martin's Press, New York, ISBN0-333-01126-0.
1234567891011Data from History Database of the Global Environment.Archived 2018-02-27 at the Wayback Machine K. Klein Goldewijk, A. Beusen and P. Janssen, "HYDE 3.1: Long-term dynamic modeling of global population and built-up area in a spatially explicit way", from table on pg. 2, Netherlands Environmental Assessment Agency (MNP), Bilthoven, The Netherlands.
↑Haub (1995): "By 1 A.D., the world may have held about 300 million people. One estimate of the population of the Roman Empire, from Spain to Asia Minor, in 14 A.D. is 45 million. However, other historians set the figure twice as high, suggesting how imprecise population estimates of early historical periods can be."
↑1913 data were used in place of missing 1900 data for the following countries: Algeria, Egypt, Iran, Iraq, Morocco, South Africa, Tunisia, and Turkey.
This page is based on this Wikipedia article Text is available under the CC BY-SA 4.0 license; additional terms may apply. Images, videos and audio are available under their respective licenses.