This article is missing information about LGBT demographics in the U.S. territories. Please expand the article to include this information. Further details may exist on the talk page.(September 2019)
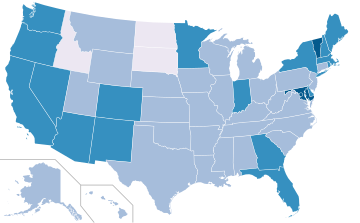
LGBT adult percentage by state in 2015–2016:
< 2%
2-2.9%
3-3.9%
> 4%
The demographics of sexual orientation and gender identity in the United States have been studied in the social sciences in recent decades. A 2022 Gallup poll concluded that 7.1% of adult Americans identified as LGBT.[1] A different survey in 2016, from the Williams Institute, estimated that 0.6% of U.S. adults identify as transgender.[2] As of 2022, estimates for the total percentage of U.S. adults that are transgender or nonbinary range from 0.5% to 1.6%.[3][4] Additionally, a Pew Research survey from 2022 found that approximately 5% of young adults in the U.S. say their gender is different from their sex assigned at birth.[5]
Studies from several nations, including the U.S., conducted at varying time periods, have produced a statistical range of 1.2[6] to 6.8[7] percent of the adult population identifying as LGBT. Online surveys tend to yield higher figures than other methods,[7] a likely result of the higher degree of anonymity of Internet surveys, and demographic of those utilizing online platforms which elicit reduced levels of socially desirable responding.[8]As of 2010[update] the U.S. Census Bureau did not ask singles about sexual orientation in the United States Census.[9] In the 2020 United States census, same-sex married couples accounted for 0.5% of all U.S. households and unmarried same-sex couples accounted for 0.4% of all U.S. households.[10]
Adult population: 238,574,670 (76% of total population; 2010 US Census)
9,083,558
594,391
646,464
8.76%
0.58%
By locality
Parts of this article (those related to documentation) need to be updated. Please help update this article to reflect recent events or newly available information.(September 2015)
The American cities with the highest gay populations are New York City with 272,493, Los Angeles with 154,270, Chicago with 114,449, and San Francisco with 94,234, as estimated by the Williams Institute in 2006.[15] However, gay residents are much more likely to be encountered in San Francisco, Seattle, Atlanta, Minneapolis, and Boston because a higher percentage of those cities' residents are gay or lesbian.
The U.S. metropolitan areas with the most gay residents are the New York, New York–Northern New Jersey–Long Island, New York metro with 568,903; followed by Los Angeles–Long Beach–Santa Ana, California with 442,211; and the Chicago-Naperville-Joliet, Illinois-Indiana-Wisconsin metro with 288,748.[16]
The charts list the top U.S. cities (in alphabetical order), metropolitan areas, and states with the highest population of gay residents and the highest percentage of gay residents (GLB population as a percentage of total residents based on available census data).[15] The numbers given are estimates based on American Community Survey data for the year 2006.[17]
By city
Cities with the highest percentage of LGB people in 2006.
"Homosexuality/Heterosexuality: Concepts of Sexual Orientation" published findings of 13.95% of males and 4.25% of females having had either "extensive" or "more than incidental" homosexual experience.[21]
1990
An extensive study on sexuality in general was conducted in the United States. A significant portion of the study was geared towards homosexuality. The results found that 8.6% of women and 10.1% of men had at one point in their life experienced some form of homosexuality. Of this group, 87% of women and 76% of men reported current same-sex attractions, 41% of women and 52% of men had sex with someone of the same gender, and 16% of women and 27% of men identified as LGBT.[22]
1990–1992
The American National Health Interview Survey conducts household interviews of the civilian non-institutionalized population. The results of three of these surveys, done in 1990–91 and based on over 9,000 responses each time, found between 2% and 3% of the people responding said yes to a set of statements which included "You are a man who has had sex with another man at some time since 1977, even one time."[23]
1992
The National Health and Social Life Survey asked 3,432 respondents whether they had any homosexual experience. The findings were 1.3% for women within the past year, and 4.1% since 18 years; for men, 2.7% within the past year, and 4.9% since 18 years.[24]
1993
The Alan Guttmacher Institute of sexually active men aged 20–39 found that 2.3% had experienced same-sex sexual activity in the last ten years, and 1.1% reported exclusive homosexual contact during that time.[25]
1993
Researchers Samuel and Cynthia Janus surveyed American adults aged 18 and over by distributing 4,550 questionnaires; 3,260 were returned and 2,765 were usable. The results of the cross-sectional (not random) nationwide survey stated 9% of men and 5% of women reported having had homosexual experiences "frequently" or "ongoing". In another measure, 4% of men and 2% of women self-identified as homosexual.[26][27]
1994
Laumann et al. analyzed the National Health and Social Life Survey of 1992 which had surveyed 3,432 men and women in the United States between the ages of 18 and 59 and reported that the incidence rate of homosexual desire was 7.7% for men and 7.5% for women.[28]
1998
A random survey of 1672 males (number used for analysis) aged 15 to 19. Subjects were asked a number of questions, including questions relating to same-sex activity. This was done using two methods—a pencil and paper method, and via computer, supplemented by a verbal rendition of the questionnaire heard through headphones—which obtained vastly different results. There was a 400% increase in males reporting same-sex sexual activity when the computer-audio system was used: from a 1.5% to 5.5% positive response rate; the homosexual behavior with the greatest reporting difference (800%, adjusted) was to the question "Ever had receptive anal sex with another male": 0.1% to 0.8%.[29]
2000s
2000
During the 2000 US presidential election campaign, market research firm Harris Interactive studied the prevalence of a gay, lesbian, bisexual or transgender identity employing three distinct methods. In phone interviews, 2% of the population self-identified as LGBT. Using in-person surveys with a blind envelope, that grew to 4%, and using online polls 6%. The group concluded that the difference between methods was due to the greater level of anonymity and privacy to online surveys, which provides more comfort to respondents to share their experiences.[30]
2003
Smith's 2003 analysis of National Opinion Research Center data[31] states that 4.9% of sexually active American males have had a male sexual partner since age 18, but that "since age 18 less than 1% are [exclusively] gay and 4+% bisexual". In the top twelve urban areas however, the rates are double the national average. Smith adds, "It is generally believed that including adolescent behavior would further increase these rates." The NORC data has been criticised because the original design sampling techniques were not followed, and depended upon direct self-report regarding masturbation and same sex behaviors. (For example, the original data in the early 1990s reported that approximately 40% of adult males had never masturbated—a finding inconsistent with some other studies.)[citation needed]
2003
In a telephone survey of 4,193 male residents of New York City, 91.3% of men identified as straight, 3.7% as gay, and 1.2% as bisexual. 1.7% said they were in doubt or were not sure and 2.1% declined to answer. 12.4% of men who responded to the sexual orientation question, reported sex exclusively with men in the 12 months prior to the survey. Most of them (c. 70%) identified as heterosexual.[32]
2005
The American Community Survey from the U.S. Census estimated 776,943 same-sex couples in the country as a whole, representing about 0.5% of the population.[15]
2006
Fried's 2008 analysis of General Social Survey data shows the percentage of United States males reporting homosexual activity for three time periods: 1988–1992, 1993–1998, and 2000–2006. These results are broken out by political party self-identification, and indicate increasing percentages, particularly among Democrats (perhaps reflecting, in the authors' view, either a shift of political allegiance among gay Americans, or increasing likelihood of acknowledging a homosexual orientation).[33]
2007
Cornell University, carrying out research into sexuality amongst a representative sample of more than 20,000 young Americans, published that 14.4% of young women were not strictly heterosexual in behavior, a group that included lesbian and bisexual women; 5.6% of young men self-identified as being gay or bisexual.[34]
2008
National Election Pool's exit polling showed self-identified gay, lesbian, and bisexual voters at 4% of the voting population in the 2008 United States presidential election.[35]
2010s
2000–2010
The National Health and Nutrition Examination Surveys interviewed a nationally representative sample of 11,744 adults aged 20 to 59 between 2003 and 2010. One hundred and eighty (1.5%) self-reported a homosexual orientation and 273 (2.3%) a bisexual one.[36]
2010
The National Survey of Sexual Health and Behavior surveyed nearly 6,000 people nationwide between the ages of 14 and 94 through an online methodology and found that 7% of women and 8% of men identify as gay, lesbian or bisexual.[37]
2010
Using a phone methodology, the National Intimate Partner and Sexual Violence Survey found, in a sample of about 10,000 women and 8,000 men, that 1.3% of women and 2% of men identify as gay or lesbian, and 1.2% of men and 2.2% of women identify as bisexual.[38]
2011
A 2011 UCLA School of Law Williams Institute survey found that 3.5% of Americans, estimated, identified themselves as lesbian, gay, or bisexual. The same survey found that an estimated .3% of adult Americans identified themselves as transgender.[39]
2012
A Gallup report published in October 2012 by the Williams Institute reported that 3.4% of US adults identify as lesbian, gay, bisexual or transgender. Minorities were more likely to identify as non-heterosexual; 4.6% of blacks, 4.0% of Hispanics and 3.2% of whites. Younger people, aged 18–29, were three times more likely to identify as LGBT than seniors over the age of 65, the numbers being 6.4% and 1.9%, respectively.[6][40]
In the first large-scale government survey measuring Americans' sexual orientation, the NHIS reported in July 2014 that 1.6% of Americans identify as gay or lesbian, and 0.7% identify as bisexual.[43] 1.5% of women self-identify as lesbian and 0.9% consider themselves bisexual, while 1.8% of men consider themselves gay and 0.4% identify as bisexual.[43]
2002–2013 National Survey of Family Growth
The National Survey of Family Growth is a nationally representative, multi-year survey of teenagers and adults aged 15–44. The sexual orientation items are presented only to interviewees over age 18. Results are presented separately for women and men.
In an experiment, the National Bureau of Economic Research concluded that the share of the population that is non-heterosexual has been significantly underestimated in surveys using traditional questioning methods, even if anonymous. In this study, it was found that, in all three facets of sexual orientation (identity, attraction, and behavior), the percentage of individuals who recognized themselves as non-heterosexual was larger when the survey method in use was the item randomized response, known to reduce socially desirable responding, in lieu of questions with direct responses. However, because the study was based on online volunteer samples and was therefore not nationally representative, researchers make no suggestion as to the real size of the LGBT population.[47][48]
2013
Writing in the opinion section of The New York Times in 2013, Seth Stephens-Davidowitz estimated that roughly 5% of American men are "primarily attracted to men". First, using Facebook data and Galluppoll results, he correlated the percentage of men who are openly gay with their state of birth and residence. Second, he measured what percentage of Google pornographic searches were for gay porn. The first method gave between 1% and 3%. The second showed that roughly 5% of men search for gay porn in every state. The figure was slightly higher in states considered gay-tolerant than in others.[49]
2014
According to the 2014 General Social Survey behavior study, the percentage of Americans that have had a same-sex sexual partner has steadily increased since the early 1990s. In the 1989-1994 period, 4.53% of men and 3.61% of women self-reported sex with women ever, which grew to 8.18% of men and 8.74% of women in the 2010-2014 period. The augmentation is mainly due to those who self-report sex with both genders; among those who have only had sex with the same gender, no clear pattern of increase emerged throughout the periods analyzed.[50]
2014
In a nationally representative telephone survey of 35,071 Americans, Pew Research found that 1,604, or 4.6%, of the sample identified as gay, lesbian or bisexual, and 32,439 (or 92.4%) as heterosexual, with the remainder refusing or being unable to provide an answer, or identifying as something else.[51]
2015
In a nationally representative survey of 2,021 Americans carried out by Indiana University, it was found that 89.8% of men and 92.2% of women identify as heterosexual, 1.9% of men and 3.6% of women as bisexual, 5.8% of men and 1.5% of women consider themselves gay or lesbian, 0.5% of men and 1.3% of women identify as asexual, and 0.7% of men and 0.9% of women as other.[52]
2015
The Public Religion Research Institute (PRRI) survey of 2,314 millennials found that 88% identified as heterosexual, 4% as bisexual, 2% as gay, and 1% as lesbian. In a separate question, 1% identified as transgender. In total, 7% of millennials identified as LGBT. Three percent refused to identify their sexual orientation. The unaffiliated were more likely to identify as LGBT than the religious, as were Democratic-leaning millennials compared to the Republican-leaning. No differences were found along racial lines.[53]
2015
In a YouGov survey of 1,000 adults, 2% of the sample identified as gay male, 2% as gay female, 4% as bisexual (of either sex), and 89% as heterosexual.[54]
In National Election Pool's exit poll of over 24,500 Election Day voters, 5% identified as LGBT.[57]
2016
Gallup's daily tracking phone survey found that the proportion of Americans who identify as LGBT in 2016 was 4.1% – which represents growth over the 3.6% registered when the question started being asked in 2012. Growth was highest among women, millennials, the non-religious, Hispanics, and Asians, and happened across income and educational categories. Among the religious, and older generations than millennials, the share of those self-identifying as LGBT remained stable or varied negatively.[58]
2016
A female-only survey found that 7% of American women identify as gay or bisexual.[59]
2016
According to a national survey organized by the Gay & Lesbian Alliance Against Defamation and Harris Poll, 12% of the US adult population is either a sexual minority (i.e., gay, lesbian, bisexual, asexual or pansexual) or identifies as something other than cisgender. This proportion was highest among millennials (20%) and decreased with age, reaching 5% among those who were aged 72 or more.[60]
2016–2017
The Public Religion Research Institute (PRRI) conducted a survey of over 100,000 U.S. residents from January 2016 to January 2017 asking, among a variety of attitude and demographic questions, whether or not they consider themselves LGBT. 4.4% of respondents answered affirmatively to that question, and 90.4% responded negatively. The remainder 5.3% did not know or refused to answer.[61]
2017
In a nationally representative survey organized by Kantar TNS, 87% of American men aged 18 to 30 years identified as heterosexual, 7% as homosexual, 4% as bisexual, and 1% as other.[62]
2019
The 2019 American Values Atlas by the Public Religion Research Institute found that of all Americans that identify as LGBT, 51% were White Americans while 21% were Hispanic Americans and 13% were African Americans. The same study found that 23% of LGBT Americans identify as Protestant while 13% identify as Catholic.[63]
2020s
2021
A February 2021 Gallup poll reported that 5.6% of US adults identify as lesbian, gay, bisexual, or transgender. 86.7% said that they were heterosexual or straight, and 7.6% refused to answer. More than half of all LGBT adults identify as bisexual (54.6%), while around a quarter (24.5%) identify as gay, 11.7% as lesbian, and 11.3% as transgender. Additionally, 3.3% of respondents chose another term to describe their orientation (e.g. queer). As a percentage of all US adults, 3.1% identify as bisexual, 1.4% as gay, 0.7% as lesbian, and 0.6% as transgender.[64]
According to a 2021 report from the Human Rights Campaign (HRC), "at least 20 million adults in the United States could be lesbian, gay, bisexual or transgender people." and "Millions more could be another identity that is more expansive than these four terms."[65][66] Others have estimated that there may be up to 30 million Americans who identify as lesbian, gay, bisexual, or transgender.[67] A study found that 16 to 20 percent of Americans have experienced same sex attraction[68] and some scholars have claimed that the population of Americans who have experienced same sex attraction reached fifty million.[69]
In 2021, 8% of respondents to the United States Census Bureau's Household Pulse Survey identified as LGBTQ, with an additional 2% of respondents having identified as neither gay, lesbian, bisexual, or straight. The Household Pulse Survey also indicated that more than 1% of adults in the United States could identify as transgender, with an additional 2% of respondents having identified as neither cisgender or transgender. This was the first time the U.S. Census Bureau asked about sexual identity and gender identity in a survey.[66]
A 2021 global pride survey by Ipsos, a multinational market research company, found that the percentage of those who identify as transgender, nonbinary, nonconforming, genderfluid, or as something other than male or female, was statistically significantly higher in the Generation Z (those born since 1997) population, at 4%, compared to the 1% of all other adults.[70] The statistic is estimated to be the same in the United States as it is globally. The Census Bureau found that there were 1.2 million same sex couple households in the United States.[71]
2022
In February 2022 a Gallup poll reported that 7.1% of US adults identify as lesbian, gay, bisexual, or transgender. 34.6% of LGBT respondents were lesbian or gay, 56.8% were bisexual, 10.0% were transgender, and 4.3% identified as something else. LGBTQ+ identity was significantly higher among younger generations (20.8% of Generation Z and 10.5% of Millennials) than older generations (4.2% of Generation X, 2.6% of Baby Boomers, and 0.8% of those born before 1946).[1]
In June 2022, Pew Research published a survey finding that 1.6% of U.S. adults are transgender or nonbinary, and approximately 5% of young adults in the U.S. say their gender is different from their sex assigned at birth.[5][4]
In June 2022, the Williams Institute published a report with the following findings:
Over 1.6 million adults (ages 18 and older) and youth (ages 13 to 17) identify as transgender in the United States, or 0.6% of those ages 13 and older.[3]
Among U.S. adults, 0.5% (about 1.3 million adults) identify as transgender. Among youth ages 13 to 17 in the U.S., 1.4% (about 300,000 youth) identify as transgender.[3]
Of the 1.3 million adults who identify as transgender, 38.5% (515,200) are transgender women, 35.9% (480,000) are transgender men, and 25.6% (341,800) reported they are gender nonconforming.[3]
2023
A February 2023 Gallup poll reported that 7.2% of US adults identify as LGBT, 86% identified as straight or heterosexual, while 7% chose not to answer. 13.4% of LGBT respondents were lesbian, 20.2% gay, 58.2% bisexual, 8.8% transgender, and 6% as another LGBT identity (e.g., pansexual). LGBT identification was higher in younger generations (19.7% of Gen Z and 11.2% of Millennials) than in older generations (3.3% of Generation X, 2.7% of Baby Boomers, and 1.6% of the Silent Generation).[72]
↑ Peter J Aspinall (2009). Estimating the size and composition of the lesbian, gay, and bisexual population in Britain(PDF) (Report). p.13. The Ellison and Gunstone online survey (2009) for the Commission of over 5,000 people indicates that all methods involving interviewing in a person's home, whether face-to-face or by telephone, may incur misreporting, especially when another person is present. Respondents report that they would be least likely to conceal their sexual orientation (by switching to another sexual orientation category) when self-completion online surveys are used.
↑ Note: the study cited is unclear as to the exact metro NY area that is included; on table 5, page 8, "New York–Northern New Jersey–Long Island" is included, but in Appendix 2, page 15, Pennsylvania also seems to be included as it states "New York–Northern New Jersey–Long Island, New York–NJ–PA"
↑ McWhirter, David P., Sanders, Stephanie A., & Reinisch, June Machover (eds.). (1990). Homosexuality/Heterosexuality: Concepts of Sexual Orientation. The Kinsey Institute Series. New York: Oxford University Press.
↑ Billy, John O. G.; Tanfer, Koray; Grady, William R.; Klepinger, Daniel H. (1993). "The Sexual Behavior of Men in the United States". Family Planning Perspectives. 25 (2): 52–60. doi:10.2307/2136206. JSTOR2136206. PMID8491287.
↑ Janus, Samuel S. & Janus, Cynthia L. (1993). The Janus Report on Sexual Behavior. New York: John Wiley & Sons.
↑ Laumann, Edward O., Gagnon, John H., Michael, Robert T., and Michaels, Stuart (1994). The Social Organization of Sexuality: Sexual Practices in the United States. Chicago: University of Chicago Press, 297.
↑ Turner CF, Ku L, Rogers SM, Lindberg LD, Pleck JH, Sonenstein FL (May 1998). "Adolescent sexual behavior, drug use, and violence: increased reporting with computer survey technology". Science. 280 (5365): 867–73. Bibcode:1998Sci...280..867T. doi:10.1126/science.280.5365.867. PMID9572724.
↑ Anjani Chandra; etal. (2011). "Sexual Behavior, Sexual Attraction, and Sexual Identity in the United States: Data From the 2006–2008 National Survey of Family Growth". Natl Health Stat Report. Mar 3 (36): 1–36.
↑ Anjani Chandra; Casey E. Copen; William D. Mosher (2013). "Sexual Behavior, Sexual Attraction, and Sexual Identity in the United States: Data from the 2006–2010 National Survey of Family Growth". In Amanda K. Baumle (ed.). International Handbook on the Demography of Sexuality. Vol.5. Texas A&M University. ISBN978-94-007-5512-3.
↑ Copen CE; etal. (2016). "Sexual Behavior, Sexual Attraction, and Sexual Orientation Among Adults Aged 18–44 in the United States: Data From the 2011–2013 National Survey of Family Growth". Natl Health Stat Report. 2016 Jan 7 (88): 1–14.
Heterosexuality is romantic attraction, sexual attraction or sexual behavior between people of the opposite sex or gender. As a sexual orientation, heterosexuality is "an enduring pattern of emotional, romantic, and/or sexual attractions" to people of the opposite sex; it "also refers to a person's sense of identity based on those attractions, related behaviors, and membership in a community of others who share those attractions." Someone who is heterosexual is commonly referred to as straight.
Sexual orientation is an enduring personal pattern of romantic attraction or sexual attraction to persons of the opposite sex or gender, the same sex or gender, or to both sexes or more than one gender. Patterns are generally categorized under heterosexuality, homosexuality, and bisexuality, while asexuality is sometimes identified as the fourth category.
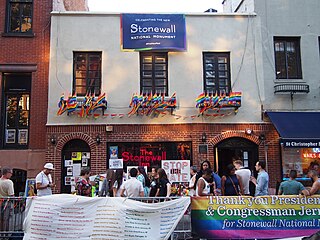
The LGBT community is a loosely defined grouping of lesbian, gay, bisexual, and transgender individuals united by a common culture and social movements. These communities generally celebrate pride, diversity, individuality, and sexuality. LGBT activists and sociologists see LGBT community-building as a counterweight to heterosexism, homophobia, biphobia, transphobia, sexualism, and conformist pressures that exist in the larger society. The term pride or sometimes gay pride expresses the LGBT community's identity and collective strength; pride parades provide both a prime example of the use and a demonstration of the general meaning of the term. The LGBT community is diverse in political affiliation. Not all people who are lesbian, gay, bisexual, or transgender consider themselves part of the LGBT community.
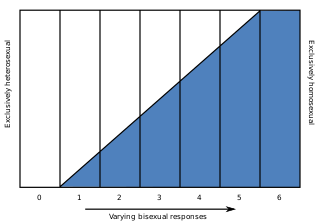
The Kinsey scale, also called the Heterosexual–Homosexual Rating Scale, is used in research to describe a person's sexual orientation based on one's experience or response at a given time. The scale typically ranges from 0, meaning exclusively heterosexual, to a 6, meaning exclusively homosexual. In both the male and female volumes of the Kinsey Reports, an additional grade, listed as "X", indicated "no socio-sexual contacts or reactions" (asexuality). The reports were first published in Sexual Behavior in the Human Male (1948) by Alfred Kinsey, Wardell Pomeroy, and others, and were also prominent in the complementary work Sexual Behavior in the Human Female (1953).
Biphobia is aversion toward bisexuality or people who are identified or perceived as being bisexual. Similarly to homophobia, it refers to hatred and prejudice specifically against those identified or perceived as being in the bisexual community. It can take the form of denial that bisexuality is a genuine sexual orientation, or of negative stereotypes about people who are bisexual. Other forms of biphobia include bisexual erasure.
The field of psychology has extensively studied homosexuality as a human sexual orientation. The American Psychiatric Association listed homosexuality in the DSM-I in 1952, but that classification came under scrutiny in research funded by the National Institute of Mental Health. That research and subsequent studies consistently failed to produce any empirical or scientific basis for regarding homosexuality as anything other than a natural and normal sexual orientation that is a healthy and positive expression of human sexuality. As a result of this scientific research, the American Psychiatric Association removed homosexuality from the DSM-II in 1973. Upon a thorough review of the scientific data, the American Psychological Association followed in 1975 and also called on all mental health professionals to take the lead in "removing the stigma of mental illness that has long been associated" with homosexuality. In 1993, the National Association of Social Workers adopted the same position as the American Psychiatric Association and the American Psychological Association, in recognition of scientific evidence. The World Health Organization, which listed homosexuality in the ICD-9 in 1977, removed homosexuality from the ICD-10 which was endorsed by the 43rd World Health Assembly on 17 May 1990.
Societal attitudes toward homosexuality vary greatly across different cultures and historical periods, as do attitudes toward sexual desire, activity and relationships in general. All cultures have their own values regarding appropriate and inappropriate sexuality; some sanction same-sex love and sexuality, while others may disapprove of such activities in part. As with heterosexual behaviour, different sets of prescriptions and proscriptions may be given to individuals according to their gender, age, social status or social class.
Heteroflexibility is a form of a sexual orientation or situational sexual behavior characterized by minimal homosexual activity in an otherwise primarily heterosexual orientation, which may or may not distinguish it from bisexuality. It has been characterized as "mostly straight". Although sometimes equated with bi-curiosity to describe a broad continuum of sexual orientation between heterosexuality and bisexuality, other authors distinguish heteroflexibility as lacking the "wish to experiment with ... sexuality" implied by the bi-curious label. The corresponding situation in which homosexual activity predominates has also been described, termed homoflexibility.
Obtaining precise numbers on the demographics of sexual orientation is difficult for a variety of reasons, including the nature of the research questions. Most of the studies on sexual orientation rely on self-reported data, which may pose challenges to researchers because of the subject matter's sensitivity. The studies tend to pose two sets of questions. One set examines self-report data of same-sex sexual experiences and attractions, while the other set examines self-report data of personal identification as homosexual or bisexual. Overall, fewer research subjects identify as homosexual or bisexual than report having had sexual experiences or attraction to a person of the same sex. Survey type, questions and survey setting may affect the respondents' answers.
Lesbian, gay, bisexual, transgender, and queer (LGBTQ) personnel are able to serve in the armed forces of some countries around the world: the vast majority of industrialized, Western countries including some South American countries such as Argentina and Chile in addition to South Africa, and Israel. The rights concerning intersex people are more vague.
Homosexuality is a sexual attraction, romantic attraction, or sexual behavior between members of the same sex or gender. As a sexual orientation, homosexuality is "an enduring pattern of emotional, romantic, and/or sexual attractions" exclusively to people of the same sex or gender. It "also refers to a person's sense of identity based on those attractions, related behaviors, and membership in a community of others who share those attractions."
Bisexual erasure, also called bisexual invisibility, is the tendency to ignore, remove, falsify, or re-explain evidence of bisexuality in history, academia, the news media, and other primary sources.
The questioning of one's sexual orientation, sexual identity, gender, or all three is a process of exploration by people who may be unsure, still exploring, or concerned about applying a social label to themselves for various reasons. The letter "Q" is sometimes added to the end of the acronym LGBT ; the "Q" can refer to either queer or questioning.
A same-sex relationship is a romantic or sexual relationship between people of the same sex. Same-sex marriage refers to the institutionalized recognition of such relationships in the form of a marriage; civil unions may exist in countries where same-sex marriage does not.
Various topics in medicine relate particularly to the health of lesbian, gay, bisexual, transgender, queer, intersex and asexual (LGBTQIA) individuals as well as other sexual and gender minorities. According to the US National LGBTQIA+ Health Education Center, these areas include sexual and reproductive health, mental health, substance use disorders, HIV/AIDS, HIV-related cancers, intimate partner violence, issues surrounding marriage and family recognition, breast and cervical cancer, inequities in healthcare and access to care. In medicine, various nomenclature, including variants of the acronym LGBTQIA+, are used as an umbrella term to refer to individuals who are non-heterosexual, non-heteroromantic, or non-cis gendered. Specific groups within this community have their own distinct health concerns, however are often grouped together in research and discussions. This is primarily because these sexual and gender minorities groups share the effects of stigmatization based on their gender identity or expression, and/or sexual orientation or affection orientation. Furthermore, there are subpopulations among LGBTQIA+ groups based on factors such as race, ethnicity, socioeconomic status, geographic location, and age, all of which can impact healthcare outcomes.
Bisexuality is a romantic or sexual attraction or behavior toward both males and females, to more than one gender, or to both people of the same gender and different genders. It may also be defined to include romantic or sexual attraction to people regardless of their sex or gender identity, which is also known as pansexuality.
Sexual fluidity is one or more changes in sexuality or sexual identity. Sexual orientation is stable and unchanging for the vast majority of people, but some research indicates that some people may experience change in their sexual orientation, and this is slightly more likely for women than for men. There is no scientific evidence that sexual orientation can be changed through psychotherapy. Sexual identity can change throughout an individual's life, and does not have to align with biological sex, sexual behavior, or actual sexual orientation.
Homosexuality, as a phenomenon and as a behavior, has existed throughout all eras in human societies.
The following outline offers an overview and guide to LGBT topics.
While LGBT people are often defined by society for their lack of heterosexual relationships, heterosexual relationships among them are fairly common.
This page is based on this Wikipedia article Text is available under the CC BY-SA 4.0 license; additional terms may apply. Images, videos and audio are available under their respective licenses.