List of the largest administrative divisions by GRDP

Last updated

This is a list of first-level country subdivisions by nominal gross state product. This list shows top 100 largest subdivisions by GDP nominal and PPP. Those subdivisions which are the largest in their respective countries are shown in bold.

Contents

Top 100 subdivisions by GDP (Nominal)

Largest country subdivisions by GDP Country subdivisions by GDP over 200 billion USD.png
Largest country subdivisions by GDP

Top 100 subdivisions by GDP (PPP)

Notelist

  1. Statistics are for capital area.

See also

Related Research Articles

<span class="mw-page-title-main">Macaé</span> Municipality in Southeast, Brazil

Macaé is a municipality located in the Brazilian state of Rio de Janeiro, 180 km northeast of the state capital. It is the birthplace of the 13th president of Brazil, Washington Luís.

<span class="mw-page-title-main">Lisbon metropolitan area</span> Metropolitan area in Portugal

The Lisbon Metropolitan Area is a metropolitan area in Portugal centered on Lisbon, the capital and largest city of the country. The metropolitan area, covering 18 municipalities is the largest urban area in the country and the 10th largest in the European Union, with a population in 2015 of 2,812,678 in an area of 3,015.24 km².

<span class="mw-page-title-main">Porto metropolitan area</span> Place in Porto

The Porto Metropolitan Area is a metropolitan area in northern Portugal centered on the City of Porto, Portugal's second largest city. The metropolitan area, covering 17 municipalities, is the second largest urban area in the country and one of the largest in the European Union, with a population in 2021 of 1,737,395 in an area of 2,040.31 km².

<span class="mw-page-title-main">Central Region, Portugal</span> NUTS II Region in Central, Portugal

The Central Region or Central Portugal is one of the statistical regions of Portugal. The cities with major administrative status inside this region are Coimbra, Aveiro, Viseu, Caldas da Rainha, Leiria, Castelo Branco, Torres Vedras, Tomar, and Guarda. It is one of the seven Regions of Portugal. It is also one of the regions of Europe, as given by the European Union for statistical and geographical purposes. Its area totals 28,462 km2 (10,989 sq mi). As of 2011, its population totalled 2,327,026 inhabitants, with a population density of 82 inhabitants per square kilometre.

<span class="mw-page-title-main">Greater São Paulo</span> Place in Brazil

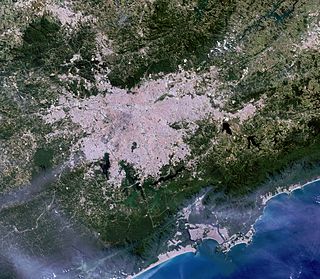
Greater São Paulo is a nonspecific term for one of the multiple definitions of the large metropolitan area located in the São Paulo state in Brazil.

<span class="mw-page-title-main">North Region, Portugal</span> NUTS II Region in Portugal

The North Region or Northern Portugal is the most populous region in Portugal, ahead of Lisbon, and the third most extensive by area. The region has 3,576,205 inhabitants according to the 2017 census, and its area is 21,278 kilometres (13,222 mi) with a density of 173 inhabitants per square kilometre. It is one of five regions of Mainland Portugal. Its main population center is the urban area of Porto, with about one million inhabitants; it includes a larger political metropolitan region with 1.8 million, and an urban-metropolitan agglomeration with 2.99 million inhabitants, including Porto and neighboring cities, such as Braga, Guimarães and Póvoa de Varzim. The Commission of Regional Coordination of the North (CCDR-N) is the agency that coordinates environmental policies, land-use planning, cities and the overall development of this region, supporting local governments and associations.

<span class="mw-page-title-main">Lisbon Region</span> Region in Portugal

Lisbon Region is one of the seven NUTS II designated regions of Portugal, which coincides with the NUTS III subregion Lisbon Metropolitan Area. The region covers an area of 3001.95 km2 and includes a population of 2,815,851 inhabitants according to the 2011 census, a density of 1039 inhabitants/km2.

<span class="mw-page-title-main">Greater Rio de Janeiro</span> Metropolitan area in Brazil

Greater Rio de Janeiro, officially the Rio de Janeiro Metropolitan Region is a large metropolitan area located in Rio de Janeiro state in Brazil, the second largest in Brazil and third largest in South America. It consists of 22 municipalities, including the state capital, Rio de Janeiro.

Santa Vitória is a municipality in the west of the Brazilian state of Minas Gerais. As of 2020, the population was estimated at 19,872. It became a municipality in 1948.

<span class="mw-page-title-main">Iati, Pernambuco</span> City in Pernambuco, Brazil

Iati is a city located in the state of Pernambuco, Brazil. It is located at 286 km away from Recife, capital of the state of Pernambuco. It has an estimated population of 19,241 inhabitants.

<span class="mw-page-title-main">Alentejo Region</span> NUTS of Portugal

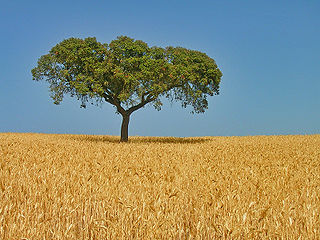
Alentejo Region is one of the seven NUTS 2 regions of Portugal. It covers all of the historical Alentejo Province and part of the historical Ribatejo and Estremadura provinces.

<span class="mw-page-title-main">Economy of Rio de Janeiro</span>

The economy of the Rio de Janeiro City is the 2nd largest regional economy and financial center in Brazil, both one of the largest in Latin America and one of the fastest growing in the world.

<span class="mw-page-title-main">Caçador</span> Municipality in South, Brazil

Caçador is a municipality in the state of Santa Catarina in the South region of Brazil.

Rosário do Ivaí is a municipality in the state of Paraná in the Southern Region of Brazil.The inhabitants are called Rosarienses. The municipality extends over 371.3 km² and had 4,786 inhabitants in the last census. The demographic density is 12.9 inhabitants per km² in the municipality’s territory.

<span class="mw-page-title-main">Historical GDP of China</span> Overview of economic growth and decline in the East Asian country

This article includes a list of China's historical gross domestic product (GDP) values, the market value of all final goods and services produced by a nation in a given year. The GDP dollar estimates presented here are either calculated at market or government official exchange rates (nominal), or derived from purchasing power parity (PPP) calculations. This article also includes historical GDP growth.

<span class="mw-page-title-main">Mesoregion of Assis</span> Mesoregion in Southeast, Brazil

The Mesoregion of Assis is one of the 15 mesoregions of the São Paulo state, Brazil. It is located at the southwest portion of the state, and has an area of 12,710.210 km2 and the seat of mesoregion is in Assis.

References

  1. 1 2 3 4 5 6 7 8 9 10 11 12 13 14 15 16 17 18 19 "Regional Data GDP and Personal Income". GDP by State | U.S. Bureau of Economic Analysis (BEA). Bureau of Economic Analysis. Retrieved 14 April 2023.
  2. 1 2 "Regional gross value added (balanced) per head and income components - Office for National Statistics". www.ons.gov.uk.
  3. 1 2 3 4 5 6 7 8 9 10 11 12 13 14 15 16 17 18 19 20 21 22 23 24 25 26 27 28 29 GDP-2022 is a preliminary data "Home - Regional - Quarterly by Province" (Press release). China NBS.
  4. "県民経済計算(平成23年度 - 令和2年度)(2008SNA、平成27年基準計数)<47都道府県、4政令指定都市分>".
  5. "Regional gross domestic product by NUTS 2 regions - million EUR". europa.eu. Retrieved 28 January 2024.
  6. "Ontario Economic Accounts". data.ontario.ca. Retrieved 2023-04-13.
  7. "Bruttoinlandsprodukt (VGR) | Drupal | Statistikportal.de".
  8. ""São Paulo é a 21ª maior economia do mundo"". 9 November 2020.
  9. 1 2 3 4 5 6 7 8 9 10 11 12 13 14 15 16 17 18 19 20 21 22 23 24 25 26 27 28 29 "US State GDP 2018" (PDF). Archived (PDF) from the original on 2017-05-13.
  10. 1 2 3 4 5 6 7 GDP-2019 by Chinese provinces is quarterly data ( "Regional - quarterly by province (preliminary estimate) - China NBS National data". data.stats.gov.cn/english/index.htm. 2019-04-07.). the average exchange rate is CNY 6.9 per US dollar (according to the Statistical Communiqué of P.R. China on the 2019 National Economic and Social Development, "Statistical Communiqué of P.R. China on the 2018 National Economic and Social Development". data.stats.gov.cn/english/index.htm. 2019-04-07.)
  11. 1 2 3 4 5 6 7 8 "Germany GDP-2012 and 2013 figures". Statistik-portal.de. Archived from the original on 2011-05-24. Retrieved 2017-03-30. Germany Federal Statistical Office; National accounts – Gross domestic product; Annual average exchange rate is US$ 1.11 to EUR€ 1 in 2015
  12. 1 2 3 4 Statistics, c=AU; o=Commonwealth of Australia; ou=Australian Bureau of (18 November 2023). "Australian National Accounts: State Accounts". www.abs.gov.au. Retrieved 2023-04-14.{{cite web}}: CS1 maint: multiple names: authors list (link)
  13. "Maharashtra Budget Analysis 2023-24" (PDF). PRS Legislative Research. Retrieved 2023-04-15.
  14. 1 2 OECD (2015-03-17). "Istat Statistics". Dati.istat.it. Archived from the original on 2017-03-30. Retrieved 2017-03-30.
  15. 1 2 3 "2022년 지역소득(잠정)". www.kostat.go.kr.
  16. Québec, Institut de la statistique du. "La statistique au service de la société". Institut de la Statistique du Québec. Retrieved 2023-04-13.
  17. "Overview of Osaka City". Invest Osaka. Retrieved December 31, 2021.
  18. 1 2 International Monetary Fund. "World Economic Outlook Database, April 2023". International Monetary Fund.
  19. "Tamil Nadu Budget Analysis 2023-24" (PDF). PRS Legislative research. Retrieved 15 April 2023.
  20. 1 2 3 4 "Валовой региональный продукт". gks.ru.
  21. "Regional GDP per capita ranged from 30% to 263% of the EU average in 2018". Eurostat.
  22. "Gujarat State Budget" (PDF). Retrieved 2023-04-24.
  23. ""Karnataka State Budget"".
  24. "Uttar Pradesh State Budget" (PDF). Retrieved 2023-04-25.
  25. "Gross domestic product, expenditure-based, provincial and territorial, annual". statcan.gc.ca. 19 November 2012. Retrieved 2023-04-13.
  26. "Gross domestic product, expenditure-based, provincial and territorial, annual". statcan.gc.ca. 19 November 2012. Retrieved 2023-02-13.
  27. 1 2 ""PIB de las Comunidades Autonomas"".
  28. "IBGE | Cidades@ | Rio de Janeiro | Rio de Janeiro | Pesquisa | Produto Interno Bruto dos Municípios | PIB a preços correntes | 2019". cidades.ibge.gov.br. Retrieved 2023-10-25.
  29. 1 2 "Türkiye İstatistik Kurumu (TÜİK)".
  30. "IBGE | Cidades@ | Rio de Janeiro | Rio de Janeiro | Pesquisa | Produto Interno Bruto dos Municípios | PIB a preços correntes | 2019". cidades.ibge.gov.br. Retrieved 2023-10-25.
  31. "IBGE | Cidades@ | Rio de Janeiro | Rio de Janeiro | Pesquisa | Produto Interno Bruto dos Municípios | PIB a preços correntes | 2019". cidades.ibge.gov.br. Retrieved 2023-10-25.
  32. "IBGE | Cidades@ | Rio de Janeiro | Rio de Janeiro | Pesquisa | Produto Interno Bruto dos Municípios | PIB a preços correntes | 2019". cidades.ibge.gov.br. Retrieved 2023-10-25.
  33. 1 2 3 4 5 Badan Pusat Statistik (2024). "Produk Domestik Regional Bruto (Milyar Rupiah), 2022-2023" (in Indonesian). Jakarta: Badan Pusat Statistik.
  34. 1 2 "GDP OF KHYBER PUKHTUNKHWA'S DISTRICTS" (PDF). kpbos.gov.pk.
  35. "West Bengal State Budget" . Retrieved 2023-04-25.
  36. 1 2 "Abu Dhabi Emirate: Facts and Figures". Abudhabi.ae. 2017-03-15. Retrieved 2017-03-30.
  37. 1 2 3 4 5 6 7 "GDP by State". GDP by State | U.S. Bureau of Economic Analysis (BEA). Bureau of Economic Analysis. Retrieved 10 April 2022.
  38. Citibanamex (June 13, 2023). "Indicadores Regionales de Actividad Económica 2023" (PDF) (in Spanish). Retrieved August 13, 2023.
  39. 1 2 "PIB TRIMESTRAL DO ESTADO DE SÃO PAULO" (PDF).
  40. 1 2 3 4 5 6 7 8 9 10 11 12 13 14 "MOSPI Gross State Domestic Product". Ministry of Statistics and Programme Implementation, Government of India . 31 July 2020. Retrieved 8 October 2020.
  41. 1 2 3 4 5 6 7 8 9 10 11 12 GDP-2020 by Chinese provinces is quarterly data ( "Regional - quarterly by province (preliminary estimate) - China NBS National data". data.stats.gov.cn/english/index.htm. 2019-04-07.). the average exchange rate is CNY 6.6174 per US dollar (according to the Statistical Communiqué of P.R. China on the 2018 National Economic and Social Development, "Statistical Communiqué of P.R. China on the 2018 National Economic and Social Development". data.stats.gov.cn/english/index.htm. 2019-04-07.)
  42. "都民経済計算(都内総生産等)30年度速報・元年度見込|東京都" (in Japanese). Tokyo Metropolitan Government . Retrieved April 28, 2020.
  43. 1 2 GDP-2021 is a preliminary data "Home - Regional - Quarterly by Province" (Press release). China NBS. March 1, 2021. Retrieved March 23, 2021.
  44. "Bruttoinlandsprodukt (VGR) | Drupal | Statistikportal.de".
  45. "Ontario Economic Update". Fin.gov.on.ca. 2017-03-24. Archived from the original on 2017-05-15. Retrieved 2017-03-30.
  46. "Mexico Economy - Information on Business and Investment in Mexico".
  47. 1 2 3 Statistics, c=AU; o=Commonwealth of Australia; ou=Australian Bureau of. "Main Features - Main Features". www.abs.gov.au. Archived from the original on 2013-12-09. Retrieved 2013-12-21.{{cite web}}: CS1 maint: multiple names: authors list (link)
  48. Содержание [Content]. rosstat.gov.ru. Retrieved 25 October 2023.
  49. 1 2 "Regional GDP per capita ranged from 30% to 263% of the EU average in 2018" (PDF). ec.europa.eu. Retrieved 25 October 2023.
  50. "CANSIM - 384-0038 - Gross domestic product, expenditure-based, provincial and territorial". Statcan.gc.ca. Archived from the original on 2018-05-30. Retrieved 2017-03-30.
  51. "EU regions by GDP, Eurostat".
  52. "Archived copy". Archived from the original on 2016-02-29. Retrieved 2016-02-28.{{cite web}}: CS1 maint: archived copy as title (link)