Model output statistics

Last updated

In weather forecasting, model output statistics (MOS) is a multiple linear regression technique in which predictands, often near-surface quantities (such as two-meter-above-ground-level air temperature, horizontal visibility, and wind direction, speed and gusts), are related statistically to one or more predictors. The predictors are typically forecasts from a numerical weather prediction (NWP) model, climatic data, and, if applicable, recent surface observations. Thus, output from NWP models can be transformed by the MOS technique into sensible weather parameters that are familiar to a layperson.

Contents

Background

Output directly from the NWP model's lowest layer(s) generally is not used by forecasters because the actual physical processes that occur within the Earth's boundary layer are crudely approximated in the model (i.e., physical parameterizations) along with its relatively coarse horizontal resolution. Because of this lack of fidelity and its imperfect initial state, forecasts of near-surface quantities obtained directly from the model are subject to systematic (bias) and random model errors, which tend to grow with time. [1] [2]

In the development of MOS equations, past observations and archived NWP model forecast fields are used with a screening regression to determine the 'best' predictors and their coefficients for a particular predictand and forecast time. By using archived model forecast output along with verifying surface observations, the resulting equations implicitly take into account physical effects and processes which the underlying numerical weather prediction model cannot explicitly resolve, resulting in much better forecasts of sensible weather quantities. In addition to correcting systematic errors, MOS can produce reliable probabilities of weather events from a single model run. In contrast, despite the enormous amount of computing resources devoted to generating them, ensemble model forecasts' relative frequency of events—often used as a proxy for probability—do not exhibit useful reliability. [3] Thus, ensemble NWP model output also requires additional post-processing in order to obtain reliable probabilistic forecasts, using nonhomogeneous Gaussian regression [4] or other methods. [5] [6]

History

United States

MOS was conceived and planning for its use began within the U.S. National Weather Service’s (NWS’s) Techniques Development Laboratory (TDL) in 1965 and forecasts first issued from it in 1968. [7] Since then, TDL, now the Meteorological Development Laboratory (MDL), continued to create, refine and update MOS equation sets as additional NWP models were developed and made operational at the National Meteorological Center (NMC) and then the Environmental Modeling Center or EMC. [8]

Given its multi-decadal history within the U.S. NWS and its continuous improvement and superior skill over direct NWP model output, MOS guidance is still one of the most valuable forecast tools used by forecasters within the agency. [9]

United States forecast guidance

There are eight sets of MOS guidance available from MDL, operational and experimental, covering the span of time from the next hour out to ten days for the United States and most of its territories. [note 1]

NameUpdate frequency
Localized Aviation MOS Program (LAMP)Every hour
North American Mesoscale (NAM) MOSTwice per day
Short-range Global Forecast System (GFS) MOSEvery six hours
Extended-range GFS MOSTwice per day
North American Ensemble Forecast System MOSTwice per day
Short-range ECMWF MOS [note 2] Twice per day
Extended-range ECMWF MOS [note 2] Twice per day
Ensemble ECMWF MOS [note 2] Twice per day

Nested Grid Model MOS was discontinued in 2009. [10]

Initially, MOS guidance was developed for airports and other fixed locales where METARs (or similar reports) were routinely issued. Therefore, MOS guidance was and continues to be provided in an alphanumeric 'bulletin' format for these locations. Here is an example of a short-range MOS forecast for Clinton-Sherman Airport, Oklahoma (KCSM) based on the EMC's Global Forecast System model output.

KCSM GFS MOS GUIDANCE 8/06/2014 1200 UTC
DT /AUG   6/AUG   7                /AUG   8                /AUG   9  HR   18 21 00 03 06 09 12 15 18 21 00 03 06 09 12 15 18 21 00 06 12  N/X                    71         101          74         104    72  TMP  90 96 94 84 78 74 72 84 95100 98 87 82 78 75 88 98102 99 80 73  DPT  65 62 62 63 63 63 64 65 63 60 60 62 63 63 64 65 63 60 61 63 63  CLD  CL FW CL CL BK BK CL CL CL CL CL CL FW CL CL CL CL CL CL OV FW  WDR  21 20 19 16 16 18 19 22 32 07 11 12 16 18 19 22 22 20 20 19 21  WSP  14 15 13 11 13 10 10 08 06 06 10 08 10 10 10 14 12 15 15 08 07  P06         2     9     6     1     2     4     2     4     2  6  5  P12                    14           5           4          10    12  Q06         0     0     0     0     0     0     0     0     0  0  0  Q12                     0           0           0           0     0  T06     29/27 38/21 22/ 6  8/ 2 26/14 24/ 8 16/ 5 12/ 4 27/18 20/ 7  T12           58/31       24/ 6       39/16       29/ 6    44/25     CIG   8  8  8  8  8  8  8  8  8  8  8  8  8  8  8  8  8  8  8  8  8  VIS   7  7  7  7  7  7  7  7  7  7  7  7  7  7  7  7  7  7  7  7  7  OBV   N  N  N  N  N  N  N  N  N  N  N  N  N  N  N  N  N  N  N  N  N 

With the availability of private- and government-owned weather mesonets, [11] new objective analysis and interpolation techniques, [12] gridded GFS MOS guidance became available in 2006. [13] [14]

MaxT2 CONUS 08072014.png

Advantages and disadvantages

The advantage of MOS forecast guidance as developed in the United States allowed for

These points, while greatly desired by forecasters, do come at a price. From its very beginnings, the development of robust MOS equations for a particular NWP model required at least two years' worth of archived model output and observations, during which time the NWP model should remain unchanged, or nearly so. This requirement is necessary in order to fully capture the model's error characteristics under a wide variety of meteorological flow regimes for any particular location or region. Extreme meteorological events such as unusual cold- or heat-waves, heavy rain and snowfall, high winds, etc., are important in the development of robust MOS equations. A lengthy model archive has the best chance of capturing such events.

From the 1970s and into the 1980s, this requirement was not very onerous since EMC (then NMC) scientists, being relatively constrained by computational resources at the time, could only make relatively minor, incremental improvements to their NWP models. However, since the 1990s, NWP models have been upgraded more frequently, oftentimes with significant changes in physics and horizontal and vertical grid resolutions. [15] [16] Since MOS corrects systematic biases of the NWP model it is based on, any changes to the NWP model's error characteristics affects MOS guidance, usually in a negative way. [17] [18] This was a factor in the discontinuation of the MOS for the individual ensemble members of the GFS in April 2019; that product had not been updated since 2009, and NOAA decided to cease offering the product instead of bringing it up to date. [19]

In the case of a major upgrade to a NWP model, the EMC will run the newer version of model in parallel with the operational one for many months to allow for direct comparison of model performance. [20] In addition to parallel real-time runs, EMC also runs the newer model to examine past events and seasons, i.e., retrospective forecasts.

All of these runs from the upgraded model allows the National Weather Service, Weather Prediction Center (WPC), National Hurricane Center (NHC), and Storm Prediction Center (SPC) to evaluate its performance prior to the decision to either accept or reject it for operational use. MDL scientists have taken advantage of these runs to evaluate and reformulate the MOS equations as needed to avoid deterioration in guidance quality. [21]

Other weather centers

Royal Netherlands Meteorological Institute developed a MOS system to forecast probabilities of (severe) thunderstorms in the Netherlands. [22] [23]

Scientists from the Meteorological Service of Canada developed a post-processing system called Updateable MOS (UMOS) that quickly incorporates changes to their regional NWP model without the need for a lengthy model archive. [24] The Canadian UMOS system generates a 2-day forecast of temperatures, wind speed and direction and probability of precipitation (POP). UMOS temperature and wind forecasts are provided at 3-h intervals, and POP at 6-h intervals.

Scientists at the Kongju National University have also implemented a UMOS system to create forecasts of air temperatures over South Korea. [25] It is unclear as to whether it is used operationally at the Korean Meteorological Administration.

Notes

  1. Guam and surrounding Northern Mariana Islands only have GFS MOS guidance available
  2. 1 2 3 Access to ECMWF MOS is restricted to the NOAA organization due to European Centre for Medium-Range Weather Forecasts copyright policy.

Related Research Articles

<span class="mw-page-title-main">European Centre for Medium-Range Weather Forecasts</span> European intergovernmental weather computation organisation based in the UK

The European Centre for Medium-Range Weather Forecasts (ECMWF) is an independent intergovernmental organisation supported by most of the nations of Europe. It is based at three sites: Shinfield Park, Reading, United Kingdom; Bologna, Italy; and Bonn, Germany. It operates one of the largest supercomputer complexes in Europe and the world's largest archive of numerical weather prediction data.

<span class="mw-page-title-main">Weather forecasting</span> Science and technology application

Weather forecasting is the application of science and technology to predict the conditions of the atmosphere for a given location and time. People have attempted to predict the weather informally for millennia and formally since the 19th century.

<span class="mw-page-title-main">Weather Prediction Center</span> United States weather agency

The Weather Prediction Center (WPC), located in College Park, Maryland, is one of nine service centers under the umbrella of the National Centers for Environmental Prediction (NCEP), a part of the National Weather Service (NWS), which in turn is part of the National Oceanic and Atmospheric Administration (NOAA) of the U.S. Government. Until March 5, 2013 the Weather Prediction Center was known as the Hydrometeorological Prediction Center (HPC). The Weather Prediction Center serves as a center for quantitative precipitation forecasting, medium range forecasting, and the interpretation of numerical weather prediction computer models.

<span class="mw-page-title-main">Numerical weather prediction</span> Weather prediction using mathematical models of the atmosphere and oceans

Numerical weather prediction (NWP) uses mathematical models of the atmosphere and oceans to predict the weather based on current weather conditions. Though first attempted in the 1920s, it was not until the advent of computer simulation in the 1950s that numerical weather predictions produced realistic results. A number of global and regional forecast models are run in different countries worldwide, using current weather observations relayed from radiosondes, weather satellites and other observing systems as inputs.

<span class="mw-page-title-main">Environmental Modeling Center</span> United States weather agency

The Environmental Modeling Center (EMC) is a United States Government agency, which improves numerical weather, marine and climate predictions at the National Centers for Environmental Prediction (NCEP), through a broad program of research in data assimilation and modeling. In support of the NCEP operational forecasting mission, the EMC develops, improves and monitors data assimilation systems and models of the atmosphere, ocean and coupled system, using advanced methods developed internally as well as cooperatively with scientists from universities, NOAA laboratories and other government agencies, and the international scientific community.

<span class="mw-page-title-main">Ensemble forecasting</span> Multiple simulation method for weather forecasting

Ensemble forecasting is a method used in or within numerical weather prediction. Instead of making a single forecast of the most likely weather, a set of forecasts is produced. This set of forecasts aims to give an indication of the range of possible future states of the atmosphere. Ensemble forecasting is a form of Monte Carlo analysis. The multiple simulations are conducted to account for the two usual sources of uncertainty in forecast models: (1) the errors introduced by the use of imperfect initial conditions, amplified by the chaotic nature of the evolution equations of the atmosphere, which is often referred to as sensitive dependence on initial conditions; and (2) errors introduced because of imperfections in the model formulation, such as the approximate mathematical methods to solve the equations. Ideally, the verified future atmospheric state should fall within the predicted ensemble spread, and the amount of spread should be related to the uncertainty (error) of the forecast. In general, this approach can be used to make probabilistic forecasts of any dynamical system, and not just for weather prediction.

Data assimilation is a mathematical discipline that seeks to optimally combine theory with observations. There may be a number of different goals sought – for example, to determine the optimal state estimate of a system, to determine initial conditions for a numerical forecast model, to interpolate sparse observation data using knowledge of the system being observed, to set numerical parameters based on training a model from observed data. Depending on the goal, different solution methods may be used. Data assimilation is distinguished from other forms of machine learning, image analysis, and statistical methods in that it utilizes a dynamical model of the system being analyzed.

<span class="mw-page-title-main">Global Forecast System</span>

The Global Forecast System (GFS) is a global numerical weather prediction system containing a global computer model and variational analysis run by the United States' National Weather Service (NWS).

<span class="mw-page-title-main">Tropical cyclone forecast model</span> Computer program that uses meteorological data to forecast tropical cyclones

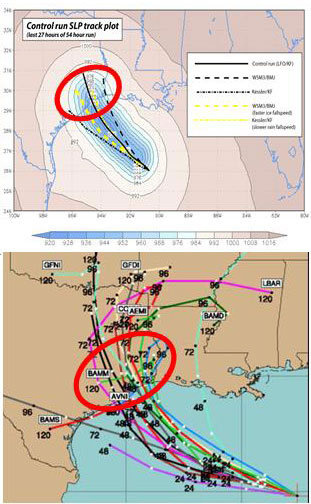
A tropical cyclone forecast model is a computer program that uses meteorological data to forecast aspects of the future state of tropical cyclones. There are three types of models: statistical, dynamical, or combined statistical-dynamic. Dynamical models utilize powerful supercomputers with sophisticated mathematical modeling software and meteorological data to calculate future weather conditions. Statistical models forecast the evolution of a tropical cyclone in a simpler manner, by extrapolating from historical datasets, and thus can be run quickly on platforms such as personal computers. Statistical-dynamical models use aspects of both types of forecasting. Four primary types of forecasts exist for tropical cyclones: track, intensity, storm surge, and rainfall. Dynamical models were not developed until the 1970s and the 1980s, with earlier efforts focused on the storm surge problem.

<span class="mw-page-title-main">Atmospheric model</span> Mathematical model of atmospheric motions

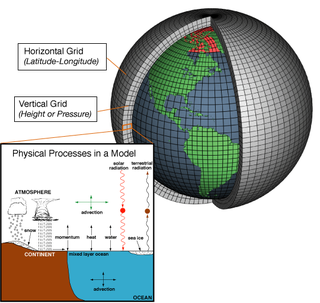
In atmospheric science, an atmospheric model is a mathematical model constructed around the full set of primitive, dynamical equations which govern atmospheric motions. It can supplement these equations with parameterizations for turbulent diffusion, radiation, moist processes, heat exchange, soil, vegetation, surface water, the kinematic effects of terrain, and convection. Most atmospheric models are numerical, i.e. they discretize equations of motion. They can predict microscale phenomena such as tornadoes and boundary layer eddies, sub-microscale turbulent flow over buildings, as well as synoptic and global flows. The horizontal domain of a model is either global, covering the entire Earth, or regional (limited-area), covering only part of the Earth. The different types of models run are thermotropic, barotropic, hydrostatic, and nonhydrostatic. Some of the model types make assumptions about the atmosphere which lengthens the time steps used and increases computational speed.

<span class="mw-page-title-main">Weather Research and Forecasting Model</span> Numerical weather prediction system

The Weather Research and Forecasting (WRF) Model is a numerical weather prediction (NWP) system designed to serve both atmospheric research and operational forecasting needs. NWP refers to the simulation and prediction of the atmosphere with a computer model, and WRF is a set of software for this. WRF features two dynamical (computational) cores, a data assimilation system, and a software architecture allowing for parallel computation and system extensibility. The model serves a wide range of meteorological applications across scales ranging from meters to thousands of kilometers.

A wind power forecast corresponds to an estimate of the expected production of one or more wind turbines in the near future, up to a year. Forecast are usually expressed in terms of the available power of the wind farm, occasionally in units of energy, indicating the power production potential over a time interval.

The Global Environmental Multiscale Model (GEM), often known as the CMC model in North America, is an integrated forecasting and data assimilation system developed in the Recherche en Prévision Numérique (RPN), Meteorological Research Branch (MRB), and the Canadian Meteorological Centre (CMC). Along with the NWS's Global Forecast System (GFS), which runs out to 16 days, the ECMWF's Integrated Forecast System (IFS), which runs out 10 days, the Naval Research Laboratory Navy Global Environmental Model (NAVGEM), which runs out eight days, the UK Met Office's Unified Model, which runs out to seven days, and Deutscher Wetterdienst's ICON, which runs out to 7.5 days, it is one of the global medium-range models in general use.

<span class="mw-page-title-main">Quantitative precipitation forecast</span> Expected amount of melted precipitation

The quantitative precipitation forecast is the expected amount of melted precipitation accumulated over a specified time period over a specified area. A QPF will be created when precipitation amounts reaching a minimum threshold are expected during the forecast's valid period. Valid periods of precipitation forecasts are normally synoptic hours such as 00:00, 06:00, 12:00 and 18:00 GMT. Terrain is considered in QPFs by use of topography or based upon climatological precipitation patterns from observations with fine detail. Starting in the mid-to-late 1990s, QPFs were used within hydrologic forecast models to simulate impact to rivers throughout the United States. Forecast models show significant sensitivity to humidity levels within the planetary boundary layer, or in the lowest levels of the atmosphere, which decreases with height. QPF can be generated on a quantitative, forecasting amounts, or a qualitative, forecasting the probability of a specific amount, basis. Radar imagery forecasting techniques show higher skill than model forecasts within 6 to 7 hours of the time of the radar image. The forecasts can be verified through use of rain gauge measurements, weather radar estimates, or a combination of both. Various skill scores can be determined to measure the value of the rainfall forecast.

<span class="mw-page-title-main">André Robert</span> Canadian meteorologist

Dr. André Robert was a Canadian meteorologist who pioneered the modelling the Earth's atmospheric circulation.

The Nested Grid Model was a numerical weather prediction model run by the National Centers for Environmental Prediction, a division of the National Weather Service, in the United States. The NGM was, as its name suggested, derived from two levels of grids: a hemispheric-scale grid and a synoptic-scale grid, the latter of which had a resolution of approximately 90 kilometers. Its most notable feature was that it assumed the hydrostatic equation.

<span class="mw-page-title-main">History of numerical weather prediction</span> Aspect of meteorological history

The history of numerical weather prediction considers how current weather conditions as input into mathematical models of the atmosphere and oceans to predict the weather and future sea state has changed over the years. Though first attempted manually in the 1920s, it was not until the advent of the computer and computer simulation that computation time was reduced to less than the forecast period itself. ENIAC was used to create the first forecasts via computer in 1950, and over the years more powerful computers have been used to increase the size of initial datasets as well as include more complicated versions of the equations of motion. The development of global forecasting models led to the first climate models. The development of limited area (regional) models facilitated advances in forecasting the tracks of tropical cyclone as well as air quality in the 1970s and 1980s.

<span class="mw-page-title-main">Solar power forecasting</span> Power forecasting

Solar power forecasting is the process of gathering and analyzing data in order to predict solar power generation on various time horizons with the goal to mitigate the impact of solar intermittency. Solar power forecasts are used for efficient management of the electric grid and for power trading.

The North American Ensemble Forecast System (NAEFS) is a joint project involving the Meteorological Service of Canada (MSC) in Canada, the National Weather Service (NWS) in the United States, and the National Meteorological Service of Mexico (NMSM) in Mexico providing numerical weather prediction ensemble guidance for the 1- to 16-day forecast period. The NAEFS combines the Canadian MSC and the US NWS global ensemble prediction systems, improving probabilistic operational guidance over what can be built from any individual country's ensemble. Model guidance from the NAEFS is incorporated into the forecasts of the respective national agencies.

The cost-loss model, also called the cost/loss model or the cost-loss decision model, is a model used to understand how the predicted probability of adverse events affects the decision of whether to take a costly precautionary measure to protect oneself against losses from that event. The threshold probability above which it makes sense to take the precautionary measure equals the ratio of the cost of the preventative measure to the loss averted, and this threshold is termed the cost/loss ratio or cost-loss ratio. The model is typically used in the context of using prediction about weather conditions to decide whether to take a precautionary measure or not.

References

  1. Lorenz, Edward N. (March 1963). "Deterministic Nonperiodic Flow". Journal of the Atmospheric Sciences. 20 (2): 130–141. Bibcode:1963JAtS...20..130L. doi: 10.1175/1520-0469(1963)020<0130:DNF>2.0.CO;2 .
  2. Simmons, A.J.; Mureau, R.; Petroliagis, T. (1995). "Error growth estimates of predictability from the ECMWF forecasting system". Q. J. R. Meteorol. Soc. 121 (527): 1739–1771. doi:10.1002/qj.49712152711.
  3. Rudack, David; Ghirardelli, Judy (August 2010). "A Comparative Verification of Localized Aviation Model Output Statistics Program (LAMP) and Numerical Weather Prediction (NWP) Model Forecast of Ceiling Height and Visibility". Weather and Forecasting. 25 (4): 1161–1178. Bibcode:2010WtFor..25.1161R. doi: 10.1175/2010WAF2222383.1 .
  4. Jewson, S.; Brix, A.; Ziehmann, C. (2004). "A new parametric model for the assessment and calibration of medium‐range ensemble temperature forecasts". Atmospheric Science Letters. 5 (5): 96–102. arXiv: physics/0308057 . doi:10.1002/asl.69.
  5. Wilks, Daniel S.; Hamill, Thomas M. (June 2007). "Comparison of Ensemble-MOS Methods Using GFS Reforecasts". Monthly Weather Review. 135 (6): 2379–2390. Bibcode:2007MWRv..135.2379W. doi: 10.1175/MWR3402.1 .
  6. Veehuis, Bruce (July 2013). "Spread Calibration of Ensemble MOS Forecasts". Monthly Weather Review. 141 (7): 2467–2482. Bibcode:2013MWRv..141.2467V. doi: 10.1175/MWR-D-12-00191.1 .
  7. Glahn, Harry R.; Dallavalle, J. Paul (January 2000). "TDL Office Note 00-1:MOS-2000" (PDF). Internal Publication. Silver Spring Maryland USA: Techniques Development Laboratory: 179. Archived from the original (PDF) on 12 August 2014. Retrieved 9 August 2014.
  8. Carter, Gary M.; Dallevalle, J. Paul; Glahn, Harry R. (September 1989). "Statistical Forecasts Based on the National Meteorological Center's Numerical Weather Prediction System". Weather and Forecasting. 4 (3): 401–412. Bibcode:1989WtFor...4..401C. doi: 10.1175/1520-0434(1989)004<0401:SFBOTN>2.0.CO;2 .
  9. Unpublished. "Annual MDL Users Survey 2011" (PDF). pp. 25–27. Retrieved 3 August 2014.
  10. MOS changelog. Retrieved May 12, 2019.
  11. NOAA, Earth Systems Research Laboratory. "MADIS Surface Network Information". Archived from the original on 12 August 2014. Retrieved 7 August 2014.
  12. Glahn, Bob; Im, J.S. (January 2011). "Algorithms for effective objective analysis of surface weather variables". 24th Conf. On Weather and Forecasting/20th Conf. On Numerical Weather Prediction (J19.4). Retrieved 7 August 2014.
  13. Glahn, Bob; Gilbert, Kathryn; Cosgrove, Rebecca; Ruth, David; Sheets, Kari (April 2009). "The Gridding of MOS". Weather and Forecasting. 24 (2): 520–529. Bibcode:2009WtFor..24..520G. doi: 10.1175/2008WAF2007080.1 .
  14. National Weather Service. "National Digital Guidance Database".
  15. Environmental Modeling Center, Mesoscale Modeling Branch. "Mesoscale Branch Web Page Reference List" . Retrieved 7 August 2014.
  16. Environmental Modeling Center, Global Branch. "[GFS/GDAS] Changes since 1991" . Retrieved 7 August 2014.
  17. Erickson, Mary C. (March 1991). "Evaluating the Impact of RAFS Changes on the NGM-Based MOS Guidance". Weather and Forecasting. 6 (1): 142–147. Bibcode:1991WtFor...6..142E. doi: 10.1175/1520-0434(1991)006<0142:ETIORC>2.0.CO;2 .
  18. Erickson, Mary C.; Dallavalle, J. Paul; Carroll, Kevin L. (January 2002). "The new AVN/MRF MOS development and model changes: a volatile mix?". 16th Conference on Probability and Statistics in the Atmospheric Sciences. Retrieved 5 August 2014.
  19. SCN19-23: Termination of the Global Ensemble Forecast System (GEFS)-based Model Output Statistics (MOS) product (MEN) on or about April 16, 2019 Retrieved May 12, 2019
  20. National Centers for Environmental Prediction, Environmental Modeling Center. "EMC Verification Scorecard". Archived from the original on 12 August 2014. Retrieved 12 August 2014.
  21. Antolik, Mark; Baker, Michael (2 June 2009). "On the ability to develop MOS guidance with short dependent samples from an evolving numerical model" (PDF). 23rd Conference Weather Analysis and Forecasting/19th Conference Numerical Prediction. 6A.1. Retrieved 9 August 2014.
  22. Schmeits, Maurice J.; Kok, Kees J.; Vogelezang, Daan H. P. (April 2005). "Probabilistic Forecasting of (Severe) Thunderstorms in the Netherlands Using Model Output Statistics". Weather and Forecasting. 20 (2): 134–148. Bibcode:2005WtFor..20..134S. doi:10.1175/WAF840.1.
  23. van Gastel, Valentijn. "Investigating MSG-SEVIRI data as an additional predictor source in the KNMI probabilistic (severe) thunderstorm forecasting system" (PDF). Koninklijk Nederlands Meteorologisch Instituut. Royal Netherlands Meteorological Institute (KNMI) publication. Retrieved 9 August 2014.
  24. Wilson, Laurence; Vallee, Marcel (April 2002). "The Canadian Updateable Model Output Statistics (UMOS) System: Design and Development Tests". Weather and Forecasting. 17 (2): 206–222. Bibcode:2002WtFor..17..206W. doi: 10.1175/1520-0434(2002)017<0206:TCUMOS>2.0.CO;2 .
  25. Kang, Jeon-Ho; Suh, Myoung-Seok; Hong, Ki-Ok; Kim, Chansoo (February 2011). "Development of updateable model output statistics (UMOS) system for air temperature over South Korea". Asia-Pacific Journal of the Atmospheric Sciences. 47 (2): 199–211. Bibcode:2011APJAS..47..199K. doi:10.1007/s13143-011-0009-8.

Further reading