Mound Valley, Kansas

Last updated

Mound Valley, Kansas
Labette County Kansas Incorporated and Unincorporated areas Mound Valley Highlighted.svg
Location within Labette County and Kansas
Map of Labette Co, Ks, USA.png
Coordinates: 37°12′22″N95°24′15″W / 37.20611°N 95.40417°W / 37.20611; -95.40417 [1]
Country United States
State Kansas
County Labette
Founded1869
Incorporated 1871
Area
[2]
  Total0.64 sq mi (1.66 km2)
  Land0.64 sq mi (1.66 km2)
  Water0.00 sq mi (0.00 km2)
Elevation
[1]
833 ft (254 m)
Population
 (2020) [3]
  Total348
  Density540/sq mi (210/km2)
Time zone UTC-6 (CST)
  Summer (DST) UTC-5 (CDT)
ZIP code
67354
Area code 620
FIPS code 20-48825 [1]
GNIS ID 469430 [1]
Website moundvalleyks.com

Mound Valley is a city in Labette County, Kansas, United States. [1] As of the 2020 census, the population of the city was 348. [3]

Contents

History

Mound Valley was founded in 1869. It was named from mound-like hills in the vicinity. [4]

The first post office in Mound Valley was established in May 1870. [5] Mound Valley was incorporated as a city in 1871. [6] The town was a stop on the Missouri-Kansas-Texas railroad line from 1886 until the 1970s, and was also served by the Frisco Railroad and is currently served by the South Kansas and Oklahoma Railroad, which operates on the Frisco's former tracks.

Geography

Mound Valley is located at 37°12′22″N95°24′15″W / 37.206173°N 95.404231°W / 37.206173; -95.404231 (37.206173, -95.404231). [7] According to the United States Census Bureau, the city has a total area of 0.65 square miles (1.68 km2), all land. [8]

Climate

The climate in this area is characterized by hot, humid summers and generally mild to cool winters. According to the Köppen Climate Classification system, Mound Valley has a humid subtropical climate, abbreviated "Cfa" on climate maps. [9]

Demographics

Historical population
CensusPop.Note
1880 138
1890 545294.9%
1900 533−2.2%
1910 95679.4%
1920 803−16.0%
1930 666−17.1%
1940 648−2.7%
1950 566−12.7%
1960 481−15.0%
1970 467−2.9%
1980 381−18.4%
1990 4056.3%
2000 4183.2%
2010 407−2.6%
2020 348−14.5%
U.S. Decennial Census

2020 census

The 2020 United States census counted 348 people, 152 households, and 95 families in Mound Valley. [10] [11] The population density was 542.1 per square mile (209.3/km2). There were 167 housing units at an average density of 260.1 per square mile (100.4/km2). [11] [12] The racial makeup was 86.21% (300) white or European American (85.92% non-Hispanic white), 0.29% (1) black or African-American, 1.44% (5) Native American or Alaska Native, 0.0% (0) Asian, 0.0% (0) Pacific Islander or Native Hawaiian, 0.29% (1) from other races, and 11.78% (41) from two or more races. [13] Hispanic or Latino of any race was 3.74% (13) of the population. [14]

Of the 152 households, 30.3% had children under the age of 18; 42.1% were married couples living together; 34.2% had a female householder with no spouse or partner present. 35.5% of households consisted of individuals and 13.8% had someone living alone who was 65 years of age or older. [11] The average household size was 2.2 and the average family size was 2.7. [15] The percent of those with a bachelor’s degree or higher was estimated to be 4.6% of the population. [16]

27.0% of the population was under the age of 18, 6.3% from 18 to 24, 22.7% from 25 to 44, 29.0% from 45 to 64, and 14.9% who were 65 years of age or older. The median age was 40.3 years. For every 100 females, there were 102.3 males. [11] For every 100 females ages 18 and older, there were 111.7 males. [11]

The 2016-2020 5-year American Community Survey estimates show that the median household income was $43,542 (with a margin of error of +/- $20,620) and the median family income was $65,833 (+/- $27,498). [17] Males had a median income of $38,750 (+/- $12,648) versus $25,139 (+/- $3,183) for females. The median income for those above 16 years old was $27,500 (+/- $5,402). [18] Approximately, 12.2% of families and 15.7% of the population were below the poverty line, including 14.0% of those under the age of 18 and 6.4% of those ages 65 or over. [19] [20]

2010 census

As of the census [21] of 2010, there were 407 people, 170 households, and 105 families residing in the city. The population density was 626.2 inhabitants per square mile (241.8/km2). There were 202 housing units at an average density of 310.8 per square mile (120.0/km2). The racial makeup of the city was 92.9% White, 2.2% Native American, 0.7% from other races, and 4.2% from two or more races. Hispanic or Latino of any race were 2.2% of the population.

There were 170 households, of which 28.2% had children under the age of 18 living with them, 43.5% were married couples living together, 13.5% had a female householder with no husband present, 4.7% had a male householder with no wife present, and 38.2% were non-families. 32.4% of all households were made up of individuals, and 14.1% had someone living alone who was 65 years of age or older. The average household size was 2.39 and the average family size was 2.99.

The median age in the city was 40.8 years. 25.1% of residents were under the age of 18; 6.4% were between the ages of 18 and 24; 22.9% were from 25 to 44; 28% were from 45 to 64; and 17.7% were 65 years of age or older. The gender makeup of the city was 49.9% male and 50.1% female.

2000 census

As of the census [22] of 2000, there were 418 people, 168 households, and 115 families residing in the city. The population density was 636.5 inhabitants per square mile (245.8/km2). There were 190 housing units at an average density of 289.3 per square mile (111.7/km2). The racial makeup of the city was 94.26% White, 2.15% Native American, 1.67% from other races, and 1.91% from two or more races. Hispanic or Latino of any race were 1.91% of the population.

There were 168 households, out of which 35.1% had children under the age of 18 living with them, 52.4% were married couples living together, 11.9% had a female householder with no husband present, and 31.5% were non-families. 30.4% of all households were made up of individuals, and 16.7% had someone living alone who was 65 years of age or older. The average household size was 2.49 and the average family size was 3.05.

In the city, the population was spread out, with 27.5% under the age of 18, 10.5% from 18 to 24, 27.3% from 25 to 44, 21.5% from 45 to 64, and 13.2% who were 65 years of age or older. The median age was 36 years. For every 100 females, there were 85.8 males. For every 100 females age 18 and over, there were 83.6 males.

The median income for a household in the city was $23,542, and the median income for a family was $35,481. Males had a median income of $21,488 versus $13,958 for females. The per capita income for the city was $11,252. About 21.5% of families and 24.1% of the population were below the poverty line, including 29.3% of those under age 18 and 8.2% of those age 65 or over.

Education

The community is served by Labette County USD 506 public school district.

Notable people

See also

Related Research Articles

<span class="mw-page-title-main">Moran, Kansas</span> City in Allen County, Kansas

Moran is a city in Allen County, Kansas, United States. As of the 2020 census, the population of the city was 466.

<span class="mw-page-title-main">Kincaid, Kansas</span> City in Anderson County, Kansas

Kincaid is a city in Anderson County, Kansas, United States. As of the 2020 census, the population of the city was 103.

<span class="mw-page-title-main">Isabel, Kansas</span> City in Kiowa County, Kansas

Isabel is a city in Barber County, Kansas, United States. As of the 2020 census, the population of the city was 68.

<span class="mw-page-title-main">Kiowa, Kansas</span> City in Kiowa County, Kansas

Kiowa is a city in Barber County, Kansas, United States. As of the 2020 census, the population of the city was 902. It is located 1 mile north of the Kansas / Oklahoma state border.

<span class="mw-page-title-main">Hill City, Kansas</span> City in Graham County, Kansas

Hill City is a city and county seat of Graham County, Kansas, United States. As of the 2020 census, the population of the city was 1,403.

<span class="mw-page-title-main">Hoyt, Kansas</span> City in Jackson County, Kansas

Hoyt is a city in Jackson County, Kansas, United States. As of the 2020 census, the population of the city was 593.

<span class="mw-page-title-main">Mayetta, Kansas</span> City in Jackson County, Kansas

Mayetta is a city in Jackson County, Kansas, United States. As of the 2020 census, the population is 348.

<span class="mw-page-title-main">Blue Mound, Kansas</span> City in Kansas, United States

Blue Mound is a city in Linn County, Kansas, United States. As of the 2020 census, the population of the city was 219.

<span class="mw-page-title-main">Linn Valley, Kansas</span> City in Kansas, United States

Linn Valley is a city in Linn County, Kansas, United States. As of the 2020 census, the population of the city was 956.

<span class="mw-page-title-main">Mound City, Kansas</span> City and County seat in Kansas, United States

Mound City is a city in and the county seat of Linn County, Kansas, United States. As of the 2020 census, the population of the city was 647.

<span class="mw-page-title-main">Meade, Kansas</span> City in Meade County, Kansas

Meade is a city in and the county seat of Meade County, Kansas, United States. As of the 2020 census, the population of the city was 1,505.

<span class="mw-page-title-main">Ness City, Kansas</span> City in Ness County, Kansas

Ness City is a city in and the county seat of Ness County, Kansas, United States. As of the 2020 census, the population of the city was 1,329. Ness City is famous for its four-story Old Ness County Bank Building located downtown, and nicknamed Skyscraper of the Plains.

<span class="mw-page-title-main">Lyndon, Kansas</span> City in Osage County, Kansas

Lyndon is a city in, and the county seat of Osage County, Kansas, United States. As of the 2020 census, the population of the city was 1,037.

<span class="mw-page-title-main">Melvern, Kansas</span> City in Osage County, Kansas

Melvern is a city in Osage County, Kansas, United States, along the Marais des Cygnes River. As of the 2020 census, the population of the city was 356.

<span class="mw-page-title-main">Quenemo, Kansas</span> City in Osage County, Kansas

Quenemo is a city in Osage County, Kansas, United States, along the Marais des Cygnes River. As of the 2020 census, the population of the city was 288.

<span class="mw-page-title-main">Long Island, Kansas</span> City in Phillips County, Kansas

Long Island is a city in Phillips County, Kansas, United States. As of the 2020 census, the population of the city was 137.

<span class="mw-page-title-main">Emmett, Kansas</span> City in Pottawatomie County, Kansas

Emmett is a city in Pottawatomie County, Kansas, United States. As of the 2020 census, the population of the city was 170.

<span class="mw-page-title-main">Courtland, Kansas</span> City in Republic County, Kansas

Courtland is a city in Republic County, Kansas, United States. As of the 2020 census, the population of the city was 294.

<span class="mw-page-title-main">Randolph, Kansas</span> City in Riley County, Kansas

Randolph is a city in Riley County, Kansas, United States. As of the 2020 census, the population of the city was 159.

<span class="mw-page-title-main">St. John, Kansas</span> City in Stafford County, Kansas

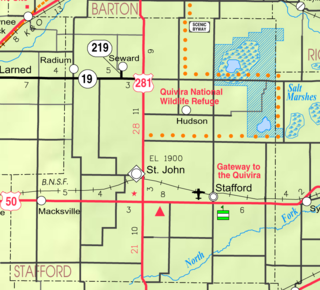
St. John is a city in and the county seat of Stafford County, Kansas, United States. As of the 2020 census, the population of the city was 1,228.
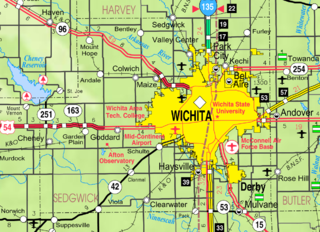
References

  1. 1 2 3 4 5 "Mound Valley, Kansas", Geographic Names Information System , United States Geological Survey, United States Department of the Interior
  2. "2019 U.S. Gazetteer Files". United States Census Bureau. Retrieved July 24, 2020.
  3. 1 2 "Profile of Mound Valley, Kansas in 2020". United States Census Bureau. Archived from the original on June 12, 2022. Retrieved June 12, 2022.
  4. Kansas State Historical Society (1916). Biennial Report of the Board of Directors of the Kansas State Historical Society. Kansas State Printing Plant. pp.  219.
  5. "Kansas Post Offices, 1828-1961". Kansas Historical Society. Retrieved June 12, 2014.
  6. Blackmar, Frank Wilson (1912). Kansas: A Cyclopedia of State History, Volume 2. Standard Publishing Company. pp.  330.
  7. "US Gazetteer files: 2010, 2000, and 1990". United States Census Bureau. February 12, 2011. Retrieved April 23, 2011.
  8. "US Gazetteer files 2010". United States Census Bureau. Archived from the original on July 2, 2012. Retrieved July 6, 2012.
  9. Climate Summary for Mound Valley, Kansas
  10. "US Census Bureau, Table P16: HOUSEHOLD TYPE". data.census.gov. Retrieved January 3, 2024.
  11. 1 2 3 4 5 "US Census Bureau, Table DP1: PROFILE OF GENERAL POPULATION AND HOUSING CHARACTERISTICS". data.census.gov. Retrieved January 3, 2024.
  12. Bureau, US Census. "Gazetteer Files". Census.gov. Retrieved December 30, 2023.
  13. "US Census Bureau, Table P1: RACE". data.census.gov. Retrieved January 3, 2024.
  14. "US Census Bureau, Table P2: HISPANIC OR LATINO, AND NOT HISPANIC OR LATINO BY RACE". data.census.gov. Retrieved January 3, 2024.
  15. "US Census Bureau, Table S1101: HOUSEHOLDS AND FAMILIES". data.census.gov. Retrieved January 3, 2024.
  16. "US Census Bureau, Table S1501: EDUCATIONAL ATTAINMENT". data.census.gov. Retrieved January 3, 2024.
  17. "US Census Bureau, Table S1903: MEDIAN INCOME IN THE PAST 12 MONTHS (IN 2020 INFLATION-ADJUSTED DOLLARS)". data.census.gov. Retrieved January 3, 2024.
  18. "US Census Bureau, Table S2001: EARNINGS IN THE PAST 12 MONTHS (IN 2020 INFLATION-ADJUSTED DOLLARS)". data.census.gov. Retrieved January 3, 2024.
  19. "US Census Bureau, Table S1701: POVERTY STATUS IN THE PAST 12 MONTHS". data.census.gov. Retrieved January 3, 2024.
  20. "US Census Bureau, Table S1702: POVERTY STATUS IN THE PAST 12 MONTHS OF FAMILIES". data.census.gov. Retrieved January 3, 2024.
  21. "U.S. Census website". United States Census Bureau . Retrieved July 6, 2012.
  22. "U.S. Census website". United States Census Bureau . Retrieved January 31, 2008.

Further reading