In biology, phylogenetics is the study of the evolutionary history and relationships among or within groups of organisms. These relationships are determined by phylogenetic inference methods that focus on observed heritable traits, such as DNA sequences, protein amino acid sequences, or morphology. The result of such an analysis is a phylogenetic tree—a diagram containing a hypothesis of relationships that reflects the evolutionary history of a group of organisms.

A phylogenetic tree, phylogeny or evolutionary tree is a graphical representation which shows the evolutionary history between a set of species or taxa during a specific time. In another word, it is a branching diagram or a tree showing the evolutionary relationships among various biological species or other entities based upon similarities and differences in their physical or genetic characteristics. All life on Earth is part of a single phylogenetic tree, indicating common ancestry. Phylogenetics is the field of the study for the phylogenetic trees. The main challenge is to find a phylogenetic tree representing optimal evolutionary ancestry between a set of species or taxa. Computational phylogenetics focuses on the algorithms involved in finding optimal phylogenetic tree in the phylogenetic landscape.

A dendrogram is a diagram representing a tree. This diagrammatic representation is frequently used in different contexts:
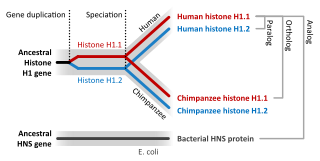
Sequence homology is the biological homology between DNA, RNA, or protein sequences, defined in terms of shared ancestry in the evolutionary history of life. Two segments of DNA can have shared ancestry because of three phenomena: either a speciation event (orthologs), or a duplication event (paralogs), or else a horizontal gene transfer event (xenologs).
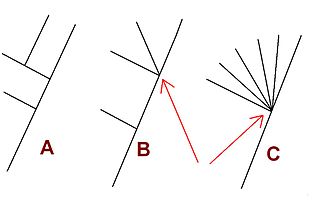
An internal node of a phylogenetic tree is described as a polytomy or multifurcation if (i) it is in a rooted tree and is linked to three or more child subtrees or (ii) it is in an unrooted tree and is attached to four or more branches. A tree that contains any multifurcations can be described as a multifurcating tree.
Computational phylogenetics, phylogeny inference, or phylogenetic inference focuses on computational and optimization algorithms, heuristics, and approaches involved in phylogenetic analyses. The goal is to find a phylogenetic tree representing optimal evolutionary ancestry between a set of genes, species, or taxa. Maximum likelihood, parsimony, Bayesian, and minimum evolution are typical optimality criteria used to assess how well a phylogenetic tree topology describes the sequence data. Nearest Neighbour Interchange (NNI), Subtree Prune and Regraft (SPR), and Tree Bisection and Reconnection (TBR), known as tree rearrangements, are deterministic algorithms to search for optimal or the best phylogenetic tree. The space and the landscape of searching for the optimal phylogenetic tree is known as phylogeny search space.
Ancestral reconstruction is the extrapolation back in time from measured characteristics of individuals to their common ancestors. It is an important application of phylogenetics, the reconstruction and study of the evolutionary relationships among individuals, populations or species to their ancestors. In the context of evolutionary biology, ancestral reconstruction can be used to recover different kinds of ancestral character states of organisms that lived millions of years ago. These states include the genetic sequence, the amino acid sequence of a protein, the composition of a genome, a measurable characteristic of an organism (phenotype), and the geographic range of an ancestral population or species. This is desirable because it allows us to examine parts of phylogenetic trees corresponding to the distant past, clarifying the evolutionary history of the species in the tree. Since modern genetic sequences are essentially a variation of ancient ones, access to ancient sequences may identify other variations and organisms which could have arisen from those sequences. In addition to genetic sequences, one might attempt to track the changing of one character trait to another, such as fins turning to legs.
Bayesian inference of phylogeny combines the information in the prior and in the data likelihood to create the so-called posterior probability of trees, which is the probability that the tree is correct given the data, the prior and the likelihood model. Bayesian inference was introduced into molecular phylogenetics in the 1990s by three independent groups: Bruce Rannala and Ziheng Yang in Berkeley, Bob Mau in Madison, and Shuying Li in University of Iowa, the last two being PhD students at the time. The approach has become very popular since the release of the MrBayes software in 2001, and is now one of the most popular methods in molecular phylogenetics.
In mathematics, Newick tree format is a way of representing graph-theoretical trees with edge lengths using parentheses and commas. It was adopted by James Archie, William H. E. Day, Joseph Felsenstein, Wayne Maddison, Christopher Meacham, F. James Rohlf, and David Swofford, at two meetings in 1986, the second of which was at Newick's restaurant in Dover, New Hampshire, US. The adopted format is a generalization of the format developed by Meacham in 1984 for the first tree-drawing programs in Felsenstein's PHYLIP package.

SplitsTree is a popular freeware program for inferring phylogenetic trees, phylogenetic networks, or, more generally, splits graphs, from various types of data such as a sequence alignment, a distance matrix or a set of trees. SplitsTree implements published methods such as split decomposition, neighbor-net, consensus networks, super networks methods or methods for computing hybridization or simple recombination networks. It uses the NEXUS file format. The splits graph is defined using a special data block.
The Robinson–Foulds or symmetric difference metric, often abbreviated as the RF distance, is a simple way to calculate the distance between phylogenetic trees. It is defined as where A is the number of partitions of data implied by the first tree but not the second tree and B is the number of partitions of data implied by the second tree but not the first tree. The partitions are calculated for each tree by removing each branch. Thus, the number of eligible partitions for each tree is equal to the number of branches in that tree. RF distances have been criticized as biased, but they represent a relatively intuitive measure of the distances between phylogenetic trees and therefore remain widely used. Nevertheless, the biases inherent to the RF distances suggest that researches should consider using "Generalized" Robinson–Foulds metrics that may have better theoretical and practical performance and avoid the biases and misleading attributes of the original metric.
For a given set of taxa like X, and a set of splits S on X, usually together with a non-negative weighting, which may represent character changes distance, or may also have a more abstract interpretation, if the set of splits S is compatible, then it can be represented by an unrooted phylogenetic tree and each edge in the tree corresponds to exactly one of the splits. More generally, S can always be represented by a split network, which is an unrooted phylogenetic network with the property that every split s in S is represented by an array of parallel edges in the network.
The concept of a quasi-median network is a generalization of the concept of a median network that was introduced to represent multistate characters. Note that, unlike median networks, quasi-median networks are not split networks. A quasi-median network is defined as a phylogenetic network, the node set of which is given by the quasi-median closure of the condensed version of M and in which any two nodes are joined by an edge if and only if the sequences associated with the nodes differ in exactly one position. The quasi-median closure is defined as the set of all sequences that can be obtained by repeatedly taking the quasi-median of any three sequences in the set and then adding the result to the set.
T-REX is a freely available web server, developed at the department of Computer Science of the Université du Québec à Montréal, dedicated to the inference, validation and visualization of phylogenetic trees and phylogenetic networks. The T-REX web server allows the users to perform several popular methods of phylogenetic analysis as well as some new phylogenetic applications for inferring, drawing and validating phylogenetic trees and networks.
In bioinformatics, alignment-free sequence analysis approaches to molecular sequence and structure data provide alternatives over alignment-based approaches.
Horizontal or lateral gene transfer is the transmission of portions of genomic DNA between organisms through a process decoupled from vertical inheritance. In the presence of HGT events, different fragments of the genome are the result of different evolutionary histories. This can therefore complicate investigations of the evolutionary relatedness of lineages and species. Also, as HGT can bring into genomes radically different genotypes from distant lineages, or even new genes bearing new functions, it is a major source of phenotypic innovation and a mechanism of niche adaptation. For example, of particular relevance to human health is the lateral transfer of antibiotic resistance and pathogenicity determinants, leading to the emergence of pathogenic lineages.
Multispecies Coalescent Process is a stochastic process model that describes the genealogical relationships for a sample of DNA sequences taken from several species. It represents the application of coalescent theory to the case of multiple species. The multispecies coalescent results in cases where the relationships among species for an individual gene can differ from the broader history of the species. It has important implications for the theory and practice of phylogenetics and for understanding genome evolution.

In phylogenetics, reconciliation is an approach to connect the history of two or more coevolving biological entities. The general idea of reconciliation is that a phylogenetic tree representing the evolution of an entity can be drawn within another phylogenetic tree representing an encompassing entity to reveal their interdependence and the evolutionary events that have marked their shared history. The development of reconciliation approaches started in the 1980s, mainly to depict the coevolution of a gene and a genome, and of a host and a symbiont, which can be mutualist, commensalist or parasitic. It has also been used for example to detect horizontal gene transfer, or understand the dynamics of genome evolution.