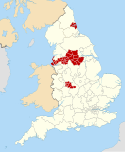
Sandwell is a metropolitan borough of the West Midlands county in England. The borough is named after the Sandwell Priory, and spans a densely populated part of the West Midlands conurbation. Sandwell Metropolitan Borough Council defines the borough as the six amalgamated towns of Oldbury, Rowley Regis, Smethwick, Tipton, Wednesbury and West Bromwich. Rowley Regis includes the towns of Blackheath and Cradley Heath.
Birmingham City Council elections are held every four years. Birmingham City Council is the local authority for the metropolitan district of Birmingham in the West Midlands, England. Since the last boundary changes in 2018, 101 councillors have been elected from 69 wards. Prior to 2018 elections were held three years out of every four, with a third of the council elected each time.
Lichfield District Council elections are held every four years. Lichfield District Council is the local authority for the non-metropolitan district of Lichfield in Staffordshire, England. Since the last boundary changes in 2015, 47 councillors have been elected from 22 wards.
Kirklees Council is the local authority for the metropolitan borough of Kirklees in West Yorkshire, England. Since the last boundary changes in 2004, the council has comprised 69 councillors representing 23 wards. Elections are held three years out of four, with one third of the councillors elected each time for a four-year term.
Bromsgrove District Council elections are held every four years. Bromsgrove District Council is the local authority for the non-metropolitan district of Bromsgrove in Worcestershire, England. Since the last boundary changes in 2015, 31 councillors are elected from 30 wards.
Sefton Metropolitan Borough Council elections are generally held three years out of every four, with a third of the council being elected each time. Sefton Metropolitan Borough Council, generally known as Sefton Council, is the local authority for the metropolitan borough of Sefton in Merseyside, England. Since the last boundary changes in 2004, 66 councillors have been elected from 22 wards.
The 1998 Sandwell Metropolitan Borough Council election took place on 7 May 1998 to elect members of Sandwell Metropolitan Borough Council in the West Midlands, England. One-third of the council was up for election and the Labour Party stayed in overall control of the council.
South Tyneside Council elections are generally held three years out of every four, with a third of the council being elected each time. South Tyneside Council is the local authority for the metropolitan borough of South Tyneside in Tyne and Wear, England. Since the last boundary changes in 2004, 54 councillors are elected, 3 from each of the 18 wards.
Walsall Metropolitan Borough Council elections are held three years out of every four, with a third of the council elected each time. Walsall Metropolitan Borough Council, which styles itself "Walsall Council", is the local authority for the metropolitan district of Walsall in the West Midlands, England. Since the last boundary changes in 2004, 60 councillors have been elected from 20 wards.
City of Wolverhampton Council elections are held three years out of every four, with a third of the council elected each time. City of Wolverhampton Council is the local authority for the metropolitan borough of Wolverhampton in the West Midlands, England. Since the boundary changes in 2004, 60 councillors have been elected from 20 wards.
Tamworth Borough Council elections are held three years out of every four, with a third of the council elected each time. Tamworth Borough Council is the local authority for the non-metropolitan district of Tamworth in Staffordshire, England. Since the last boundary changes in 2002, 30 councillors have been elected from 10 wards.
Redcar and Cleveland Borough Council is the local authority for the unitary authority of Redcar and Cleveland in North Yorkshire, England. Until 1 April 1996 it was a non-metropolitan district in Cleveland, called Langbaurgh.
The 1999 Sandwell Metropolitan Borough Council election took place on 6 May 1999 to elect members of Sandwell Metropolitan Borough Council in the West Midlands, England. One third of the council was up for election and the Labour party stayed in overall control of the council.
The 2000 Sandwell Metropolitan Borough Council election took place on 4 May 2000 to elect members of Sandwell Metropolitan Borough Council in the West Midlands, England. One third of the council was up for election and the Labour party stayed in overall control of the council.

The 2006 Sandwell Metropolitan Borough Council election took place on 4 May 2006 to elect members of Sandwell Metropolitan Borough Council in the West Midlands, England. One third of the council was up for election and the Labour Party stayed in overall control of the council.

The 2007 Sandwell Metropolitan Borough Council election took place on 3 May 2007 to elect members of Sandwell Metropolitan Borough Council in the West Midlands, England. One third of the council was up for election and the Labour Party stayed in overall control of the council.

The 2008 Sandwell Metropolitan Borough Council election took place on 1 May 2008 to elect members of Sandwell Metropolitan Borough Council in the West Midlands, England. One third of the council was up for election and the Labour Party stayed in overall control of the council.

The 2010 Sandwell Metropolitan Borough Council election took place on 6 May 2010 to elect members of Sandwell Metropolitan Borough Council in the West Midlands, England. One third of the council was up for election and the Labour Party stayed in overall control of the council.
The 2011 Sandwell Metropolitan Borough Council election took place on 5 May 2011 to elect members of Sandwell Metropolitan Borough Council in the West Midlands, England. One third of the council was up for election and the Labour Party stayed in overall control of the council.

The 2022 Sandwell Metropolitan Borough Council election took place on 5 May 2022 to elect members of Sandwell Metropolitan Borough Council. This was on the same day as other local elections. 24 of the 72 seats were up for election.
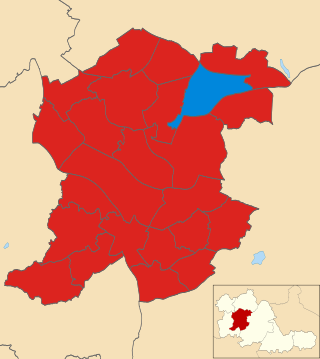
 2004 results map
 2006 results map
 2007 results map
 2008 results map
 2010 results map
 2011 results map
 2012 results map
 2014 results map
 2015 results map
 2016 results map
 2018 results map
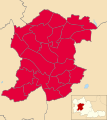 2019 results map
 2021 results map
 2022 results map
 2023 results map