Wind power in Australia

Last updated

Early morning at the 239 MW Lake Bonney Wind Farm. Lake Bonney wind farmDKC1.jpg
Early morning at the 239 MW Lake Bonney Wind Farm.

Wind power, a form of renewable energy harnessed through wind turbines, stands as a pivotal contributor to Australia's energy landscape. With a total installed wind capacity reaching approximately 9,100 megawatts (MW), [1] as of October 2023, wind power constitutes a significant portion, representing 5% of Australia's total primary energy supply and a substantial 35% of its renewable energy supply. [2] Australia's geographic disposition favors the proliferation of wind energy infrastructure, particularly in the southern regions of the nation and along the slopes of the Great Dividing Range in the east. Approximately half of Australia's wind farms are located near coastal regions. [3]

Contents

The Federal Government formally designated the Bass Strait off Gippsland as the country's inaugural offshore wind zone in December 2022. [4]

Wind resources

Map of wind resources in Australia Australia Wind Power Density Map.png
Map of wind resources in Australia

The abundant wind resources in Australia provide a major opportunity for the country to grow its renewable energy sector. The southern coastline lies in the roaring forties. Many sites have average wind speeds above 8–9 m/s at turbine hub height.

During the 1980s and 1990s, several states carried out a systematic monitoring of wind speed, which results are available to the public. Most tested sites are close to Australia's main population centres, making wind power a convenient resource for electricity generation.

Australian wind farms produce an average capacity factor range of 30–35%, making wind a viable option. South Australia's large share (along with nearby Victoria) means most of Australia's wind power occurs around the same time. The correlation between South Australia and New South Wales is 0.34, while the correlation between South Australia and Tasmania is 0.10.

Wind farms

As of October 2022, there were 94 operational wind farms in Australia, totaling 9,234 MW in capacity.[1]

The largest wind farm is Coopers Gap Wind Farm in Queensland, which began generating to the grid in June 2019, with a capacity of 453 MW.[2] As of December 2019, 50 Coopers Gap Wind Farm's turbines out of the initial 123 were operational.[3]

By generating capacity, the ten largest wind farms in Australia are:

No.ProjectStateCapacity (MW)
1MacIntyre Wind Farm Project (expected completion 2024)Queensland1026
2 Coopers Gap Wind Farm Queensland453
3 Macarthur Wind Farm Victoria420
4 Snowtown Wind Farm South Australia369
5 Hallett Wind Farm South Australia351
6 Hornsdale Wind Farm South Australia315
7 Lake Bonney Wind Farm South Australia278
7 Sapphire Wind Farm [5] New South Wales270
8 Ararat Wind Farm [6] Victoria240
9 Murra Warra Wind Farm Victoria226
10 Collgar Wind Farm Western Australia222

Australia's first commercial wind farm, Salmon Beach Wind Farm, near Esperanza in Western Australia, operated for 15 years from 1987 but was decommissioned due to urban encroachment. It has since been replaced by Ten Mile Lagoon Wind Farm and Nine Mile Beach Wind Farm. [7]

Wind power by state

Wattle Point wind farm near Edithburgh, South Australia Wattle Point wind farm.jpg
Wattle Point wind farm near Edithburgh, South Australia

A full listing of all the wind farms in Australia can be found in the List of wind farms in Australia. Relevant state articles are:

Installed capacity by state

The following figures are based on capacity and generation as of the end of 2020. [8] Proposed figures are updated to December 2020. [9] [10] [11]

Note that figures may not agree with aggregate figures previously stated, due to different data sources and reporting dates contained within them.

#State /

Territory

Wind Power CapacityProposed
Installed capacityUnder construction or committed
ProjectsTurbinesTotal MWPenetration (%) [12] [13] ProjectsTotal MW
1 Victoria 311,0042,61013.3101,537
2 South Australia 248202,05341.5186
3 New South Wales 206981,9026.84729
4 Western Australia 16 ?63812.94746
5 Tasmania 519456314.200
6 Queensland 2731932.14826
Australia982,789+7,9599.9233,924

In 2019, South Australia supplied 29.2% of Australia's wind power, fulfilling 41% of the state's electricity requirements. By the end of 2011, wind power generation in South Australia had reached 26%, surpassing coal-fired power for the first time. At that point, despite comprising only 7.2% of Australia's population, South Australia possessed 54% of the country's installed wind capacity.

Victoria also possesses a significant system, contributing 27.8% of Australia's wind power in 2019. In August 2015, the Victorian government announced financial support for new wind farms as part of an initiative to promote renewable energy within the state. This initiative aimed to expedite the construction of a modest 100 MW of new wind energy, representing a $200 million investment. The government estimated that 2400 MW worth of Victorian projects had been approved but remained unbuilt.

Installed capacity (nameplate) refers to the theoretical maximum capacity of the engineered design under perfect operating conditions. The accepted AEMO rating is the capacity factor rating that accounts for approximately 30 to 35 percent of the installed or nameplate capacity. Additionally, depending on the location of the wind turbine, there may be energy losses in the feeder transmission line, which vary based on its length, before reaching the main electricity grid.

Economics

Cullerin Range Wind Farm in New South Wales. Cullerin Range Wind Farm, New South Wales, Australia 02.jpg
Cullerin Range Wind Farm in New South Wales.

Wind developments typically entail substantial upfront capital costs, with comparatively lower operating expenses. Nevertheless, maintenance costs can accumulate over time due to the necessity for periodic replacement of components susceptible to wear.

In contrast, conventional energy sources such as gas and coal demand significant initial capital investments and incur ongoing operating costs. Gas and coal power stations also generally have much longer operational lifespans compared to wind turbines. When adequately maintained, coal and gas plants can remain operational for up to three times longer than wind turbines.

Despite these complexities, existing data indicate that wind energy is one of the most cost-efficient renewable energy sources but approximately two times the cost of coal-generated power in 2006.[1] When the costs associated with pollution were factored in, it was competitive with coal- and gas-fired power stations even then. By 2014, wind had the lowest levelised cost of energy (LCOE) of any power source in Australia. [14]

A 2012 study by SKM on the economic benefits of wind farms in Australia [15] found that, for every 50 MW in capacity, a wind farm delivered the following benefits:

Environmental impact

Waubra Wind Farm in Victoria. Waubra Wind Farm-2.jpg
Waubra Wind Farm in Victoria.

Australia is the fifth highest per capita emitter of greenhouse gases with 25.8 tonne CO2-e per person annually, ranking first of the industrialized countries, and ranks sixteenth of all countries in total country emissions with 495 Mt CO2-e per annum. [16] It is one of the major exporters of coal, the burning of which releases CO2 into the atmosphere. It is also one of the countries most at risk from climate change according to the Stern report. This is partially because of the size of its agriculture sector and long coastline.

A wind farm, when installed on agricultural land, has one of the lowest environmental impacts of all energy sources: [17]

Landscape and heritage issues can be a significant issue for certain wind farms. However, these are minimal when compared with the environmental effects of coal. However, when appropriate planning procedures are followed, the heritage and landscape risks should be minimal. People may still object to wind farms, perhaps on the grounds of aesthetics, but their concerns should be weighed against the need to address the threats posed by climate change and the opinions of the broader community. [18]

Overseas experience has shown that community consultation and direct involvement of the general public in wind farm projects have helped to increase community approval. [19] Some wind farms become tourist attractions. [20]

The Garnaut Climate Change Review, the Carbon Pollution Reduction Scheme and the Mandatory Renewable Energy Target announced by the Australian Government involve a reduction in Australian greenhouse gas emissions. Australia is the highest emitter of greenhouse gases per capita in the developed world [21] [22] and wind power is well placed to grow and deliver greenhouse gas emission cuts on a cost-competitive basis. A typical 50-megawatt (MW) wind farm in Australia can reduce greenhouse gas emissions by between 65,000 and 115,000 tonnes a year. [23]

Based on the 2010 figures for electricity production of 5 TWh nationally, it is estimated that wind power saved Australia 5,100,000 tonnes of CO2 emissions in that year. In relative terms, that is calculated to be the equivalent of removing 1,133,000 cars from the nation's roads. [24]

Politics

From 2001 to early 2006, the main driving force for the establishment of wind farms in Australia was the Government's Mandatory Renewable Energy Target (MRET). [25] [26] However, by mid-2006, sufficient renewable energy had been installed or was under construction to meet the small MRET target for 2010. Also, in 2006, several Federal Government Ministers spoke out against several wind farm proposals. [26]

Mark Diesendorf has suggested that the Australian Government has tried to stop the development of wind power, the lowest-cost, new, renewable electricity source until coal-fired power stations with CO2 capture and sequestration and possibly nuclear power stations were available. However, "clean coal" technologies may not be commercially available for at least 20 years. Furthermore, to bring down the high cost of nuclear power to a level where it could compete with wind power would require a new generation of nuclear power stations that is still on the drawing board, which could take at least 15 years. [26]

In November 2007, when the Rudd (Labor) government was elected in Australia, it ratified Australia's commitment to the Kyoto Protocol, promised a target of 20% renewable power by 2020 and to do more to reduce Australia's greenhouse gas emissions. As a result, several new wind power projects were proposed in anticipation of an expanded MRET.

Major wind projects

In January 2022, construction began on the Goyder South development, which is expected to become one of Australia’s largest wind farms. Run by French firm Neoen, the project expects to be able to provide 209 MW of power generation by 2024, and a similar amount again when construction is complete. [27]

In south east Queensland, Australia’s first gigawattscale wind project is in development: the MacIntrye facility (923 MW), majority owned by Spanish energy firm Acciona, and the Karara Wind Farm (103 MW), owned and operated by CleanCo. [27]

As of April 2023, one of the most significant wind projects underway in Victoria is the 756 MW stage one of the Golden Plains development in Rokewood. [27]

See also

Related Research Articles

<span class="mw-page-title-main">Electricity generation</span> Process of generating electrical power

Electricity generation is the process of generating electric power from sources of primary energy. For utilities in the electric power industry, it is the stage prior to its delivery to end users or its storage, using for example, the pumped-storage method.

<span class="mw-page-title-main">Environmental impact of electricity generation</span>

Electric power systems consist of generation plants of different energy sources, transmission networks, and distribution lines. Each of these components can have environmental impacts at multiple stages of their development and use including in their construction, during the generation of electricity, and in their decommissioning and disposal. These impacts can be split into operational impacts and construction impacts. All forms of electricity generation have some form of environmental impact, but coal-fired power is the dirtiest. This page is organized by energy source and includes impacts such as water usage, emissions, local pollution, and wildlife displacement.
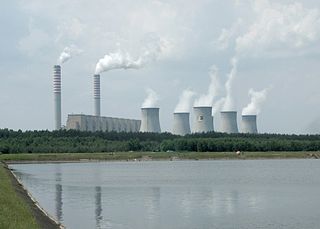
<span class="mw-page-title-main">Fossil fuel power station</span> Facility that burns fossil fuels to produce electricity

A fossil fuel power station is a thermal power station which burns a fossil fuel, such as coal or natural gas, to produce electricity. Fossil fuel power stations have machinery to convert the heat energy of combustion into mechanical energy, which then operates an electrical generator. The prime mover may be a steam turbine, a gas turbine or, in small plants, a reciprocating gas engine. All plants use the energy extracted from the expansion of a hot gas, either steam or combustion gases. Although different energy conversion methods exist, all thermal power station conversion methods have their efficiency limited by the Carnot efficiency and therefore produce waste heat.

<span class="mw-page-title-main">AGL Energy</span> Australian electricity generator and retailer

AGL Energy Ltd is an Australian listed public company involved in both the generation and retailing of electricity and gas for residential and commercial use. AGL is Australia's largest electricity generator, and the nation's largest carbon emitter. In 2022, 83% of its energy came from burning coal. It produces more emissions as a single company than the nations of New Zealand, Portugal or Sweden, according to its largest shareholder, Mike Cannon-Brookes, who named it "one of the most toxic companies on the planet".

<span class="mw-page-title-main">Solar power in Australia</span>

Solar power is a major contributor to electricity supply in Australia. As of December 2023, Australia's over 3.69 million solar PV installations had a combined capacity of 34.2 GW photovoltaic (PV) solar power. In 2019, 59 solar PV projects with a combined capacity of 2,881 MW were either under construction, constructed or due to start construction having reached financial closure. Solar accounted for 12.4% of Australia's total electrical energy production in 2021.

<span class="mw-page-title-main">Energy policy of Australia</span> Overview of the energy policy of Australia

The energy policy of Australia is subject to the regulatory and fiscal influence of all three levels of government in Australia, although only the State and Federal levels determine policy for primary industries such as coal. Federal policies for energy in Australia continue to support the coal mining and natural gas industries through subsidies for fossil fuel use and production. Australia is the 10th most coal-dependent country in the world. Coal and natural gas, along with oil-based products, are currently the primary sources of Australian energy usage and the coal industry produces over 30% of Australia's total greenhouse gas emissions. In 2018 Australia was the 8th highest emitter of greenhouse gases per capita in the world.

<span class="mw-page-title-main">Wind power in South Australia</span> South Australian use of wind turbines to generate electricity

Wind power became a significant energy source within South Australia over the first two decades of the 21st century. In 2015, there was an installed capacity of 1,475 MW, which accounted for 34% of electricity production in the state. This accounted for 35% of Australia's installed wind power capacity. In 2021, there was an installed capacity of 2052.95 MW, which accounted for 42.1% of the electricity production in the state in 2020.

<span class="mw-page-title-main">Renewable energy in Australia</span>

Renewable energy in Australia is mainly based on biomass, solar, wind, and hydro generation. Over a third of electricity is generated from renewables, and is increasing, with a target to phase out coal power before 2040. Wind energy and rooftop solar have particularly grown since 2010. The growth has been stimulated by government energy policy in order to limit the rate of climate change in Australia that has been brought about by the use of fossil fuels. Pros and cons of various types of renewable energy are being investigated, and more recently there have been trials of green hydrogen and wave power.

<span class="mw-page-title-main">Gas-fired power plant</span> One or more generators which convert natural gas into electricity

A gas-fired power plant, sometimes referred to as gas-fired power station, natural gas power plant, or methane gas power plant, is a thermal power station that burns natural gas to generate electricity. Gas-fired power plants generate almost a quarter of world electricity and are significant sources of greenhouse gas emissions. However, they can provide seasonal, dispatchable energy generation to compensate for variable renewable energy deficits, where hydropower or interconnectors are not available. In the early 2020s batteries became competitive with gas peaker plants.

<span class="mw-page-title-main">Newport Power Station</span>

The Newport Power Station was a complex of power stations located on the west bank of the Yarra River, approximately 6 km south-west of Melbourne, Victoria, Australia, in the suburb of Newport. Newport A, B, and C were coal-fired plants which operated at the site between 1919 and the 1980s, and were claimed to be the largest power station in the southern hemisphere in 1953 with 42 boilers and 14 turbo-alternators producing 327 megawatts (439,000 hp).
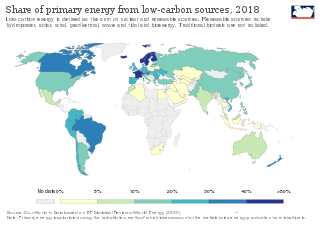
<span class="mw-page-title-main">Low-carbon electricity</span> Power produced with lower carbon dioxide emissions

Low-carbon electricity or low-carbon power is electricity produced with substantially lower greenhouse gas emissions over the entire lifecycle than power generation using fossil fuels. The energy transition to low-carbon power is one of the most important actions required to limit climate change.

As of 2021 the island of Ireland has 5,585 megawatt and the Republic of Ireland has 4,309 MW of installed wind power nameplate capacity, the third highest per capita in the world. In 2020 wind turbines generated 36.3% of Ireland's electrical demand, one of the highest wind power penetrations in the world.

<span class="mw-page-title-main">Greenhouse gas emissions by Australia</span> Release of gases from Australia which contribute to global warming

Greenhouse gas emissions by Australia totalled 533 million tonnes CO2-equivalent based on greenhouse gas national inventory report data for 2019; representing per capita CO2e emissions of 21 tons, three times the global average. Coal was responsible for 30% of emissions. The national Greenhouse Gas Inventory estimates for the year to March 2021 were 494.2 million tonnes, which is 27.8 million tonnes, or 5.3%, lower than the previous year. It is 20.8% lower than in 2005. According to the government, the result reflects the decrease in transport emissions due to COVID-19 pandemic restrictions, reduced fugitive emissions, and reductions in emissions from electricity; however, there were increased greenhouse gas emissions from the land and agriculture sectors.

<span class="mw-page-title-main">Energy in Australia</span> Overview of the production, consumption, import and export of energy and electricity in Australia

Energy in Australia is the production in Australia of energy and electricity, for consumption or export. Energy policy of Australia describes the politics of Australia as it relates to energy.

The Macarthur Wind Farm is a wind farm located in Macarthur, Victoria, Australia, near Hamilton, 260 km west of Melbourne. It is on a 5,500 ha site which has an installed capacity of 420 megawatts (MW). Based on a capacity factor of around 35%, it is estimated that the long-term average generation will be approximately 1,250 GWh per year. Its actual capacity factor is much lower, with a historical average of 26.29% since 2013.

<span class="mw-page-title-main">Renewable energy debate</span>

Policy makers often debate the constraints and opportunities of renewable energy.

<span class="mw-page-title-main">Energy in Spain</span> Overview of the production, consumption, import and export of energy and electricity in Spain

Primary energy consumption in Spain in 2020 was mainly composed of renewable sources. The largest sources are petroleum (42.3%), natural gas (19.8%) and coal (11.6%). The remaining 26.3% is accounted for by nuclear energy (12%) and different renewable energy sources (14.3%). Domestic production of primary energy includes nuclear (44,8%), solar, wind and geothermal (22,4%), biomass and waste (21,1%), hydropower (7,2%) and fossil (4,5%).

South Australia is a leader in utility-scale renewable energy generation, and also produces gas and uranium for electricity generation. Gas production is mostly concentrated in the Cooper Basin in the state's north-east. Gas is delivered from these fields by pipeline to users interstate and to Port Adelaide where it fuels three separate gas-fired power plants. Uranium is also mined in South Australia, though nuclear power generation is prohibited nationally. The Olympic Dam mine is the world's single largest known deposit of uranium and represents 30% of the world's total uranium resource. Many utility-scale wind farms and solar farms have been commissioned during the 21st century and geology with potential for geothermal energy has also been identified but is yet to be developed.

<span class="mw-page-title-main">Renewable energy in Bangladesh</span>

Renewable energy in Bangladesh refers to the use of renewable energy to generate electricity in Bangladesh. The current renewable energy comes from biogas that is originated from biomass, hydro power, solar and wind.

<span class="mw-page-title-main">Electricity sector in Australia</span>

The electricity sector in Australia has been historically dominated by coal-fired power stations, but renewables are forming a rapidly growing fraction of supply. In 2021, Australia's electricity production reached 265 TWh, with coal accounting for 52.9% and natural gas for 18.8%. Renewable sources, comprising solar, wind, hydro, and bioenergy with waste, collectively made up 26.7% of the total electricity generation mix.

References

  1. "Wind energy". Australian Trade and Investment Commission. Retrieved 13 October 2023.
  2. Ritchie, Hannah; Roser, Max; Rosado, Pablo (27 October 2022). "Energy". Our World in Data.
  3. Harvey, Nick; Dew, Romana E. C.; Hender, Sarah (1 February 2017). "Rapid land use change by coastal wind farm development: Australian policies, politics and planning". Land Use Policy. 61: 368–378. doi:10.1016/j.landusepol.2016.11.031. ISSN   0264-8377.
  4. The Hon Chris Bowen MP (19 December 2022). "Joint media release: Unlocking the power of offshore wind in Gippsland". Department of Climate Change, Energy, the Environment and Water Ministers. Retrieved 13 October 2023.
  5. "Sapphire – A New Future". sapphirewindfarm.com.au. Retrieved 9 February 2019.
  6. "Ararat Wind Farm Powering Ahead | Premier of Victoria".
  7. "Walking in the wind". Clean Energy Council. Retrieved 17 October 2023.
  8. "Clean Energy Australia Report 2021" (PDF). Clean Energy Council.
  9. "Clean Energy Projects Australia | Clean Energy Council". www.cleanenergycouncil.org.au. Retrieved 4 April 2019.
  10. "NEM Generation Information October 2021 | AEMO". www.aemo.com.au. Retrieved 8 November 2021.
  11. "Wind Map of Australia 2020 | EcoGeneration" (PDF). www.ecogeneration.com.au/. Retrieved 8 November 2021.
  12. "OpenNEM: An Open Platform for National Electricity Market Data". opennem.org.au. Retrieved 4 April 2019.
  13. "WEM Data Dashboard". aemo.com.au. Retrieved 4 April 2019.
  14. CSIRO. "Understanding the cost of Australia's energy transition". www.csiro.au. Retrieved 6 April 2024.
  15. "Landmark report shows economic benefits of wind farms". www.sustainabilitymatters.net.au. Retrieved 17 October 2023.
  16. World Resources Institute
  17. 1 2 Why Australia needs wind power
  18. The Australia Institute (2006).Wind Farms The facts and the fallacies Discussion Paper Number 91, October, ISSN   1322-5421
  19. "The world's leader in Wind Power". scandinavica.com. Retrieved 17 April 2018.
  20. Ten Mile Lagoon Wind Farm
  21. "Global Warming: The Facts". cana.net.au. Retrieved 17 April 2018.
  22. "Australia tops greenhouse pollution index – Environment". The Sydney Morning Herald. 19 June 2004. Retrieved 17 April 2018.
  23. "National code for wind farms" (PDF). greenhouse.gov.au. Retrieved 17 April 2018.
  24. "Technologies: Wind: Wind Energy – how it works". cleanenergycouncil.org.au. 2011. Retrieved 12 June 2011.
  25. Lovegrove, Keith. Election 2004: The Government’s non policy on energy Australian Review of Public Affairs, 10 September 2004.
  26. 1 2 3 Diesendorf, Mark (2007). Greenhouse Solutions with Sustainable Energy, UNSW Press, p. 107.
  27. 1 2 3 Thornton, Kane (April 2023). "CLEAN ENERGY AUSTRALIA REPORT 2023" (PDF). Clean Energy Council. Retrieved 30 October 2023.