Demographics of Saudi Arabia

Last updated
Demographics of Saudi Arabia
Saudi Arabia single age population pyramid 2020.png
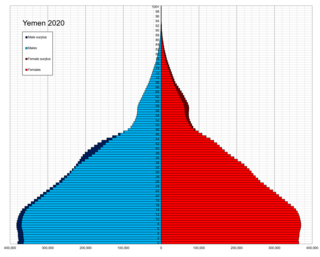
Saudi Arabia population pyramid in 2020
Population32,175,224 (Saudi Census 2022)
Density14.967 people per sq. km of land (2022) [1]
Growth rate1.49% (2019) [2]
Birth rate13.9 births/1,000 population (2023) [3]
Death rate3.45 deaths/1,000 population
Life expectancy76.91 years
  male75.33 years
  female78.56 years
Fertility rate2.14 children born/woman (2022) [4]
Net migration rate590,000 (2017) [5]
Age structure
0–14 years24.44%
15–64 years72.36%
65 and over3.20%
Nationality
Nationality Saudis
Major ethnic Arabs
Language
OfficialArabic
SpokenArabic
Demographics of Saudi Arabia, Data of FAO, year 2005; Number of inhabitants in thousands. Saudi-Arabia-demography.png
Demographics of Saudi Arabia, Data of FAO, year 2005; Number of inhabitants in thousands.

Saudi Arabia is the fourth largest state in the Arab world, with a reported population of 32,175,224 as of 2022. [6] [7] 41.6% of inhabitants are immigrants. [8] Saudi Arabia has experienced a population explosion in the last 40 years, [9] and continues to grow at a rate of 1.62% per year. [8]

Contents

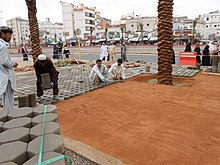
Until the 1960s, most of the population was nomadic or semi-nomadic; due to rapid economic and urban growth, more than 95% of the population is now settled. 80% of Saudis live in ten major urban centers: Riyadh, Jeddah, Mecca, Medina, Hofuf, Ta'if, Buraydah, Khobar, Yanbu, Dhahran, and Dammam. [10] Some cities and oases have densities of more than 1,000 people per square kilometer. Saudi Arabia's population is characterized by rapid growth, far more men than women, and a large cohort of youths.

Saudi Arabia hosts one of the pillars of Islam, which obliges all Muslims to make the Hajj, or pilgrimage to Mecca, at least once during their lifetime if they are able to do so. The cultural environment in Saudi Arabia is highly conservative; the country adheres to the interpretation of Islamic religious law (Sharia). Cultural presentations must conform to narrowly defined standards of ethics.

Most citizens of Saudi Arabia are ethnically Arabs, the majority of whom are tribal. However, more than 40% of Saudi Arabia's population are non-citizens. [11] According to a random survey, most non-citizens living in Saudi Arabia come from the Indian Subcontinent and Arab countries. [12] Many Arabs from nearby countries are employed in the country, particularly Egyptians, [13] as the Egyptian community developed from the 1950s onwards. [14] There also are significant numbers of Asian expatriates, mostly from India, Pakistan, Bangladesh, Indonesia, Philippines, Syria and Yemen. In the 1970s and 1980s, there was also a significant community of South Korean migrant labourers, numbering in the hundreds of thousands, but due rapid economic growth and development in South Korea, most have since returned home; the South Korean government's statistics showed only 1,200 of their nationals living in Saudi Arabia (most of them being professionals and business personnels) as of 2005. [15] [16] There are more than 100,000 Westerners in Saudi Arabia, most of whom live in private compounds in the major cities such as Riyadh, Jeddah, Yanbu and Dhahran. The government prohibits non-Muslims from entering the cities of Mecca.

Population

A graph showing the historical population of Saudi Arabia Historical population of Saudi Arabia.svg
A graph showing the historical population of Saudi Arabia
Historical population
YearPop.±%
01,000,000    
6002,500,000+150.0%
10002,000,000−20.0%
15002,000,000+0.0%
18002,000,000+0.0%
19002,140,000+7.0%
19503,121,000+45.8%
19604,041,000+29.5%
19705,772,000+42.8%
19809,801,000+69.8%
199016,139,000+64.7%
200020,045,000+24.2%
201027,448,000+36.9%
202032,013,414+16.6%
Source: [17] [18]

As of 2022, the country had a reported population of 32,175,224. [19]

Structure

The following data has been retrieved from the CIA World Factbook as of 2020:

Population age distribution

0–14 years: 24.84%

15–24 years: 15.38%

25–54 years: 50.2%

55–64 years: 5.95%

65 years and over: 3.63%

Sex ratios

Population pyramid 2017 Saudipop.svg
Population pyramid 2017

at birth: 1.05 male(s)/female

0–14 years: 1.04 male(s)/female

15–24 years: 1.09 male(s)/female

25–54 years: 1.52 male(s)/female

55–64 years: 1.61 male(s)/female

65 years and over: 1.12 male(s)/female

According to the CIA World Factbook the population of Saudi Arabia has a large young population ages 0–19 years and an increasing middle-age population ages 20–35 years. [8] With a growing population reaching adulthood, global economists and the Saudi government have become concerned that there are more Saudis seeking jobs than are available. [20] The nation has also seen a rise in its older population as life expectancy has risen throughout the last 40 years. [20]

Life expectancy at birth

Life expectancy in Saudi Arabia Life expectancy in Saudi Arabia.svg
Life expectancy in Saudi Arabia

The following data has been retrieved from the CIA World Factbook as of 2018.

Total population:

Male: 74.2 years

Female: 77.3 years

Density

Population Density: 15.322 people per km2 of land (2017) [1]

Vital statistics

Births and deaths [21] [22] [23]

YearPopulationLive birthsDeathsNatural increaseCrude birth rateCrude death rateRate of natural increaseTFRSaudi TFRNon-Saudi TFR
201125,091,8672.8143.7921.309
201226,168,8612.7973.7351.370
201327,624,0042.6893.6411.351
201428,309,2732.6953.6251.380
201529,816,3822.6463.5201.440
201630,954,1982.6653.4701.577
201730,977,3552.6863.4621.681
201830,196,2812.6833.3831.659
201930,063,7992.5103.1631.482
202031,552,5102.2892.9851.167
202130,784,3832.1892.7921.072
202232,175,224484,719 [24] 15.12.1352.7980.905

Population Estimates by Sex and Age Group (01.VII.2020) (Provisional Estimates): [25]

Age GroupMaleFemaleTotal%
Total20 231 42514 781 98935 013 414100
0–41 477 5231 421 6562 899 1798.28
5–91 536 8431 479 5093 016 3528.61
10–141 343 6591 297 3032 640 9627.54
15–191 228 9391 177 5512 406 4906.87
20–241 429 0721 248 9762 678 0487.65
25–291 850 7131 492 5333 343 2469.55
30–342 002 3571 393 1213 395 4789.70
35–392 394 3631 414 2663 808 62910.88
40–442 181 2091 227 2153 408 4249.73
45–491 676 347850 1772 526 5247.22
50–541 208 823549 7021 758 5255.02
55–59807 534404 7011 212 2353.46
60–64500 209296 964797 1732.28
65-69241 585201 494443 0791.27
70-74153 697140 182293 8790.84
75-7994 13482 602176 7360.50
80+104 418104 037208 4550.60
Age groupMaleFemaleTotalPercent
0–144 358 0254 198 4688 556 49324.44
15–6415 279 56610 055 20625 334 77272.36
65+593 834528 3151 122 1493.20

The following data has been retrieved from the CIA World Factbook as of 2020:

Saudi Arabia is ranked 111th in comparison to the world with a birth rate of 18.51 births per 1,000 people in 2019. [8] The nation's death rate is ranked 220th worldwide with 3.3 deaths per 1,000 people. [8] Although birth rates have decreased in the last two decades, rates of decline fail to match the significant decline in death rates. [27] Because of this, Saudi Arabia has experienced a population explosion in the last 40 years, [9] and continues to grow at a rate of 1.63% per year. [8] Saudi Arabia's population growth continues to be 0.295% higher than population growth rates in the Middle East and North Africa. [28] Infant mortality rates have declined dramatically in the past twenty years from 25.3 deaths per 1,000 live births in 1995 to 6.3 deaths in 2017, according to the World Bank. [29] Saudi Arabia has a substantially lower infant mortality rate in comparison to the Middle East and North Africa region, which continues to face a high of 19.3 deaths for every 1,000 live births as of 2017. This significant reduction can be attributed to rising access to modern healthcare across the country, ranking 26th worldwide for healthcare system quality. [30] The construction of new hospitals and primary healthcare centers across the Kingdom, as well as healthcare during pregnancy and increased use of vaccinations account for a decline in infant mortality and increased life expectancy. [31]

UN estimates

The Population Department of the United Nations prepared the following estimates. Population estimates account for under numeration in population censuses. [32]

Mid-year population (thousands)Live births (thousands)Deaths (thousands)Natural change (thousands)Crude birth rate (per 1000)Crude death rate (per 1000)Natural change (per 1000) Total fertility rate (TFR) Infant mortality (per 1000 live births) Life expectancy (in years)
19503 090  165  77  8853.324.828.57.58196.440.99
1951  3 184  169  79  9053.224.928.37.58194.741.21
1952  3 279  174  80  9352.924.528.47.58191.441.73
1953  3 377  178  81  9752.824.128.67.59188.042.29
1954  3 478  183  82  10052.523.728.87.59184.742.84
1955  3 582  187  83  10452.323.329.17.59181.543.33
1956  3 690  192  84  10852.022.829.37.59178.243.87
1957  3 802  197  85  11251.922.329.57.60175.044.41
1958  3 917  202  86  11751.621.929.87.60171.744.88
1959  4 037  208  87  12151.521.530.07.62168.545.34
1960  4 166  214  87  12651.321.030.47.63165.345.94
1961  4 306  220  88  13251.220.530.77.63162.046.48
1962  4 459  227  89  13851.020.031.17.64158.847.10
1963  4 622  235  90  14551.019.531.57.65155.447.61
1964  4 795  244  91  15351.019.131.97.67151.948.15
1965  4 979  252  92  16050.818.532.27.66148.148.78
1966  5 173  261  93  16850.618.132.67.66144.049.34
1967  5 381  271  94  17850.617.533.17.66139.550.05
1968  5 605  281  94  18750.316.833.57.63134.550.92
1969  5 845  291  94  19850.016.133.97.60129.251.82
1970  6 106  303  93  20949.815.434.57.58123.652.72
1971  6 397  315  93  22349.614.635.07.56117.853.77
1972  6 724  330  92  23749.413.835.67.54111.854.79
1973  7 089  345  91  25349.013.036.07.48105.655.93
1974  7 484  361  91  27048.612.236.47.4399.657.02
1975  7 898  378  90  28748.211.536.77.3794.158.07
1976  8 320  387  90  29746.910.836.07.3388.658.97
1977  8 755  397  88  30945.710.135.67.3083.559.95
1978  9 211  409  87  32244.79.535.37.2678.760.87
1979  9 682  422  86  33643.98.935.07.2374.161.70
1980  10 172  436  84  35243.28.334.97.1969.662.70
1981  10 678  450  83  36742.57.834.67.1365.463.47
1982  11 201  464  82  38341.77.334.47.0561.464.30
1983  11 746  478  81  39841.06.934.16.9557.665.05
1984  12 310  492  80  41240.26.633.66.8454.065.69
1985  12 890  504  80  42439.36.233.16.7050.666.33
1986  13 483  514  79  43538.45.932.56.5547.366.92
1987  14 090  523  79  44437.35.631.76.3644.167.40
1988  14 714  533  78  45536.45.331.16.1741.167.97
1989  15 353  541  77  46335.45.130.46.0038.368.49
1990  16 005  547  77  47034.44.829.65.8335.668.95
1991  16 654  554  77  47733.44.728.85.6633.169.37
1992  17 281  558  76  48232.44.428.05.4930.969.93
1993  17 846  563  76  48731.54.327.35.3228.870.30
1994  18 368  564  75  48930.84.126.75.1426.970.71
1995  18 889  566  75  49130.04.026.04.9525.271.01
1996  19 410  570  75  49529.43.925.54.7723.671.27
1997  19 938  576  76  50028.93.825.14.5922.171.48
1998  20 473  582  75  50728.53.724.84.4220.871.88
1999  21 010  588  75  51328.03.624.44.2519.672.14
2000  21 547  596  75  52127.73.524.24.1218.572.47
2001  22 086  593  73  51926.93.323.53.9117.572.97
2002  22 623  586  73  51325.93.222.73.7116.573.34
2003  23 151  574  72  50224.83.121.73.5015.673.63
2004  23 662  563  70  49323.83.020.83.3414.874.15
2005  24 398  557  70  48723.12.920.23.2414.074.59
2006  25 383  581  70  51123.12.820.33.2113.274.81
2007  26 400  608  71  53723.22.720.53.1812.575.05
2008  27 437  619  72  54722.72.620.13.0611.875.27
2009  28 484  630  73  55722.32.619.72.9511.275.43
2010  29 412  641  73  56821.92.519.42.8510.575.76
2011  30 151  651  73  57921.62.419.22.819.876.23
2012  30 822  654  7458021.22.418.82.789.376.46
2013  31 482  653  77  57620.82.418.32.748.876.63
2014  32 126  647  80  56720.22.517.72.698.276.76
2015  32 750  639  83  55619.52.517.02.647.876.92
2016  33 416  632  87  54519.02.616.42.597.377.06
2017  34 193  644  90  55418.92.616.32.586.977.16
2018  35 018  653  93  56018.72.716.02.556.677.21
2019  35 827  659  95  56418.52.715.82.506.377.30
202035 997666106  56018.22.915.32.476.076.24
2021  35 950  629  103  52617.52.914.62.435.776.94

Nationality and ethnicity

Nationality

noun: Saudi(s)
adjective: Saudi or Saudi Arabian

Ethnicity

Ethnic makeup of Saudi citizens in Saudi Arabia [33]
Ethnic groups
Arabs
90%
Afro-Arabs
10%

The ethnic composition of Saudi citizens is 90% Arabs and 10% Afro-Arabs. [33] However, 38.3% of inhabitants (about 13.3 million people) are non-citizens, [8] most of them are migrant workers. [34]

Urbanization

The following data has been retrieved from the CIA World Factbook: [35]

Urban population: 85% of total population (2023)

Rate of urbanization: 1.69% annual rate of change (2020–25 est.)

Historically, some of the population of Saudi Arabia followed a nomadic lifestyle, while most lived in villages and small towns ran by emirs. Following the discovery of oil in the 1930s, the Kingdom became far more settled as people moved to centers of high economic activity. [8] Significant population growth can be seen in the rise of urbanization throughout Saudi Arabia, which has grown 2 percent in the past ten years. [36] The largest Saudi cities have become flooded with new residents as more people move to urban cities to find better employment opportunities, and overcrowding has become a major issue across the nation. [36]

Migration

Pakistani workers at Al Masjid Nabawi (the Prophet's Mosque) in Medina Al Masjid Nabavi Madina pakistani labor - panoramio.jpg
Pakistani workers at Al Masjid Nabawi (the Prophet's Mosque) in Medina

Migration is a significant part of Saudi Arabia's tradition and culture, as the nation's thriving oil economy attracts large numbers of foreign workers from an assortment of countries throughout Asia and the Arab world. [26] Following economic diversification in response to the oil boom of the 1970s, the Saudi government encouraged skilled and semi-skilled workers to enter the Kingdom as the demand for infrastructure and development intensified. [37] Saudi Arabia is among the top five immigrant destination countries around the world, currently hosting 5.3 million international migrants in its borders. In 2017, non-native residents accounted for 38% of the Kingdom's total population, more than twice that of the United States whose immigrants make up 15% of the nation's total population. [38] The majority of Saudi Arabia's foreign born population are males between the ages of 25 and 45. These immigrants make up a larger percentage of the total population in this age group compared to native-born Saudis ages 25–45, according to the United Nations 2013 report. [39] 26.3% of the total migrant population in Saudi Arabia are from India, followed by Pakistan (24.2%), Bangladesh (19.5%), Egypt (19.3%), and finally the Philippines (15.3%). [39] Most immigrants of the Kingdom are skilled, unskilled, and service industry foreign workers. Although the living and working conditions for immigrant workers are harsh in Saudi Arabia, economic opportunity tends to be much greater than in their homelands. [26] There are around five million illegal immigrants in Saudi Arabia, most of which come from Africa and Asia. These immigrants are planned to be deported within the next few years. [40] There are over 118,000 Westerners in Saudi Arabia, most of whom live in compounds or gated communities. [41]

People from other immigration jurisdictions

NationalityResidents
Flag of Egypt.svg Egypt 2,700,000 [42]
Flag of Pakistan.svg Pakistan 2,700,000 [43]
Flag of India.svg India 2,592,166 [44]
Flag of Bangladesh.svg Bangladesh 2,500,000 [45]
Flag of Yemen.svg Yemen >2,000,000 [46]
Flag of Syria.svg Syria 2,500,000 [47] [48]
Flag of Indonesia.svg Indonesia 1,500,000 [49]
Flag of the Philippines.svg Philippines 938,490 [50]
Flag of Sudan.svg Sudan 819,600 [51]
Flag of Myanmar.svg Myanmar 500,000 (Rohingya) [52] [53]
Flag of Jordan.svg Jordan 430,000 [54]
Flag of Sri Lanka.svg Sri Lanka 400,000 [55]
Flag of Turkey.svg Turkey 220,000 (2019*)[ citation needed ]
Flag of Nepal.svg Nepal 215,000 [56]
Flag of Somalia.svg Somalia 165,000 (1991*) [57]
Flag of Lebanon.svg Lebanon 100,000 [58]

Religion

Religions of Saudi Arabia (2012 ) [33]
Religionspercent
Sunni Islam
90%
Shia Islam
10%

The government does not ask about religion on their census surveys. However, according to official statistics, in 2020, 85-90% of Saudi Arabian citizens were Sunni Muslims, 10-12% are Shia. [59] The rest are other forms of Islamic minorities. Other smaller communities reside in the south, with Ismaili Shia's constituting around half of the population of the province of Nejran, and a small percentage of the Holy Islamic cities of Mecca and Medina.

In 2022, there is a Christian population in the country of approximately 2.1 million; there are also groups of Hindus, Buddhists and Sikhs in the country. [60]

According to a poll in 2013 by WIN-Gallup International, 5% of 502 Saudi Arabians surveyed stated they were "convinced atheists". [61] [62]

In 2022, the kingdom's total population was approximately 35 million; it was estimated that of these, over one-third were foreign workers. [63]

Languages

The official language of Saudi Arabia is Arabic. Saudi Sign Language is the principal language of the deaf community. The large expatriate communities also speak their own languages, the most numerous of which are Urdu (4,000,000) which after Arabic is widely used especially among the South Asian community, which makes the largest community of expatriate, Indonesian (850,000), Filipino/Tagalog (700,000), Malayalam (447,000), Rohingya (400,000), and Egyptian Arabic (300,000). [64] [65] [66] [ circular reference ]

Related Research Articles

<span class="mw-page-title-main">Demographics of Cameroon</span>

The demographic profile of Cameroon is complex for a country of its population. Cameroon comprises an estimated 250 distinct ethnic groups, which may be formed into five large regional-cultural divisions:

<span class="mw-page-title-main">Demographics of the Democratic Republic of the Congo</span>

Demographic features of the population of the Democratic Republic of the Congo include ethnicity, education level, health, economic status, religious affiliations and other aspects of the population.

<span class="mw-page-title-main">Demographics of Guatemala</span>

This is a demography of the population of Guatemala including population density, ethnicity, education level, health of the populace, economic status, religious affiliations and other aspects of the population.

<span class="mw-page-title-main">Demographics of Honduras</span>

This article is about the ethnic groups and population of Honduras.

<span class="mw-page-title-main">Demographics of Iraq</span>

The Iraqi people are people originating from the country of Iraq.

<span class="mw-page-title-main">Demographics of Libya</span>

Demographics of Libya is the demography of Libya, specifically covering population density, ethnicity, education level, health of the populace, economic status, and religious affiliations, as well as other aspects of the Libyan population. The Libyan population resides in the country of Libya, a territory located on the Mediterranean coast of North Africa, to the west of and adjacent to Egypt. Libyans live in Tripoli. It is the capital of the country and first in terms of urban population, along with Benghazi, Libya's second largest city.

<span class="mw-page-title-main">Demographics of Mali</span>

Demographic features of the population of Mali include population density, ethnicity, education level, health of the populace, economic status, religious affiliations and other aspects of the population.

This is a demography of the population of Monaco, including population density, ethnicity, education level, health of the populace, economic status, religious affiliations and other aspects of the population.

<span class="mw-page-title-main">Demographics of Morocco</span> Demographics of Morocco

Demographic features of the population of Morocco include population density, ethnicity, education level, health of the populace, economic status, religious affiliations and other aspects of the population. The population of Morocco in 2021 is 37.271 million.

<span class="mw-page-title-main">Demographics of Nepal</span>

The current population of Nepal is 29,164,578 as per the 2021 census. The population growth rate is 0.92% per year.

<span class="mw-page-title-main">Demographics of Niger</span>

The demographic features of Nigeriens, the people of Niger consist of population density, ethnicity, education level, health of the populace, economic status, religious affiliations and other aspects of the population.

<span class="mw-page-title-main">Demographics of Oman</span>

Demographics of the population of Oman include population density, ethnicity, education level, health of the populace, economic status, religious affiliations and other aspects.

<span class="mw-page-title-main">Demographics of Romania</span>

Demographic features of the population of Romania include population density, ethnicity, education level, health of the populace, economic status, religious affiliations, and other aspects of the population.

<span class="mw-page-title-main">Demographics of Sudan</span> Demographics of the country

The demographics of Sudan include the Sudanese people and their characteristics, Sudan, including population density, ethnicity, education level, health, economic status, religious affiliations, and other aspects of the population.

<span class="mw-page-title-main">Demographics of Tuvalu</span>

Demographic features of the population of Tuvalu include the age structure, ethnicity, education level, life expectancy, religious affiliations and other aspects of the population.

<span class="mw-page-title-main">Demographics of Uzbekistan</span>

Demographic features of the population of Uzbekistan include population growth, population density, ethnicity, education level, health, economic status, religious affiliations, and other aspects of the population. The nationality of a person from Uzbekistan is Uzbekistani, while the ethnic Uzbek majority call themselves Uzbeks. Much of the data is estimated because the last census was carried out in Soviet times in 1989.

<span class="mw-page-title-main">Demographics of Yemen</span>

Demographic features of the population of Yemen include population density, ethnicity, education level, health of the populace, economic status, religious affiliations and other aspects of the population.

<span class="mw-page-title-main">Demographics of Zimbabwe</span>

Demographic features of the population of Zimbabwe include population density, ethnicity, education level, health of the populace, economic status, religious affiliations and other aspects of the population.

<span class="mw-page-title-main">Demographics of Algeria</span> Demographics of a country

Demographic features of the population of Algeria include population density, ethnicity, education level, health of the populace, economic status, religious affiliations and other aspects.

<span class="mw-page-title-main">Demographics of the State of Palestine</span>

Demographic features of the population of the area commonly described as Palestinian territories includes information on ethnicity, education level, health of the populace, economic status, religious affiliations and other aspects of that population.

References

  1. 1 2 "Population density (people per sq. km of land area) | Data". data.worldbank.org. Archived from the original on 2022-05-24. Retrieved 2018-12-01.
  2. "Saudi Arabia Population 2019". worldpopulationreview.com. Archived from the original on 2020-01-11. Retrieved 2019-06-16.
  3. "Middle East :: Saudi Arabia - The World Factbook - Central Intelligence Agency". cia.gov. Retrieved 2023-05-02.
  4. "GASTAT".
  5. "Net migration | Data". data.worldbank.org. Archived from the original on 2022-05-24. Retrieved 2018-12-01.
  6. "@stats_saudi". Twitter. Retrieved 2023-05-31.
  7. "Saudi Arabia's population crosses 32 million, census results show". Saudigazette. 2023-05-31. Retrieved 2023-05-31.
  8. 1 2 3 4 5 6 7 8 9 "The World Factbook: Saudi Arabia". Central Intelligence Agency. December 21, 2021. Archived from the original on March 19, 2021. Retrieved January 4, 2022.
  9. 1 2 Zuhur, Sherifa. Saudi Arabia (Middle East in Focus). ABC-CLIO Interactive, 2011.
  10. House, Karen Elliott (2012). On Saudi Arabia: Its People, past, Religion, Fault Lines and Future. Knopf. p. 69.
  11. "Saudi Census 2022 Overview". Saudi Census. 2023-11-11. Retrieved 2023-11-11.
  12. Siraj Wahab (30 July 2009). "It's another kind of Saudization". Arab News. Archived from the original on 11 August 2011. Retrieved 13 January 2011.
  13. Tsourapas, Gerasimos (2015-11-10). "Why Do States Develop Multi-tier Emigrant Policies? Evidence from Egypt". Journal of Ethnic and Migration Studies. 41 (13): 2192–2214. doi:10.1080/1369183X.2015.1049940. ISSN   1369-183X. S2CID   73675854. Archived from the original on 2023-01-18. Retrieved 2020-08-30.
  14. Tsourapas, Gerasimos (2016-07-02). "Nasser's Educators and Agitators across al-Watan al-'Arabi: Tracing the Foreign Policy Importance of Egyptian Regional Migration, 1952-1967". British Journal of Middle Eastern Studies. 43 (3): 324–341. doi:10.1080/13530194.2015.1102708. ISSN   1353-0194. S2CID   159943632. Archived from the original on 2020-05-01. Retrieved 2019-12-11.
  15. Seok, Hyunho (1991). "Korean migrant workers to the Middle East". In Gunatilleke, Godfrey (ed.). Migration to the Arab World: Experience of Returning Migrants. United Nations University Press. pp. 56–103. ISBN   9280807455.
  16. "President Roh Moo-hyun's Official Visit to the Kingdom of Saudi Arabia". Cheongwadae (Office of the President), Republic of Korea. 2007. Archived from the original on 2007-07-08. Retrieved 2007-04-23.
  17. "Iraq Population - Our World in Data". www.ourworldindata.org. Archived from the original on 2023-01-18. Retrieved 2022-02-15.
  18. "World Population Prospects - Population Division - United Nations". Archived from the original on 7 May 2011. Retrieved 29 January 2016.
  19. author2 (2015-12-17). "Population Estimates". General Authority for Statistics (in Arabic). Archived from the original on 2022-01-04. Retrieved 2022-01-04.{{cite web}}: |last= has generic name (help)CS1 maint: numeric names: authors list (link)
  20. 1 2 Long, David (2010). The Kingdom of Saudi Arabia. University Press of Florida. pp. 18–19.
  21. "Annual Yearbook". 17 December 2015. Archived from the original on 19 April 2022. Retrieved 10 November 2020.
  22. "GCC-Stat, Query". dp.gccstat.org. Archived from the original on 2021-08-31. Retrieved 2021-08-31.
  23. "GASTAT".
  24. "GASTAT Portal".
  25. "UNSD — Demographic and Social Statistics". Unstats.un.org. Archived from the original on 2022-04-14. Retrieved 2022-05-02.
  26. 1 2 3 Long, David (2010). The Kingdom of Saudi Arabia. University Press of Florida. pp. 23–24.
  27. Long, David (2010). The Kingdom of Saudi Arabia. University Press of Florida. p. 66.
  28. "Population Growth (Annual %)." Population Growth (Annual %) | Data, World Bank, data.worldbank.org/indicator/SP.POP.GROW?end=2017&locations=ZQ-SA-US&start=1995.
  29. "Mortality Rate, Infant (per 1,000 Live Births)." World Bank: Infant Mortality, World Bank, data.worldbank.org/indicator/SP.DYN.IMRT.IN?end=2017&locations=SA-ZQ&start=1995.
  30. Kingdom of Saudi Arabia, "1st Voluntary National Review." Sustainable Development Goals, United Nations High-Level Political Forum, 2017, pp 45-46.
  31. Kingdom of Saudi Arabia, "1st Voluntary National Review." Sustainable Development Goals, United Nations High-Level Political Forum, 2017, pp 46-48
  32. United Nations Department of Economic and Social Affairs Population Division (2022). "World Population Prospects 2022 Demographic indicators by region, subregion and country, annually for 1950-2100" (XLS (91MB)). United Nations Population Division . 27 (Online ed.). New York: United Nations Department of Economic and Social Affairs, Population Division. rows 9869:9940,cols M,X,AE,S,AH,S,AA,AV,AI. Archived from the original on 2022-08-09.
  33. 1 2 3 "Middle East :: SAUDI ARABIA". CIA The World Factbook. 13 December 2021. Archived from the original on 19 March 2021. Retrieved 24 January 2021.
  34. "Saudi Arabia - World Directory of Minorities & Indigenous Peoples". Minority Rights Group. 2015-06-19. Archived from the original on 2022-04-23. Retrieved 2022-01-04.
  35. "The World Factbook – Saudi Arabia". Central Intelligence Agency . Retrieved January 16, 2023.
  36. 1 2 "Saudi Arabia - total population from 2012 to 2022 | Statistic". Statista. Archived from the original on 2022-06-02. Retrieved 2018-11-26.
  37. De Bel-Air, Françoise (January 2014). "Demography, Migration and Labour Market in Saudi Arabia". Migration Policy Center: European University Institute via Gulf Research Center.
  38. "International Migration Report 2017." Department of Economic and Social Affairs, United Nations, 2017, www.un.org/en/development/desa/population/migration/publications/migrationreport/docs/MigrationReport2017_Highlights.pdf.
  39. 1 2 "Migration Profile: Saudi Arabia ." Unicef, United Nations, 2013, esa.un.org/miggmgprofiles/indicators/files/saudiarabia.pdf.
  40. "Saudi Shoura Council considers deporting 5 mln illegal migrants". Al Arabiya English. 2017-03-07. Archived from the original on 2021-01-22. Retrieved 2020-11-26.
  41. "Saudi Arabia's Statistics Through a Magnifying Glass (2021)". tgmresearch.com. TGM Research. 2021. Retrieved 30 September 2023.
  42. "9.5 million Egyptians live abroad, mostly in Saudi Arabia and Jordan". Egypt Independent. 2017-10-01. Archived from the original on 2020-02-23. Retrieved 2022-01-04.
  43. "Over 2.7 million Pakistanis living in Saudi Arabia to benefit from new green card". Arab News PK. 2019-05-14. Archived from the original on 2022-03-21. Retrieved 2022-01-04.
  44. "Population of Overseas Indians" (PDF). Archived (PDF) from the original on 2020-07-20. Retrieved 2022-01-04.
  45. "Over 217 Bangladeshi workers deported from Saudi Arabia". www.aa.com.tr. Archived from the original on 2021-11-25. Retrieved 2022-01-04.
  46. "Saudi Arabia: Yemeni Workers at Risk of Mass Forced Returns". Human Rights Watch. 2021-08-31. Archived from the original on 2021-08-31. Retrieved 2022-01-04.
  47. Doanvo, Anhvinh (23 September 2015). "Western Media's Miscount of Saudi Arabia's Syrian Refugees". Huffington Post. Archived from the original on 27 March 2019. Retrieved 20 February 2020.
  48. "Syria's Refugees Feel More Welcome in Europe Than in the Gulf". Bloomberg.com. Bloomberg. 4 September 2015. Archived from the original on 2019-06-05. Retrieved 2022-05-02.
  49. Taqiyya, Almas (27 May 2022). "Negara yang Banyak Orang Jawa, Nomor 1 Jumlahnya Lebih dari 1,5 Juta Jiwa". international.sindonews.com. Sindo News . Retrieved 4 October 2023.
  50. "Distribution on Filipinos Overseas". dfa.gov.ph. Archived from the original on 2017-04-27. Retrieved 2022-01-04.
  51. "السكان - التركيبة السكانية حسب الجنسية والنوع". portal.saudicensus.sa. Saudi Census. 2022. Retrieved 17 October 2023.
  52. "Myanmar Rohingya: What you need to know about the crisis". BBC News. 23 January 2020. Archived from the original on 19 October 2017. Retrieved 21 July 2018.
  53. "Saudi Arabia entry at Ethnologue". Ethnologue. Archived from the original on 22 February 2020. Retrieved 6 February 2015.
  54. Omari, Raed (22 June 2022). "Saudi-Jordanian cooperation 'a role model' for the entire Middle East". Arab News . Amman . Retrieved 17 October 2023.
  55. "International Religious Freedom Report 2007, Saudi Arabia". U.S. State Department. 14 September 2007. Retrieved 17 October 2023.
  56. "International Nepal Fellowship - Nepali diaspora". Archived from the original on 2010-07-15. Retrieved 2023-10-17.
  57. "Dubai's Somali diaspora hope for change". CCTV. 11 September 2012. Archived from the original on 2015-07-01. Retrieved 8 March 2015.
  58. Pukas, Anna (4 May 2018). "Lebanese across the globe: How the country's international community came to be". Arab News . London . Retrieved 17 October 2023.
  59. "The World Factbook". 2020. Central Intelligence Agency. Archived from the original on 5 March 2023. Retrieved 17 March 2023.
  60. US State Dept 2022 report
  61. "Global Index of Religiosity and Atheism" (PDF). Gallup. Archived from the original (PDF) on 2017-08-02. Retrieved 2013-08-06.
  62. "A surprising map of where the world's atheists live". The Washington Post . Archived from the original on 2014-06-03. Retrieved 2014-05-18.
  63. US State Dept 2022 report
  64. "Migrant Communities in Saudi Arabia", Bad Dreams: Exploitation and Abuse of Migrant Workers in Saudi Arabia, Human Rights Watch, 2004[ permanent dead link ]
  65. Saudi Arabia Archived 2013-02-03 at the Wayback Machine . Ethnologue
  66. Kerala Gulf diaspora
External videos
Nuvola apps kaboodle.svg Why 82% of Saudi Arabians Just Live in These Lines -RealLifeLore