This is a demography of the population of Sri Lanka including population density, ethnicity, education level, health of the population, economic status, religious affiliations and other aspects of the population.
Sri Lanka is an island in the Indian Ocean, also called Ceylon and many other names. It is about the size of Ireland. It is about 28 kilometres (18mi.) off the south-eastern coast of India with a population of about 22 million. Density is highest in the south west where Colombo, the country's main port and industrial center, is located. The net population growth is about 0.7%. Sri Lanka is ethnically, linguistically, and religiously diverse.
According to the 2012 census the population of Sri Lanka was 20,359,439, giving a population density of 325/km2.[7] The population had grown by 5,512,689 (37.1%) since the 1981 census (the last full census), equivalent to an annual growth rate of 1.1%.[7] 3,704,470 (18.2%) lived in urban sectors - areas governed by municipal and urban councils.[8]
5,131,666 (25.2%) of the population were aged 14 or under whilst 2,525,573 (12.4%) were aged 60 or over, leaving a working age (15-59) population of 12,702,700.[9] The dependency ratio was 60.2%.[7] The mean age was 32 years and the median age was 31 years.[7] The sex ratio was 94 males per 100 females.[7] The fertility rate for married females aged 15 or over was 2.65 live births.[10] There were 5,264,282 households, of which 3,986,236 (75.7%) were headed by males and 1,278,046 (24.3%) were headed by females.[7]
Of the 15,227,773 aged 15 or over, 10,322,105 (67.8%) were married, 3,927,602 (25.8%) were never married, 792,947 (5.2%) were widowed and 185,119 (1.2%) were divorced or separated.[11]
Of those aged 15 or over, 7,857,370 (51.6%) were economically active, 4,199,558 (27.6%) did housework, 1,431,105 (9.4%) were students, 914,934 (6.0%) were unable to work and 346,084 (2.3%) were pensioners.[12] 521,938 (6.6%) of the economically active were unemployed.[7] 604,540 Sri Lankans were living aboard for more than six months but were intending to return to Sri Lanka, mostly in the Gulf states (373,050 61.7%).[13]
The overall literacy rate for those aged 10 and over was 95.7% but amongst those living in the estate sector it was only 86.1%.[14] Of the 18,615,577 aged 5 or over, 499,563 (2.7%) had received a higher education qualification, 2,293,841 (12.3%) had passed G.C.E. A/L, 3,159,402 (17.0%) had passed G.C.E. O/L and 700,419 (3.8%) had no formal schooling.[15] The remaining 11,962,352 (64.3%) had left school with no qualifications or were currently at school.[15]
Sri Lanka's population is aging faster than any other nation in South Asia and has the fifth highest rapidly growing population of older people in Asia after China, Thailand, South Korea and Japan.[16][17][18] In 2015, Sri Lanka's population aged over 60 was 13.9%, by 2030 this will increase to 21% and by 2050 this number will reach 27.4%.[17][18] Sri Lanka's rapidly growing older population has ignited concerns of the socio-economic challenges that the country will face because of this.[19]
Ethnicity
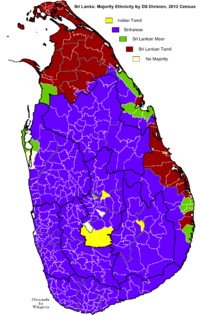
Majority ethnicity by DS Division according to 2012 census
The Sinhalese make up 74.9% of the population (according to 2012 census) and are concentrated in the densely populated south-west and central parts of the island.[20]
The Sri Lanka Tamils, who live predominantly in the north and east of the island, form the largest minority group at 11.1% (according to the 2012 census) of the population.[20]
The Moors, descendants of Arab and Indian traders, form the third largest ethnic group at 9.3% of the population.[20] They are mostly concentrated in urban areas in the southern parts of the island with substantial populations in the Central and Eastern provinces. During times of Portuguese colonization, Moors were persecuted, and many forced to retreat to the central highlands and the eastern coast.[citation needed]
There are also Indian Tamils who form a distinct ethnic group comprising 4.1% of the population.[20] The British brought them to Sri Lanka in the 19th century as tea and rubber plantation workers, and they remain concentrated in the "tea country" of south-central Sri Lanka. The Indian Tamils of Sri Lanka were considered to be "stateless" and over 300,000 Indian Tamils were deported back to India, due to the agreement between Sri Lanka and India in 1964.[21] Under the pact, India granted citizenship to the remainder, some 200,000 of whom now live in India. Another 75,000 Indian Tamils, who themselves or whose parents once applied for Indian citizenship, now wish to remain in Sri Lanka. The government has stated these Tamils will not be forced to return to India, although they are not technically citizens of Sri Lanka. By the 1990s most Indian Tamils had received Sri Lankan citizenship, and some even were not granted Sri Lankan citizenship until 2003.[21][22]
Smaller minorities include the Veddas, the indigenous people of Sri Lanka; Malays who descend from Austronesian settlers; the Burghers, who are descendants of Europeancolonists, principally from Portugal, the Netherlands and, the UK; the ethnic Chinese migrants who came to the island in the 18th and 19th centuries; and the Kaffirs, a small population who are descended from Africans.
Population of Sri Lanka by ethnic group 1881 to 2012[20][23][24]
According to the 2012 census Buddhists make up 70.2% of the population, Hindus 12.6%, Muslims 9.7% and Christians 7.6%.[26] Most Sinhalese are Buddhist; most Tamils are Hindu; and the Moors and Malays are mostly Muslim. Sizeable minorities of both Sinhalese and Tamils are Christians, most of whom are Roman Catholic. The Burgher population is mostly Roman Catholic or Presbyterian. The Veddas have Animist and Buddhist practices. The 1978 constitution, while assuring freedom of religion, gives "the foremost place" to Buddhism.[27][28]
Population of Sri Lanka by religion 1881 to 2012[26][29][30]
Tamil, a Dravidian language, is the first language of native Sri Lankan Tamils. Tamil is also the first language of the majority of Sri Lankan Moors and the Indian Tamils - according to the 2012 census 98% of Sri Lankan Moors could speak Tamil but only 59% could speak Sinhala.[31]
English is fluently spoken by approximately 23.8%[32] of the Sri Lanka's population, and widely used for official and commercial purposes.
Malays speak Sri Lanka Malay, a Creole language mixing Sinhala, Tamil and Malay. Many of the Burghers speak Sri Lankan Indo-Portuguese although its use has declined and the majority now speak Sinhala.[31] The Veddas speak Vedda, a Creole language closely based on Sinhala. Use of English has declined since independence, but it continues to be spoken by many in the middle and upper middle classes, particularly in Colombo. According to the 2012 census 24% of the population could speak English.[31] The government is seeking to reverse the decline in the use of English, mainly for economic but also for political reasons. According to the constitution Sinhala and Tamil are official languages whilst English is the link language.[33]
Age structure - 0–14 years: 23.9% (male 2,594,815/female 2,493,002); 15–64 years: 68% (male 7,089,307/female 7,418,123); 65 years and over: 8.1% (male 803,172/female 926,372) (2010 est.)
Median age - total: 31.1 years; male: 30.1 years; female: 32.2 years (2012 est.)
Population growth rate - 0.913% (2012 est.)
Birth rate - 17.04 births/1,000 population (2012 est.)
Death rate - 5.96 deaths/1,000 population (July 2012 est.)
Net migration rate - -1.95 migrant(s)/1,000 population (2012 est.)
Urbanization - urban population: 14% of total population (2010); rate of urbanization: 1.1% annual rate of change (2010-15 est.)
Sex ratio - at birth: 1.04 male(s)/female; under 15 years: 1.04 male(s)/female; 15–64 years: 0.96 male(s)/female; 65 years and over: 0.75 male(s)/female; total population: 0.96 male(s)/female (2011 est.)
Infant mortality rate - total: 9.47 deaths/1,000 live births; male: 10.44 deaths/1,000 live births; female: 8.45 deaths/1,000 live births
Life expectancy at birth - total population: 75.94 years; male: 72.43 years; female: 79.59 years (2012 est.)
Total fertility rate - 2.17 children born/woman (2012 est.)
Health expenditures - 4% of GDP (2009)
Physicians density - 0.492 physicians/1,000 population (2006)
Hospital bed density - 3.1 beds/1,000 population (2004)
HIV/AIDS - adult prevalence rate - less than 0.1% (2009 est.)
HIV/AIDS - people living with HIV/AIDS - 2,800 (2009 est.)
HIV/AIDS - deaths - fewer than 200 (2009 est.)
Major infectious diseases - degree of risk: high; food or waterborne diseases: bacterial diarrhea and hepatitis A; vectorborne disease: dengue fever and chikungunya; water contact disease: leptospirosis; animal contact disease: rabies (2009)
Nationality - noun: Sri Lankan(s); adjective: Sri Lankan
1 2 Indian Tamils were only classified as a separate ethnic group from 1911 onwards. Prior to this they were included with Sri Lankan Tamils.
1 2 Indian Moors were only classified as a separate ethnic group from 1911 to 1971. Prior to 1911 they were included with Sri Lankan Moors. After 1971 they were included with Others.
↑ The 1941 Census was postponed due to World War II.
↑ The 1951 Census was postponed due to a shortage of paper at the time.
1 2 2001 Census was only carried out in 18 of the 25 districts. Inclusion of data would be misleading.
1 2 The official census dates for the 2011 Census was 20 March 2012.
↑ Since the outbreak of hostilities between the government and armed Tamil separatists in the mid-1980s, several hundred thousand Tamil civilians have fled the island and more than 200,000 Tamils have sought refuge in the West (July 2010 est.) Aside from such migrants, there is an estimated 1.7 million Sri Lankans who are employed abroad (2010 est.), through which Sri Lanka earned USD 4.1 billion in annual worker remittances in 2010. Such remittances are a key source of foreign exchange for Sri Lanka.
↑ These figures are based on the 2001 census which was only carried out partially in the Northern and Eastern provinces, where the majority of Sri Lankan Tamils and Hindus live. Therefore the Sri Lankan Tamil and Hindu percentage is grossly understated. The Sri Lankan government estimates that the Tamils (Sri Lankan and Indian) account for 18% of the population.
↑ English is commonly used in government and is spoken competently by about 10% of the population as second language.
Related Research Articles
Demographic features of the population of Botswana include population density, ethnicity, education level, health of the populace, economic status, religious affiliations and other aspects.
The demographics of Ethiopia encompass the demographic features of inhabitants in Ethiopia, including ethnicity, languages, population density, education level, health, economic status, religious affiliations and other aspects of the population.
This is a demography of the population of Maldives, including population density, ethnicity, education level, health of the populace, economic status, religious affiliations and other aspects of the population.
Mauritian society incorporates several ethnic and multi-ethnic groups. A majority of the republic's residents are descendants of people from India. Mauritius also comprises migrants from continental Africa, China, France, and the East African island of Madagascar. As of 2023, Mauritius now has the highest population density in Africa.
Provinces are the first level administrative divisions of Sri Lanka. Currently, Sri Lanka is divided into 9 provinces. Each province is further divided into districts, which are further divided into divisional secretariats.
The Sabaragamuwa Province is one of the nine provinces of Sri Lanka. Ratnapura is the capital of the province.
North Central Province is one of the nine provinces of Sri Lanka. The province has an area of 10,472 km2, making it the largest province by area, and a population of 1,266,663, making it the 3rd least populated province. The city of Anuradhapura is the capital of the province.
Hinduism is one of Sri Lanka's oldest religions, with temples dating back over 2,000 years. As of 2011, Hindus made up 12.6% of the Sri Lankan population. They are almost exclusively Tamils, except for small immigrant communities from India and Pakistan.
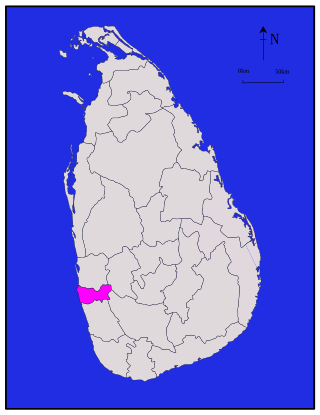
Gampaha District is one of the 25 districts of Sri Lanka, the second level administrative division of the country. It is the second most populous district of Sri Lanka after Colombo District. The district is administered by a District Secretariat headed by a District Secretary appointed by the central government of Sri Lanka. The capital of the district is the town of Gampaha. The district was carved out of the northern part of Colombo District in September 1978.
Kalutara District is one of the 25 districts of Sri Lanka, the second level administrative division of the country. The district is administered by a District Secretariat headed by a District Secretary appointed by the central government of Sri Lanka. The capital of the district is the city of Kalutara .
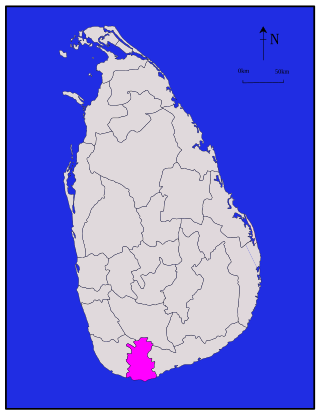
Matara is a district in Southern Province, Sri Lanka. It is one of 25 districts of Sri Lanka, the second level administrative division of the country. The district is administered by a District Secretariat headed by a District Secretary appointed by the central government of Sri Lanka.
Colombo District is one of the 25 districts of Sri Lanka, the second level administrative division of the country. The district is administered by a District Secretariat headed by a District Secretary appointed by the central government of Sri Lanka. The capital of the district is the city of Colombo. The district of Colombo was officially recorded in 2016 as having the highest income on average, per household.
Sri Lankan Chetties also known as Colombo Chetties, are an ethnicity in the island of Sri Lanka. Before 2001, they were known as the Sri Lankan Tamil caste, but then after 2001, they were classified as a separate ethnic group in the 2001 census. They are now collectively referred to as the Colombo Chetties. They were said to have migrated from India under Portuguese rule and were given special rights and representation during colonial rule.
This is a list of Tamil population per city .Some cities in Sri Lanka also includes Sri Lankan Moors population because most of them have Tamil as their mother tongue.In Singapore the number also includes ethnic Tamils who don't speak Tamil at home
Kilinochchi District is one of the 25 districts of Sri Lanka, the second level administrative division of the country. The district is administered by a District Secretariat headed by a District Secretary appointed by the central government of Sri Lanka. The capital of the district is the town of Kilinochchi.
Batticaloa District is one of the 25 districts of Sri Lanka, the second level administrative division of the country. The district is administered by a District Secretariat headed by a District Secretary appointed by the central government of Sri Lanka. The capital of the district is the city of Batticaloa. Ampara District was carved out of the southern part of Batticaloa District in April 1961.
Mullaitivu District is one of the 25 districts of Sri Lanka, the second level administrative division of the country. The district is administered by a District Secretariat headed by a District Secretary appointed by the central government of Sri Lanka. The capital of the district is the town of Mullaitivu.
Vavuniya District is one of the 25 districts of Sri Lanka, the second level administrative division of the country. The district is administered by a District Secretariat headed by a District Secretary appointed by the central government of Sri Lanka. The capital of the district is the city of Vavuniya.
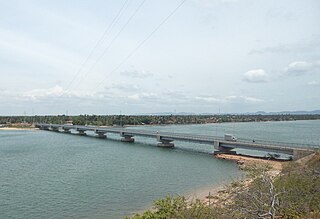
Kinniya is a town on the east coast of Sri Lanka, in the Trincomalee District of the Eastern Province. It is about 20 km (12 mi) from the city of Trincomalee and 240 km (150 mi) from Colombo. Located in Sri Lanka's dry zone, the Kinniya region often experiences hot and dry weather with very little precipitation. Kinniya Bridge is Sri Lanka's longest bridge, which attracts many tourists in the town. Being adjacent to the Trincomalee Harbour, Kinniya was devastated by the 2004 Indian Ocean tsunami.
Sri Lankan Malays are Sri Lankan citizens with full or partial ancestry from the Indonesian Archipelago, Malaysia, or Singapore. In addition, people from Brunei and the Philippines also consider themselves Malays.
↑ The Population of Sri Lanka(PDF). Population Growth: C.I.C.R.E.D. Series. 1974. pp.3–4. Archived(PDF) from the original on 1 July 2014. Retrieved 2 August 2014.
↑ "Population by age group and sex". LankaSIS Sri Lanka Statistical Information Service. Department of Census & Statistics, Sri Lanka. Archived from the original on 2 April 2015.
↑ "Population by ethnic group". LankaSIS Sri Lanka Statistical Information Service. Department of Census & Statistics, Sri Lanka. Archived from the original on 2 April 2015.
↑ "Population by religion". LankaSIS Sri Lanka Statistical Information Service. Department of Census & Statistics, Sri Lanka. Archived from the original on 2 April 2015.
↑ United Nations, Department of Economic and Social Affairs. Population Division (2017). "Trends in International Migrant Stock: The 2017 revision"(Exel). United Nations, Department of Economic and Social Affairs. Population Division. Retrieved 18 September 2020.
This page is based on this Wikipedia article Text is available under the CC BY-SA 4.0 license; additional terms may apply. Images, videos and audio are available under their respective licenses.