| Demographics of India | |
|---|---|
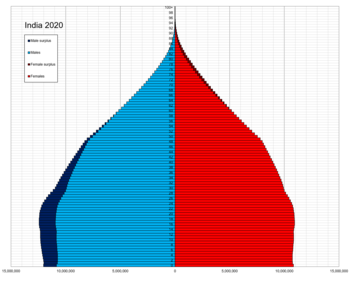 India population pyramid in 2020 | |
| Population | (April 2023 est.) 1,428,627,663 [2] (Mid-year 2023 est.) |
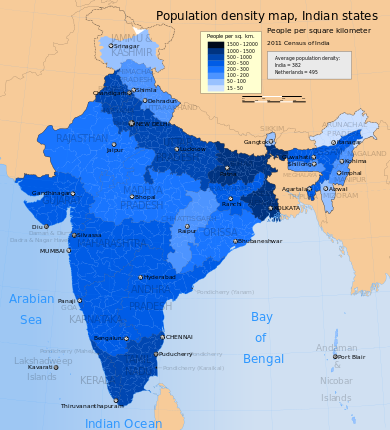
| Density | 473.42 people per.km2 (2021 est.) [3] |
| Growth rate | 0.68% (2022 est.) [3] |
| Birth rate | 16.1 births/1,000 population (2023 est.) [3] |
| Death rate | 6.6 deaths/1,000 population (2023 est.) [3] |
| Life expectancy | |
| • male | 70.5 years (2023 est.) |
| • female | 73.6 years (2023 est.) |
| Fertility rate | |
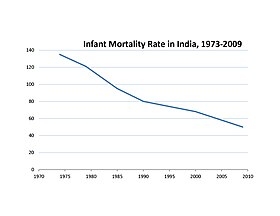
| Infant mortality rate | 29.94 deaths/1,000 live births (2018) [4] |
| Age structure | |
| 0–14 years | 25.68% (male 183,695,000/female 166,295,000) (2021 est.) |
| 15–64 years | 67.49% (male 472,653,000/female 447,337,000) (2021 est.) |
| 65 and over | 6.83% (male 44,275,000/female 48,751,000) (2021 est.) |
| Sex ratio | |
| Total | 1.06 male(s)/female (2023) [5] |
| At birth | 1.1 male(s)/female (2023) [5] |
| Under 15 | 1.11 male(s)/female (2023) [5] |
| 15–64 years | 1.07 male(s)/female (2023 est.) |
| 65 and over | 0.85 male(s)/female (2023) [5] |
| Nationality | |
| Major ethnic | See Ethnic groups of India |
| Language | |
| Official | See Languages of India |
| Spoken | |
India is the most populous country in the world with one-sixth of the world's population. According to estimates from the United Nations (UN), India has overtaken China as the country with the largest population in the world, with a population of 1,425,775,850 at the end of April 2023. [6] [7] [8] [9]
Contents
- History
- Prehistory to early 19th century
- Late 19th century to early 20th century
- Salient features
- Comparative demographics
- List of states and union territories by demographics
- Religious demographics
- Neonatal and infant demographics
- Population within the age group of 0–6
- Population above the age of seven
- Literacy rate
- Linguistic demographics
- Largest cities of India
- Vital statistics
- UN estimates
- Census of India: sample registration system
- Life expectancy
- Structure of the population
- Fertility rate
- Regional vital statistics
- CIA World Factbook demographic statistics
- Caste/Tribe
- Ethnic groups
- Genetics
- Y-chromosome DNA
- Mitochondrial DNA
- Autosomal DNA
- Charts
- See also
- Government
- Lists
- Notes
- References
- Bibliography
- External links
Between 1975 and 2010, the population doubled to 1.2 billion, reaching the billion mark in 2000. According to the UN's World Population dashboard, India's population now stands at slightly over 1.428 billion, edging past China's population of 1.425 billion people, as reported by the news agency Bloomberg. [9] Its population is set to reach 1.7 billion by 2050. [10] [11] In 2017 its population growth rate was 0.98%, ranking 112th in the world; in contrast, from 1972 to 1983, India's population grew by an annual rate of 2.3%. [12]
In 2022, the median age of an Indian was 28.7 years, [13] compared to 38.4 for China and 48.6 for Japan; and, by 2030; India's dependency ratio will be just over 0.4. [14] However, the number of children in India peaked more than a decade ago and is now falling. The number of children under the age of five peaked in 2007, and since then the number has been falling. The number of Indians under 15 years old peaked slightly later (in 2011) and is now also declining. [15]
India has many ethnic groups, [16] and every major religion is represented, as are four major families of languages (Indo-European, Dravidian, Austroasiatic and Sino-Tibetan languages) as well as two language isolates: the Nihali language, [17] spoken in parts of Maharashtra, and the Burushaski language, spoken in parts of Jammu and Kashmir. 1,000,000 people in India are Anglo-Indians and 700,000 United States citizens are living in India. [18] They represent over 0.1% of the total population of India. Overall, only the continent of Africa exceeds the linguistic, genetic and cultural diversity of the nation of India. [19]
The sex ratio was 944 females for 1000 males in 2016, and 940 per 1000 in 2011. [20] This ratio has been showing an upwards trend for the last two decades after a continuous decline in the 20th century. [21]