| Demographics of Pakistan | |
|---|---|
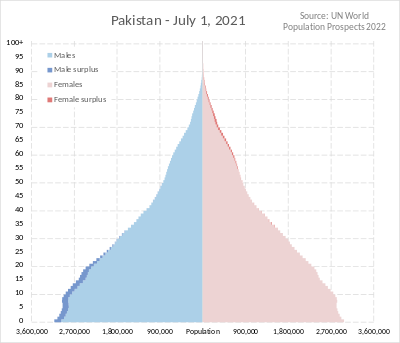 Population pyramid of Pakistan as of July 1, 2021 | |
| Population | 241,492,197 (2023 census) |
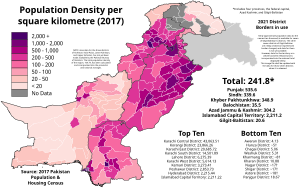
| Density | 260.8/km2 (675/sq mi) 248.9/km2 (645/sq mi) (including AJK and GB) |
| Growth rate | |
| Birth rate | 22.5 births / 1,000 population (2023 est.) |
| Death rate | 7.2 deaths / 1,000 population (2021 est.) [1] |
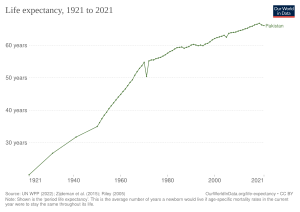
| Life expectancy | 69.1 years (2022 est.) [1] |
| • male | 66.8 years (2022 est.) [1] |
| • female | 71.6 years (2022 est.) [1] |
| Fertility rate | 3.47 children born / woman (2021 est.) [1] |
| Net migration rate | −2.0 migrants / 1,000 population (2021 est.) [1] |
| Age structure | |
| 0–14 years | 40.3% (2017) [2] |
| 15–64 years | 56.0% (2017) [2] |
| 65 and over | 3.7% (2017) [2] |
| Nationality | |
| Nationality | noun: Pakistani |
| Major ethnic | See Ethnic groups of Pakistan |
| Language | |
| Spoken | See Languages of Pakistan |
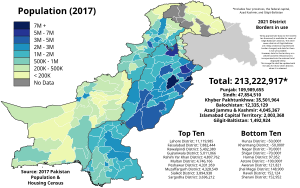
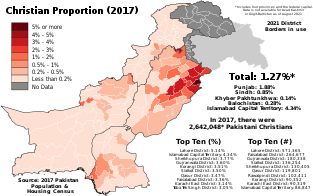
Pakistan had a population of 241,492,197 according to the final results of the 2023 Census. [3] [4] [5] This figure includes Pakistan's four provinces e.g. Punjab, Sindh, KPK, Balochistan and Islamabad Capital Territory. AJK and Gilgit-Baltistan's census data is yet to be approved by CCI Council of Pakistan. Pakistan is the world's fifth most populous country. [6]
Contents
- Population
- Estimates from the United Nations
- Structure of population
- Population distribution
- Vital statistics
- Estimates based on surveys
- Estimates from the United Nations 2
- Human development
- Human Development Index
- Literacy
- Educational institutions by kind
- Nationality, ethnicity, and language
- Ethnic groups
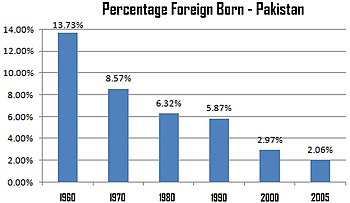
- Foreign-born population in Pakistan
- Languages
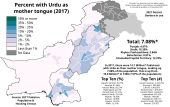
- Urdu (national language)
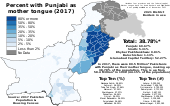
- Punjabi
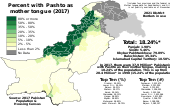
- Pashto
- Sindhi
- Saraiki
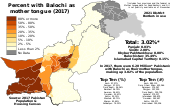
- Balochi
- Hindko
- Brahui
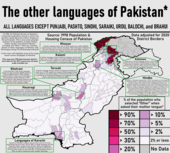
- Minor languages
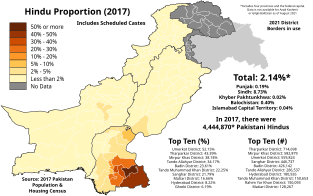
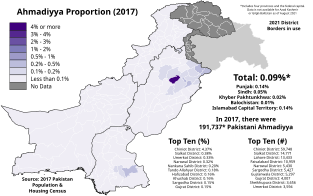
- Religion
- Recent changes and detailed demographic data
- Pakistanis around the world
- See also
- Notes
- References
- Sources
- External links
Between 1951 and 2017, Pakistan's population expanded over sixfold, going from 33.7 million to 207.7 million. The country has a relatively high, although declining, growth rate supported by high birth rates and low death rates. Between 1998 and 2017, the average annual population growth rate stood at +2.40%.
Dramatic social changes have led to urbanization and the emergence of two megacities: Karachi and Lahore. The country's urban population more than tripled between 1981 and 2017 (from 23.8 million to 75.7 million), as Pakistan's urbanisation rate rose from 28.2% to 36.4%. Even with this, the nation's urbanisation rate remains one of the lowest in the world, and in 2017, over 130 million Pakistanis (making up nearly 65% of the population) lived in rural areas.
Due to a high fertility rate, which was estimated at 3.5 in 2022, Pakistan has one of the world's youngest populations. The 2017 census recorded that 40.3% of the country's population was under the age of 15, while only 3.7% of Pakistanis were aged 65 or more. [2] The median age of the country was 19, [2] while its sex ratio was recorded to be 105 males per 100 females. [3]
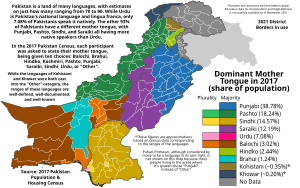
The demographic history of Pakistan from the ancient Indus Valley civilization to the modern era includes the arrival and settlement of many cultures and ethnic groups in the modern region of Pakistan from Eurasia and the nearby Middle East. Because of this, Pakistan has a multicultural, multilinguistic, and multiethnic society. Despite Urdu being Pakistan's lingua franca, estimates on how many languages are spoken in the country range from 75 to 85, [7] [8] and in 2017, the country's three largest ethnolinguistic groups were the Punjabis (making up 38.8% of the total population), the Pashtuns (18.2%), and the Sindhis (14.6%). [9] Pakistan is also thought to have the world's fourth-largest refugee population, estimated at 1.4 million in mid-2021 by the UNHCR. [10]