ELKI

Last updated
Environment for DeveLoping KDD-Applications Supported by Index-Structures
Developer(s) Technical University of Dortmund; initially Ludwig Maximilian University of Munich
Stable release
0.8.0 / 5 October 2022;19 months ago (2022-10-05)
Repository
Written in Java
Operating system Microsoft Windows, Linux, Mac OS
Platform Java platform
Type Data mining
License AGPL (since version 0.4.0)
Website elki-project.github.io

ELKI (Environment for Developing KDD-Applications Supported by Index-Structures) is a data mining (KDD, knowledge discovery in databases) software framework developed for use in research and teaching. It was originally created by the database systems research unit at the Ludwig Maximilian University of Munich, Germany, led by Professor Hans-Peter Kriegel. The project has continued at the Technical University of Dortmund, Germany. It aims at allowing the development and evaluation of advanced data mining algorithms and their interaction with database index structures.

Contents

Description

The ELKI framework is written in Java and built around a modular architecture. Most currently included algorithms perform clustering, outlier detection, [1] and database indexes. The object-oriented architecture allows the combination of arbitrary algorithms, data types, distance functions, indexes, and evaluation measures. The Java just-in-time compiler optimizes all combinations to a similar extent, making benchmarking results more comparable if they share large parts of the code. When developing new algorithms or index structures, the existing components can be easily reused, and the type safety of Java detects many programming errors at compile time.

ELKI is a free tool for analyzing data, mainly focusing on finding patterns and unusual data points without needing labels. It's written in Java and aims to be fast and able to handle big datasets by using special structures. It's made for researchers and students to add their own methods and compare different algorithms easily. [2]

ELKI has been used in data science to cluster sperm whale codas, [3] for phoneme clustering, [4] for anomaly detection in spaceflight operations, [5] for bike sharing redistribution, [6] and traffic prediction. [7]

Objectives

The university project is developed for use in teaching and research. The source code is written with extensibility and reusability in mind, but is also optimized for performance. The experimental evaluation of algorithms depends on many environmental factors and implementation details can have a large impact on the runtime. [8] ELKI aims at providing a shared codebase with comparable implementations of many algorithms.

As research project, it currently does not offer integration with business intelligence applications or an interface to common database management systems via SQL. The copyleft (AGPL) license may also be a hindrance to an integration in commercial products; nevertheless it can be used to evaluate algorithms prior to developing an own implementation for a commercial product. Furthermore, the application of the algorithms requires knowledge about their usage, parameters, and study of original literature. The audience are students, researchers, data scientists, and software engineers.

Architecture

ELKI is modeled around a database-inspired core, which uses a vertical data layout that stores data in column groups (similar to column families in NoSQL databases). This database core provides nearest neighbor search, range/radius search, and distance query functionality with index acceleration for a wide range of dissimilarity measures. Algorithms based on such queries (e.g. k-nearest-neighbor algorithm, local outlier factor and DBSCAN) can be implemented easily and benefit from the index acceleration. The database core also provides fast and memory efficient collections for object collections and associative structures such as nearest neighbor lists.

ELKI makes extensive use of Java interfaces, so that it can be extended easily in many places. For example, custom data types, distance functions, index structures, algorithms, input parsers, and output modules can be added and combined without modifying the existing code. This includes the possibility of defining a custom distance function and using existing indexes for acceleration.

ELKI uses a service loader architecture to allow publishing extensions as separate jar files.

ELKI uses optimized collections for performance rather than the standard Java API. [9] For loops for example are written similar to C++ iterators:

for(DBIDIteriter=ids.iter();iter.valid();iter.advance()){relation.get(iter);// E.g., get the referenced objectidcollection.add(iter);// E.g., add the reference to a DBID collection}

In contrast to typical Java iterators (which can only iterate over objects), this conserves memory, because the iterator can internally use primitive values for data storage. The reduced garbage collection improves the runtime. Optimized collections libraries such as GNU Trove3, Koloboke, and fastutil employ similar optimizations. ELKI includes data structures such as object collections and heaps (for, e.g., nearest neighbor search) using such optimizations.

Visualization

The visualization module uses SVG for scalable graphics output, and Apache Batik for rendering of the user interface as well as lossless export into PostScript and PDF for easy inclusion in scientific publications in LaTeX. Exported files can be edited with SVG editors such as Inkscape. Since cascading style sheets are used, the graphics design can be restyled easily. Unfortunately, Batik is rather slow and memory intensive, so the visualizations are not very scalable to large data sets (for larger data sets, only a subsample of the data is visualized by default).

Awards

Version 0.4, presented at the "Symposium on Spatial and Temporal Databases" 2011, which included various methods for spatial outlier detection, [10] won the conference's "best demonstration paper award".

Included algorithms

Select included algorithms: [11]

Version history

Version 0.1 (July 2008) contained several Algorithms from cluster analysis and anomaly detection, as well as some index structures such as the R*-tree. The focus of the first release was on subspace clustering and correlation clustering algorithms. [12]

Version 0.2 (July 2009) added functionality for time series analysis, in particular distance functions for time series. [13]

Version 0.3 (March 2010) extended the choice of anomaly detection algorithms and visualization modules. [14]

Version 0.4 (September 2011) added algorithms for geo data mining and support for multi-relational database and index structures. [10]

Version 0.5 (April 2012) focuses on the evaluation of cluster analysis results, adding new visualizations and some new algorithms. [15]

Version 0.6 (June 2013) introduces a new 3D adaption of parallel coordinates for data visualization, apart from the usual additions of algorithms and index structures. [16]

Version 0.7 (August 2015) adds support for uncertain data types, and algorithms for the analysis of uncertain data. [17]

Version 0.7.5 (February 2019) adds additional clustering algorithms, anomaly detection algorithms, evaluation measures, and indexing structures. [18]

Version 0.8 (October 2020) adds automatic index creation, garbage collection, and incremental priority search, as well as many more algorithms such as BIRCH. [19]

Similar applications

See also

Related Research Articles

Data mining is the process of extracting and discovering patterns in large data sets involving methods at the intersection of machine learning, statistics, and database systems. Data mining is an interdisciplinary subfield of computer science and statistics with an overall goal of extracting information from a data set and transforming the information into a comprehensible structure for further use. Data mining is the analysis step of the "knowledge discovery in databases" process, or KDD. Aside from the raw analysis step, it also involves database and data management aspects, data pre-processing, model and inference considerations, interestingness metrics, complexity considerations, post-processing of discovered structures, visualization, and online updating.

<span class="mw-page-title-main">Outlier</span> Observation far apart from others in statistics and data science

In statistics, an outlier is a data point that differs significantly from other observations. An outlier may be due to a variability in the measurement, an indication of novel data, or it may be the result of experimental error; the latter are sometimes excluded from the data set. An outlier can be an indication of exciting possibility, but can also cause serious problems in statistical analyses.

Dimensionality reduction, or dimension reduction, is the transformation of data from a high-dimensional space into a low-dimensional space so that the low-dimensional representation retains some meaningful properties of the original data, ideally close to its intrinsic dimension. Working in high-dimensional spaces can be undesirable for many reasons; raw data are often sparse as a consequence of the curse of dimensionality, and analyzing the data is usually computationally intractable. Dimensionality reduction is common in fields that deal with large numbers of observations and/or large numbers of variables, such as signal processing, speech recognition, neuroinformatics, and bioinformatics.

<span class="mw-page-title-main">Cluster analysis</span> Grouping a set of objects by similarity

Cluster analysis or clustering is the task of grouping a set of objects in such a way that objects in the same group are more similar to each other than to those in other groups (clusters). It is a main task of exploratory data analysis, and a common technique for statistical data analysis, used in many fields, including pattern recognition, image analysis, information retrieval, bioinformatics, data compression, computer graphics and machine learning.

The curse of dimensionality refers to various phenomena that arise when analyzing and organizing data in high-dimensional spaces that do not occur in low-dimensional settings such as the three-dimensional physical space of everyday experience. The expression was coined by Richard E. Bellman when considering problems in dynamic programming. The curse generally refers to issues that arise when the number of datapoints is small relative to the intrinsic dimension of the data.

<span class="mw-page-title-main">R-tree</span> Data structures used in spatial indexing

R-trees are tree data structures used for spatial access methods, i.e., for indexing multi-dimensional information such as geographical coordinates, rectangles or polygons. The R-tree was proposed by Antonin Guttman in 1984 and has found significant use in both theoretical and applied contexts. A common real-world usage for an R-tree might be to store spatial objects such as restaurant locations or the polygons that typical maps are made of: streets, buildings, outlines of lakes, coastlines, etc. and then find answers quickly to queries such as "Find all museums within 2 km of my current location", "retrieve all road segments within 2 km of my location" or "find the nearest gas station". The R-tree can also accelerate nearest neighbor search for various distance metrics, including great-circle distance.

<span class="mw-page-title-main">Parallel coordinates</span> Chart displaying multivariate data

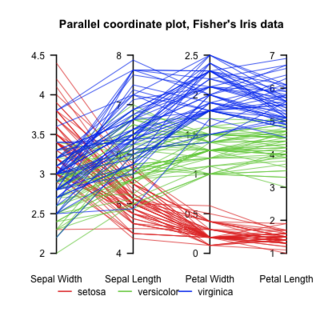
Parallel Coordinates plots are a common method of visualizing high-dimensional datasets to analyze multivariate data having multiple variables, or attributes.

In statistics, the k-nearest neighbors algorithm (k-NN) is a non-parametric supervised learning method first developed by Evelyn Fix and Joseph Hodges in 1951, and later expanded by Thomas Cover. It is used for classification and regression. In both cases, the input consists of the k closest training examples in a data set. The output depends on whether k-NN is used for classification or regression:

k-means clustering is a method of vector quantization, originally from signal processing, that aims to partition n observations into k clusters in which each observation belongs to the cluster with the nearest mean, serving as a prototype of the cluster. This results in a partitioning of the data space into Voronoi cells. k-means clustering minimizes within-cluster variances, but not regular Euclidean distances, which would be the more difficult Weber problem: the mean optimizes squared errors, whereas only the geometric median minimizes Euclidean distances. For instance, better Euclidean solutions can be found using k-medians and k-medoids.

<span class="mw-page-title-main">Weka (software)</span> Suite of machine learning software written in Java

Waikato Environment for Knowledge Analysis (Weka) is a collection of machine learning and data analysis free software licensed under the GNU General Public License. It was developed at the University of Waikato, New Zealand and is the companion software to the book "Data Mining: Practical Machine Learning Tools and Techniques".

In data analysis, anomaly detection is generally understood to be the identification of rare items, events or observations which deviate significantly from the majority of the data and do not conform to a well defined notion of normal behavior. Such examples may arouse suspicions of being generated by a different mechanism, or appear inconsistent with the remainder of that set of data.

Oracle Data Mining (ODM) is an option of Oracle Database Enterprise Edition. It contains several data mining and data analysis algorithms for classification, prediction, regression, associations, feature selection, anomaly detection, feature extraction, and specialized analytics. It provides means for the creation, management and operational deployment of data mining models inside the database environment.

Density-based spatial clustering of applications with noise (DBSCAN) is a data clustering algorithm proposed by Martin Ester, Hans-Peter Kriegel, Jörg Sander and Xiaowei Xu in 1996. It is a density-based clustering non-parametric algorithm: given a set of points in some space, it groups together points that are closely packed, and marks as outliers points that lie alone in low-density regions . DBSCAN is one of the most common, and most commonly cited, clustering algorithms.

BIRCH is an unsupervised data mining algorithm used to perform hierarchical clustering over particularly large data-sets. With modifications it can also be used to accelerate k-means clustering and Gaussian mixture modeling with the expectation–maximization algorithm. An advantage of BIRCH is its ability to incrementally and dynamically cluster incoming, multi-dimensional metric data points in an attempt to produce the best quality clustering for a given set of resources. In most cases, BIRCH only requires a single scan of the database.

Ordering points to identify the clustering structure (OPTICS) is an algorithm for finding density-based clusters in spatial data. It was presented by Mihael Ankerst, Markus M. Breunig, Hans-Peter Kriegel and Jörg Sander. Its basic idea is similar to DBSCAN, but it addresses one of DBSCAN's major weaknesses: the problem of detecting meaningful clusters in data of varying density. To do so, the points of the database are (linearly) ordered such that spatially closest points become neighbors in the ordering. Additionally, a special distance is stored for each point that represents the density that must be accepted for a cluster so that both points belong to the same cluster. This is represented as a dendrogram.

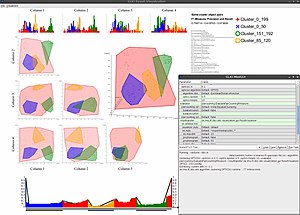
Clustering high-dimensional data is the cluster analysis of data with anywhere from a few dozen to many thousands of dimensions. Such high-dimensional spaces of data are often encountered in areas such as medicine, where DNA microarray technology can produce many measurements at once, and the clustering of text documents, where, if a word-frequency vector is used, the number of dimensions equals the size of the vocabulary.

In anomaly detection, the local outlier factor (LOF) is an algorithm proposed by Markus M. Breunig, Hans-Peter Kriegel, Raymond T. Ng and Jörg Sander in 2000 for finding anomalous data points by measuring the local deviation of a given data point with respect to its neighbours.

Hans-Peter Kriegel is a German computer scientist and professor at the Ludwig Maximilian University of Munich and leading the Database Systems Group in the Department of Computer Science. He was previously professor at the University of Würzburg and the University of Bremen after habilitation at the Technical University of Dortmund and doctorate from Karlsruhe Institute of Technology.

The following outline is provided as an overview of and topical guide to machine learning:

Arthur Zimek is a professor in data mining, data science and machine learning at the University of Southern Denmark in Odense, Denmark.

References

  1. Hans-Peter Kriegel, Peer Kröger, Arthur Zimek (2009). "Outlier Detection Techniques (Tutorial)" (PDF). 13th Pacific-Asia Conference on Knowledge Discovery and Data Mining (PAKDD 2009). Bangkok, Thailand. Retrieved 2010-03-26.{{cite journal}}: CS1 maint: multiple names: authors list (link)
  2. "ELKI Data Mining Framework". elki-project.github.io. Retrieved 2024-05-30.
  3. Gero, Shane; Whitehead, Hal; Rendell, Luke (2016). "Individual, unit and vocal clan level identity cues in sperm whale codas". Royal Society Open Science. 3 (1): 150372. Bibcode:2016RSOS....350372G. doi:10.1098/rsos.150372. ISSN   2054-5703. PMC   4736920 . PMID   26909165.
  4. Stahlberg, Felix; Schlippe, Tim; Vogel, Stephan; Schultz, Tanja (2013). "Pronunciation Extraction from Phoneme Sequences through Cross-Lingual Word-to-Phoneme Alignment". Statistical Language and Speech Processing. Lecture Notes in Computer Science. Vol. 7978. pp. 260–272. doi:10.1007/978-3-642-39593-2_23. ISBN   978-3-642-39592-5. ISSN   0302-9743.
  5. Verzola, Ivano; Donati, Alessandro; Martinez, Jose; Schubert, Matthias; Somodi, Laszlo (2016). "Project Sibyl: A Novelty Detection System for Human Spaceflight Operations". Space Ops 2016 Conference. doi:10.2514/6.2016-2405. ISBN   978-1-62410-426-8.
  6. Adham, Manal T.; Bentley, Peter J. (2016). "Evaluating clustering methods within the Artificial Ecosystem Algorithm and their application to bike redistribution in London". Biosystems. 146: 43–59. doi:10.1016/j.biosystems.2016.04.008. ISSN   0303-2647. PMID   27178785.
  7. Wisely, Michael; Hurson, Ali; Sarvestani, Sahra Sedigh (2015). "An extensible simulation framework for evaluating centralized traffic prediction algorithms". 2015 International Conference on Connected Vehicles and Expo (ICCVE). pp. 391–396. doi:10.1109/ICCVE.2015.86. ISBN   978-1-5090-0264-1. S2CID   1297145.
  8. Kriegel, Hans-Peter; Schubert, Erich; Zimek, Arthur (2016). "The (black) art of runtime evaluation: Are we comparing algorithms or implementations?". Knowledge and Information Systems. 52 (2): 341–378. doi:10.1007/s10115-016-1004-2. ISSN   0219-1377. S2CID   40772241.
  9. "DBIDs". ELKI homepage. Retrieved 13 December 2016.
  10. 1 2 Elke Achtert, Achmed Hettab, Hans-Peter Kriegel, Erich Schubert, Arthur Zimek (2011). Spatial Outlier Detection: Data, Algorithms, Visualizations. 12th International Symposium on Spatial and Temporal Databases (SSTD 2011). Minneapolis, MN: Springer. doi:10.1007/978-3-642-22922-0_41.{{cite conference}}: CS1 maint: multiple names: authors list (link)
  11. excerpt from "Data Mining Algorithms in ELKI" . Retrieved 17 October 2019.
  12. Elke Achtert, Hans-Peter Kriegel, Arthur Zimek (2008). ELKI: A Software System for Evaluation of Subspace Clustering Algorithms (PDF). Proceedings of the 20th international conference on Scientific and Statistical Database Management (SSDBM 08). Hong Kong, China: Springer. doi:10.1007/978-3-540-69497-7_41.{{cite conference}}: CS1 maint: multiple names: authors list (link)
  13. Elke Achtert, Thomas Bernecker, Hans-Peter Kriegel, Erich Schubert, Arthur Zimek (2009). ELKI in time: ELKI 0.2 for the performance evaluation of distance measures for time series (PDF). Proceedings of the 11th International Symposium on Advances in Spatial and Temporal Databases (SSTD 2010). Aalborg, Dänemark: Springer. doi:10.1007/978-3-642-02982-0_35.{{cite conference}}: CS1 maint: multiple names: authors list (link)
  14. Elke Achtert, Hans-Peter Kriegel, Lisa Reichert, Erich Schubert, Remigius Wojdanowski, Arthur Zimek (2010). Visual Evaluation of Outlier Detection Models. 15th International Conference on Database Systems for Advanced Applications (DASFAA 2010). Tsukuba, Japan: Springer. doi:10.1007/978-3-642-12098-5_34.{{cite conference}}: CS1 maint: multiple names: authors list (link)
  15. Elke Achtert, Sascha Goldhofer, Hans-Peter Kriegel, Erich Schubert, Arthur Zimek (2012). Evaluation of Clusterings Metrics and Visual Support. 28th International Conference on Data Engineering (ICDE). Washington, DC. doi:10.1109/ICDE.2012.128.{{cite conference}}: CS1 maint: multiple names: authors list (link)
  16. Elke Achtert, Hans-Peter Kriegel, Erich Schubert, Arthur Zimek (2013). Interactive Data Mining with 3D-Parallel-Coordinate-Trees. Proceedings of the ACM International Conference on Management of Data (SIGMOD). New York City, NY. doi:10.1145/2463676.2463696.{{cite conference}}: CS1 maint: multiple names: authors list (link)
  17. Erich Schubert; Alexander Koos; Tobias Emrich; Andreas Züfle; Klaus Arthur Schmid; Arthur Zimek (2015). "A Framework for Clustering Uncertain Data" (PDF). Proceedings of the VLDB Endowment. 8 (12): 1976–1987. doi:10.14778/2824032.2824115.
  18. Schubert, Erich; Zimek, Arthur (2019-02-10). "ELKI: A large open-source library for data analysis - ELKI Release 0.7.5 "Heidelberg"". arXiv: 1902.03616 [cs.LG].
  19. Schubert, Erich (2022). Automatic Indexing for Similarity Search in ELKI. Similarity Search and Applications. pp. 205–213. doi:10.1007/978-3-031-17849-8_16.