Global temperature record

Last updated

Temperature record of the last 2,000 years (Chart showing the so-called Medieval Warm Period and Little Ice Age were not planet-wide phenomena) 2000+ year global temperature including Medieval Warm Period and Little Ice Age - Ed Hawkins.svg
Temperature record of the last 2,000 years (Chart showing the so-called Medieval Warm Period and Little Ice Age were not planet-wide phenomena)

The global temperature record shows the fluctuations of the temperature of the atmosphere and the oceans through various spans of time. There are numerous estimates of temperatures since the end of the Pleistocene glaciation, particularly during the current Holocene epoch. Some temperature information is available through geologic evidence, going back millions of years. More recently, information from ice cores covers the period from 800,000 years before the present time until now. A study of the paleoclimate covers the time period from 12,000 years ago to the present. Tree rings and measurements from ice cores can give evidence about the global temperature from 1,000-2,000 years before the present until now. The most detailed information exists since 1850, when methodical thermometer-based records began. Modifications on the Stevenson-type screen were made for uniform instrument measurements around 1880. [1]

Contents

Geologic evidence (millions of years)

Reconstruction of the past 5 million years of climate history, based on oxygen isotope fractionation in deep sea sediment cores (serving as a proxy for the total global mass of glacial ice sheets), fitted to a model of orbital forcing (Lisiecki and Raymo 2005) and to the temperature scale derived from Vostok ice cores following Petit et al. (1999). Five Myr Climate Change.png
Reconstruction of the past 5 million years of climate history, based on oxygen isotope fractionation in deep sea sediment cores (serving as a proxy for the total global mass of glacial ice sheets), fitted to a model of orbital forcing (Lisiecki and Raymo 2005) and to the temperature scale derived from Vostok ice cores following Petit et al. (1999).

On longer time scales, sediment cores show that the cycles of glacials and interglacials are part of a deepening phase within a prolonged ice age that began with the glaciation of Antarctica approximately 40 million years ago. This deepening phase, and the accompanying cycles, largely began approximately 3 million years ago with the growth of continental ice sheets in the Northern Hemisphere. Gradual changes in Earth's climate of this kind have been frequent during the existence of planet Earth. Some of them are attributed to changes in the configuration of continents and oceans due to continental drift.[ citation needed ]

Ice cores (from 800,000 years before present)

Temperature estimates over 800,000 years of the EPICA ice cores in Antarctica. Temperatures are in Celsius relative to the average of the most recent 1,000 years; year 0 is 1950. EPICA temperature plot.svg
Temperature estimates over 800,000 years of the EPICA ice cores in Antarctica. Temperatures are in Celsius relative to the average of the most recent 1,000 years; year 0 is 1950.

Even longer term records exist for few sites: the recent Antarctic EPICA core reaches 800 kyr; many others reach more than 100,000 years. The EPICA core covers eight glacial/interglacial cycles. The NGRIP core from Greenland stretches back more than 100 kyr, with 5 kyr in the Eemian interglacial. Whilst the large-scale signals from the cores are clear, there are problems interpreting the detail, and connecting the isotopic variation to the temperature signal.

Ice core locations

Ice core data location.png

The World Paleoclimatology Data Center (WDC) maintains the ice core data files of glaciers and ice caps in polar and low latitude mountains all over the world.

Ice core records from Greenland

As a paleothermometry, the ice core in central Greenland showed consistent records on the surface-temperature changes. [5] According to the records, changes in global climate are rapid and widespread. Warming phase only needs simple steps, however, the cooling process requires more prerequisites and bases. [6] Also, Greenland has the clearest record of abrupt climate changes in the ice core, and there are no other records that can show the same time interval with equally high time resolution. [5]

When scientists explored the trapped gas in the ice core bubbles, they found that the methane concentration in Greenland ice core is significantly higher than that in Antarctic samples of similar age, the records of changes of concentration difference between Greenland and Antarctic reveal variation of latitudinal distribution of methane sources. [7] Increase in methane concentration shown by Greenland ice core records implies that the global wetland area has changed greatly over past years. [8] As a component of greenhouse gases, methane plays an important role in global warming. The variation of methane from Greenland records makes a unique contribution for global temperature records undoubtedly.

Ice core records from Antarctica

The Antarctic ice sheet originated in the late Eocene, the drilling has restored a record of 800,000 years in Dome Concordia, and it is the longest available ice core in Antarctica. In recent years, more and more new studies have provided older but discrete records. [9] Due to the uniqueness of the Antarctic ice sheet, the Antarctic ice core not only records the global temperature changes, but also contains huge quantities of information about the global biogeochemical cycles, climate dynamics and abrupt changes in global climate. [10]

By comparing with current climate records, the ice core records in Antarctica further confirm that polar amplification. [11] Although Antarctica is covered by the ice core records, the density is rather low considering the area of Antarctica. Exploring more drilling stations is the primary goal for current research institutions.

Ice core records from low-latitude regions

The ice core records from low-latitude regions are not as common as records from polar regions, however, these records still provide much useful information for scientists. Ice cores in low-latitude regions usually locates in high altitude areas. The Guliya record is the longest record from low-latitude, high altitude regions, which spans over 700,000 years. [12] According to these records, scientists found the evidence which can prove the Last Glacial Maximum (LGM) was colder in the tropics and subtropics than previously believed. [13] Also, the records from low-latitude regions helped scientists confirm that the 20th century was the warmest period in the last 1000 years. [12]

Paleoclimate (from 12,000 years before present)

Plot showing the variations, and relative stability, of climate during the last 12000 years. Holocene Temperature Variations.png
Plot showing the variations, and relative stability, of climate during the last 12000 years.

Many estimates of past temperatures have been made over Earth's history. The field of paleoclimatology includes ancient temperature records. As the present article is oriented toward recent temperatures, there is a focus here on events since the retreat of the Pleistocene glaciers. The 10,000 years of the Holocene epoch covers most of this period, since the end of the Northern Hemisphere's Younger Dryas millennium-long cooling. The Holocene Climatic Optimum was generally warmer than the 20th century, but numerous regional variations have been noted since the start of the Younger Dryas.

Tree rings and ice cores (from 1,000–2,000 years before present)

Proxy measurements can be used to reconstruct the temperature record before the historical period. Quantities such as tree ring widths, coral growth, isotope variations in ice cores, ocean and lake sediments, cave deposits, fossils, ice cores, borehole temperatures, and glacier length records are correlated with climatic fluctuations. From these, proxy temperature reconstructions of the last 2000 years have been performed for the northern hemisphere, and over shorter time scales for the southern hemisphere and tropics. [14] [15] [16]

Geographic coverage by these proxies is necessarily sparse, and various proxies are more sensitive to faster fluctuations. For example, tree rings, ice cores, and corals generally show variation on an annual time scale, but borehole reconstructions rely on rates of thermal diffusion, and small scale fluctuations are washed out. Even the best proxy records contain far fewer observations than the worst periods of the observational record, and the spatial and temporal resolution of the resulting reconstructions is correspondingly coarse. Connecting the measured proxies to the variable of interest, such as temperature or rainfall, is highly non-trivial. Data sets from multiple complementary proxies covering overlapping time periods and areas are reconciled to produce the final reconstructions. [16] [17]

Proxy reconstructions extending back 2,000 years have been performed, but reconstructions for the last 1,000 years are supported by more and higher quality independent data sets. These reconstructions indicate: [16]

Indirect historical proxies

As well as natural, numerical proxies (tree-ring widths, for example) there exist records from the human historical period that can be used to infer climate variations, including: reports of frost fairs on the Thames; records of good and bad harvests; dates of spring blossom or lambing; extraordinary falls of rain and snow; and unusual floods or droughts. [19] Such records can be used to infer historical temperatures, but generally in a more qualitative manner than natural proxies.

Recent evidence suggests that a sudden and short-lived climatic shift between 2200 and 2100 BCE occurred in the region between Tibet and Iceland, with some evidence suggesting a global change. The result was a cooling and reduction in precipitation. This is believed to be a primary cause of the collapse of the Old Kingdom of Egypt. [20]

Satellite and balloon (1950s–present)

A climate spiral depicting monthly anomalies in global temperature from 1880 till 2021.

Weather balloon radiosonde measurements of atmospheric temperature at various altitudes begin to show an approximation of global coverage in the 1950s. Since December 1978, microwave sounding units on satellites have produced data which can be used to infer temperatures in the troposphere.

Several groups have analyzed the satellite data to calculate temperature trends in the troposphere. Both the University of Alabama in Huntsville (UAH) and the private, NASA funded, corporation Remote Sensing Systems (RSS) find an upward trend.

For the lower troposphere, UAH found a global average trend between 1978 and 2019 of 0.130 degrees Celsius per decade. [21] RSS found a trend of 0.148 degrees Celsius per decade, to January 2011. [22]

In 2004 scientists found trends of +0.19  degrees Celsius per decade when applied to the RSS dataset. [23] Others found 0.20  degrees Celsius per decade up between 1978 and 2005, since which the dataset has not been updated. [24]

Thermometers (1850–present)

Global average temperature datasets from various scientific organizations show substantial agreement concerning the progress and extent of global warming: pairwise correlations of 1850+/1880+ datasets exceed 99.1%. 20200324 Global average temperature - NASA-GISS HadCrut NOAA Japan BerkeleyE.svg
Global average temperature datasets from various scientific organizations show substantial agreement concerning the progress and extent of global warming: pairwise correlations of 1850+/1880+ datasets exceed 99.1%.
In recent decades, new high temperature records have substantially outpaced new low temperature records on a growing portion of Earth's surface. Comparison shows seasonal variability. 1951+ Percent of global area at temperature records - Seasonal comparison - NOAA.svg
In recent decades, new high temperature records have substantially outpaced new low temperature records on a growing portion of Earth's surface. Comparison shows seasonal variability.

The instrumental temperature record is a record of temperatures within Earth's climate based on direct measurement of air temperature and ocean temperature, using thermometers and other thermometry devices. Instrumental temperature records are distinguished from indirect reconstructions using climate proxy data such as from tree rings and ocean sediments. [26] Instrument-based data are collected from thousands of meteorological stations, buoys and ships around the globe. Whilst many heavily-populated areas have a high density of measurements, observations are more widely spread in sparsely populated areas such as polar regions and deserts, as well as over many parts of Africa and South America. [27] Measurements were historically made using mercury or alcohol thermometers which were read manually, but are increasingly made using electronic sensors which transmit data automatically. Records of global average surface temperature are usually presented as anomalies rather than as absolute temperatures. A temperature anomaly is measured against a reference value (also called baseline period or long-term average). For example, a commonly used baseline period is the time period 1951-1980.

The longest-running temperature record is the Central England temperature data series, which starts in 1659. The longest-running quasi-global records start in 1850. [28] Temperatures are also measured in the upper atmosphere using a variety of methods, including radiosondes launched using weather balloons, a variety of satellites, and aircraft. [29] Satellites are used extensively to monitor temperatures in the upper atmosphere but to date have generally not been used to assess temperature change at the surface. In recent decades, global surface temperature datasets have been supplemented by extensive sampling of ocean temperatures at various depths, allowing estimates of ocean heat content.

The record shows a rising trend in global average surface temperatures (i.e. global warming) driven by human-induced emissions of greenhouse gases. The global average and combined land and ocean surface temperature show a warming of 1.09 °C (range: 0.95 to 1.20 °C) from 1850–1900 to 2011–2020, based on multiple independently produced datasets. [30] :5 The trend is faster since 1970s than in any other 50-year period over at least the last 2000 years. [30] :8 Within this long-term upward trend, there is short-term variability because of natural internal variability (e.g. ENSO, volcanic eruption), but record highs have been occurring regularly.

See also

Related Research Articles

<span class="mw-page-title-main">Climate variability and change</span> Change in the statistical distribution of climate elements for an extended period

Climate variability includes all the variations in the climate that last longer than individual weather events, whereas the term climate change only refers to those variations that persist for a longer period of time, typically decades or more. Climate change may refer to any time in Earth's history, but the term is now commonly used to describe contemporary climate change, often popularly referred to as global warming. Since the Industrial Revolution, the climate has increasingly been affected by human activities.

<span class="mw-page-title-main">Cryosphere</span> Those portions of Earths surface where water is in solid form

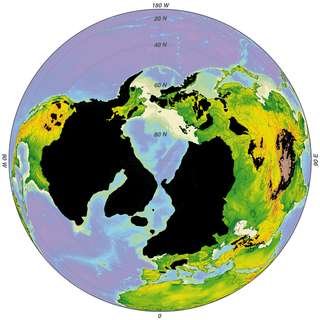
The cryosphere is an all-encompassing term for the portions of Earth's surface where water is in solid form, including sea ice, lake ice, river ice, snow cover, glaciers, ice caps, ice sheets, and frozen ground. Thus, there is a wide overlap with the hydrosphere. The cryosphere is an integral part of the global climate system. It also has important feedbacks on the climate system. These feedbacks come from the cryosphere's influence on surface energy and moisture fluxes, clouds, the water cycle, atmospheric and oceanic circulation.

<span class="mw-page-title-main">Paleoclimatology</span> Study of changes in ancient climate

Paleoclimatology is the scientific study of climates predating the invention of meteorological instruments, when no direct measurement data were available. As instrumental records only span a tiny part of Earth's history, the reconstruction of ancient climate is important to understand natural variation and the evolution of the current climate.

<span class="mw-page-title-main">Climate of Antarctica</span> Overview of climactic conditions in Antarctica

The climate of Antarctica is the coldest on Earth. The continent is also extremely dry, averaging 166 mm (6.5 in) of precipitation per year. Snow rarely melts on most parts of the continent, and, after being compressed, becomes the glacier ice that makes up the ice sheet. Weather fronts rarely penetrate far into the continent, because of the katabatic winds. Most of Antarctica has an ice-cap climate with extremely cold and dry weather.

<span class="mw-page-title-main">Temperature record of the last 2,000 years</span> Temperature trends in the Common Era

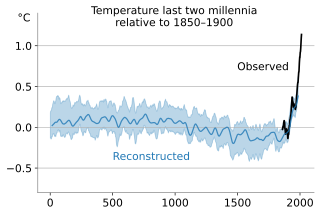
The temperature record of the last 2,000 years is reconstructed using data from climate proxy records in conjunction with the modern instrumental temperature record which only covers the last 170 years at a global scale. Large-scale reconstructions covering part or all of the 1st millennium and 2nd millennium have shown that recent temperatures are exceptional: the Intergovernmental Panel on Climate Change Fourth Assessment Report of 2007 concluded that "Average Northern Hemisphere temperatures during the second half of the 20th century were very likely higher than during any other 50-year period in the last 500 years and likely the highest in at least the past 1,300 years." The curve shown in graphs of these reconstructions is widely known as the hockey stick graph because of the sharp increase in temperatures during the last century. As of 2010 this broad pattern was supported by more than two dozen reconstructions, using various statistical methods and combinations of proxy records, with variations in how flat the pre-20th-century "shaft" appears. Sparseness of proxy records results in considerable uncertainty for earlier periods.

<span class="mw-page-title-main">Ice core</span> Cylindrical sample drilled from an ice sheet

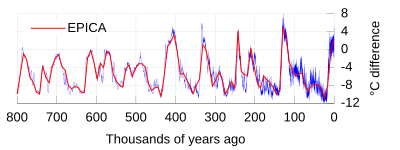
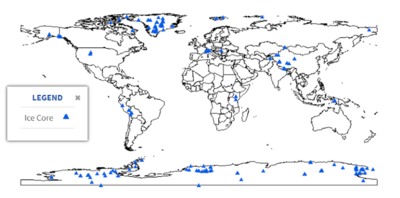
An ice core is a core sample that is typically removed from an ice sheet or a high mountain glacier. Since the ice forms from the incremental buildup of annual layers of snow, lower layers are older than upper ones, and an ice core contains ice formed over a range of years. Cores are drilled with hand augers or powered drills; they can reach depths of over two miles (3.2 km), and contain ice up to 800,000 years old.

<span class="mw-page-title-main">Ice sheet</span> Large mass of glacial ice

In glaciology, an ice sheet, also known as a continental glacier, is a mass of glacial ice that covers surrounding terrain and is greater than 50,000 km2 (19,000 sq mi). The only current ice sheets are the Antarctic ice sheet and the Greenland ice sheet. Ice sheets are bigger than ice shelves or alpine glaciers. Masses of ice covering less than 50,000 km2 are termed an ice cap. An ice cap will typically feed a series of glaciers around its periphery.

<span class="mw-page-title-main">Proxy (climate)</span> Preserved physical characteristics allowing reconstruction of past climatic conditions

In the study of past climates ("paleoclimatology"), climate proxies are preserved physical characteristics of the past that stand in for direct meteorological measurements and enable scientists to reconstruct the climatic conditions over a longer fraction of the Earth's history. Reliable global records of climate only began in the 1880s, and proxies provide the only means for scientists to determine climatic patterns before record-keeping began.

<span class="mw-page-title-main">Byrd Polar and Climate Research Center</span>

The Byrd Polar and Climate Research Center (BPCRC) is a polar, alpine, and climate research center at Ohio State University founded in 1960.

<span class="mw-page-title-main">Antarctic ice sheet</span> Earths southern polar ice cap

The Antarctic ice sheet is a continental glacier covering 98% of the Antarctic continent, with an area of 14 million square kilometres and an average thickness of over 2 kilometres (1.2 mi). It is the largest of Earth's two current ice sheets, containing 26.5 million cubic kilometres of ice, which is equivalent to 61% of all fresh water on Earth. Its surface is nearly continuous, and the only ice-free areas on the continent are the dry valleys, nunataks of the Antarctic mountain ranges, and sparse coastal bedrock. However, it is often subdivided into East Antarctic ice sheet (EAIS), West Antarctic ice sheet (WAIS), and Antarctic Peninsula (AP), due to the large differences in topography, ice flow, and glacier mass balance between the three regions.

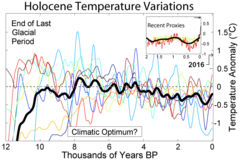
The Holocene Climate Optimum (HCO) was a warm period in the first half of the Holocene epoch, that occurred in the interval roughly 9,500 to 5,500 years BP, with a thermal maximum around 8000 years BP. It has also been known by many other names, such as Altithermal, Climatic Optimum, Holocene Megathermal, Holocene Optimum, Holocene Thermal Maximum, Hypsithermal, and Mid-Holocene Warm Period.

<span class="mw-page-title-main">Quaternary glaciation</span> Series of alternating glacial and interglacial periods

The Quaternary glaciation, also known as the Pleistocene glaciation, is an alternating series of glacial and interglacial periods during the Quaternary period that began 2.58 Ma and is ongoing. Although geologists describe this entire period up to the present as an "ice age", in popular culture this term usually refers to the most recent glacial period, or to the Pleistocene epoch in general. Since Earth still has polar ice sheets, geologists consider the Quaternary glaciation to be ongoing, though currently in an interglacial period.

Paleoceanography is the study of the history of the oceans in the geologic past with regard to circulation, chemistry, biology, geology and patterns of sedimentation and biological productivity. Paleoceanographic studies using environment models and different proxies enable the scientific community to assess the role of the oceanic processes in the global climate by the re-construction of past climate at various intervals. Paleoceanographic research is also intimately tied to paleoclimatology.

<span class="mw-page-title-main">East Antarctic Ice Sheet</span> Segment of the continental ice sheet that covers East Antarctica

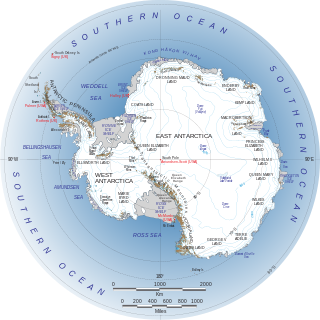
The East Antarctic Ice Sheet (EAIS) lies between 45° west and 168° east longitudinally. It was first formed around 34 million years ago, and it is the largest ice sheet on the entire planet, with far greater volume than the Greenland ice sheet or the West Antarctic Ice Sheet (WAIS), from which it is separated by the Transantarctic Mountains. The ice sheet is around 2.2 km (1.4 mi) thick on average and is 4,897 m (16,066 ft) at its thickest point. It is also home to the geographic South Pole, South Magnetic Pole and the Amundsen–Scott South Pole Station.

Deglaciation is the transition from full glacial conditions during ice ages, to warm interglacials, characterized by global warming and sea level rise due to change in continental ice volume. Thus, it refers to the retreat of a glacier, an ice sheet or frozen surface layer, and the resulting exposure of the Earth's surface. The decline of the cryosphere due to ablation can occur on any scale from global to localized to a particular glacier. After the Last Glacial Maximum, the last deglaciation begun, which lasted until the early Holocene. Around much of Earth, deglaciation during the last 100 years has been accelerating as a result of climate change, partly brought on by anthropogenic changes to greenhouse gases.

<span class="mw-page-title-main">Antarctic sea ice</span> Sea ice of the Southern Ocean

Antarctic sea ice is the sea ice of the Southern Ocean. It extends from the far north in the winter and retreats to almost the coastline every summer. Sea ice is frozen seawater that is usually less than a few meters thick. This is the opposite of ice shelves, which are formed by glaciers; they float in the sea, and are up to a kilometre thick. There are two subdivisions of sea ice: fast ice, which are attached to land; and ice floes, which are not.

<span class="mw-page-title-main">Climate change in Antarctica</span> Impacts of climate change on Antarctica

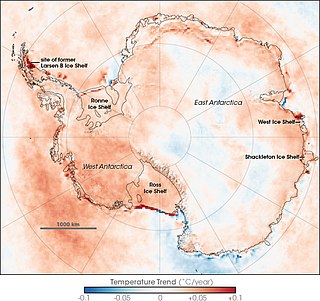
Climate change caused by greenhouse gas emissions from human activities occurs everywhere on Earth, and while Antarctica is less vulnerable to it than any other continent, climate change in Antarctica has already been observed. There has been an average temperature increase of >0.05 °C/decade since 1957 across the continent, although it had been uneven. While West Antarctica warmed by over 0.1 °C/decade from the 1950s to the 2000s and the exposed Antarctic Peninsula has warmed by 3 °C (5.4 °F) since the mid-20th century, the colder and more stable East Antarctica had been experiencing cooling until the 2000s. Around Antarctica, the Southern Ocean has absorbed more heat than any other ocean, with particularly strong warming at depths below 2,000 m (6,600 ft) and around the West Antarctic, which has warmed by 1 °C (1.8 °F) since 1955.

<span class="mw-page-title-main">Medieval Warm Period</span> Time of warm climate in the North Atlantic region lasting from c. 950 to c. 1250

The Medieval Warm Period (MWP), also known as the Medieval Climate Optimum or the Medieval Climatic Anomaly, was a time of warm climate in the North Atlantic region that lasted from c. 950 to c. 1250. Climate proxy records show peak warmth occurred at different times for different regions, which indicate that the MWP was not a globally uniform event. Some refer to the MWP as the Medieval Climatic Anomaly to emphasize that climatic effects other than temperature were also important.

The Atlantic meridional overturning circulation (AMOC) is a large system of ocean currents, like a conveyor belt. It is driven by differences in temperature and salt content and it is an important component of the climate system. However, the AMOC is not a static feature of global circulation. It is sensitive to changes in temperature, salinity and atmospheric forcings. Climate reconstructions from δ18O proxies from Greenland reveal an abrupt transition in global temperature about every 1470 years. These changes may be due to changes in ocean circulation, which suggests that there are two equilibria possible in the AMOC. Stommel made a two-box model in 1961 which showed two different states of the AMOC are possible on a single hemisphere. Stommel’s result with an ocean box model has initiated studies using three dimensional ocean circulation models, confirming the existence of multiple equilibria in the AMOC.

Global paleoclimate indicators are the proxies sensitive to global paleoclimatic environment changes. They are mostly derived from marine sediments. Paleoclimate indicators derived from terrestrial sediments, on the other hand, are commonly influenced by local tectonic movements and paleogeographic variations. Factors governing the Earth's climate system include plate tectonics, which controls the configuration of continents, the interplay between the atmosphere and the ocean, and the Earth's orbital characteristics. Global paleoclimate indicators are established based on the information extracted from the analyses of geologic materials, including biological, geochemical and mineralogical data preserved in marine sediments. Indicators are generally grouped into three categories; paleontological, geochemical and lithological.

References

  1. NOAA National Centers for Environmental Information, Monthly Global Climate Report for Annual 2022, published online January 2023, Retrieved on July 25, 2023 from https://www.ncei.noaa.gov/access/monitoring/monthly-report/global/202213.
  2. Lisiecki, Lorraine E.; Raymo, Maureen E. (January 2005). "A Pliocene-Pleistocene stack of 57 globally distributed benthic d18O records" (PDF). Paleoceanography. 20 (1): PA1003. Bibcode:2005PalOc..20.1003L. doi:10.1029/2004PA001071. hdl:2027.42/149224. S2CID   12788441.
    • Supplement: Lisiecki, L. E.; Raymo, M. E. (2005). "Pliocene-Pleistocene stack of globally distributed benthic stable oxygen isotope records". Pangaea. doi:10.1594/PANGAEA.704257.
  3. Petit, J. R.; Jouzel, J.; Raynaud, D.; Barkov, N. I.; Barnola, J. M.; Basile, I.; Bender, M.; Chappellaz, J.; Davis, J.; Delaygue, G.; Delmotte, M.; Kotlyakov, V. M.; Legrand, M.; Lipenkov, V.; Lorius, C.; Pépin, L.; Ritz, C.; Saltzman, E.; Stievenard, M. (1999). "Climate and Atmospheric History of the Past 420,000 years from the Vostok Ice Core, Antarctica". Nature. 399 (6735): 429–436. Bibcode:1999Natur.399..429P. doi:10.1038/20859. S2CID   204993577.
  4. Bradley, Raymond S (1999). Paleoclimatology: Reconstructing Climates of the Quaternary. Elsevier. pp. 158–160.
  5. 1 2 Alley, R. B. (2000-02-15). "Ice-core evidence of abrupt climate changes". Proceedings of the National Academy of Sciences. 97 (4): 1331–1334. Bibcode:2000PNAS...97.1331A. doi: 10.1073/pnas.97.4.1331 . ISSN   0027-8424. PMC   34297 . PMID   10677460.
  6. Severinghaus, Jeffrey P.; Sowers, Todd; Brook, Edward J.; Alley, Richard B.; Bender, Michael L. (January 1998). "Timing of abrupt climate change at the end of the Younger Dryas interval from thermally fractionated gases in polar ice". Nature. 391 (6663): 141–146. Bibcode:1998Natur.391..141S. doi:10.1038/34346. ISSN   0028-0836. S2CID   4426618.
  7. Webb, Robert S.; Clark, Peter U.; Keigwin, Lloyd D. (1999), "Preface", Mechanisms of Global Climate Change at Millennial Time Scales, vol. 112, Washington, D. C.: American Geophysical Union, pp. vii–viii, Bibcode:1999GMS...112D...7W, doi:10.1029/gm112p0vii, ISBN   0-87590-095-X , retrieved 2021-04-18
  8. Chappellaz, Jérôme; Brook, Ed; Blunier, Thomas; Malaizé, Bruno (1997-11-30). "CH4and δ18O of O2records from Antarctic and Greenland ice: A clue for stratigraphic disturbance in the bottom part of the Greenland Ice Core Project and the Greenland Ice Sheet Project 2 ice cores". Journal of Geophysical Research: Oceans. 102 (C12): 26547–26557. Bibcode:1997JGR...10226547C. doi: 10.1029/97jc00164 . ISSN   0148-0227.
  9. Higgins, John A.; Kurbatov, Andrei V.; Spaulding, Nicole E.; Brook, Ed; Introne, Douglas S.; Chimiak, Laura M.; Yan, Yuzhen; Mayewski, Paul A.; Bender, Michael L. (2015-05-11). "Atmospheric composition 1 million years ago from blue ice in the Allan Hills, Antarctica". Proceedings of the National Academy of Sciences. 112 (22): 6887–6891. Bibcode:2015PNAS..112.6887H. doi: 10.1073/pnas.1420232112 . ISSN   0027-8424. PMC   4460481 . PMID   25964367.
  10. Brook, Edward J.; Buizert, Christo (June 2018). "Antarctic and global climate history viewed from ice cores". Nature. 558 (7709): 200–208. Bibcode:2018Natur.558..200B. doi:10.1038/s41586-018-0172-5. ISSN   0028-0836. PMID   29899479. S2CID   49191229.
  11. Cuffey, Kurt M.; Clow, Gary D.; Steig, Eric J.; Buizert, Christo; Fudge, T. J.; Koutnik, Michelle; Waddington, Edwin D.; Alley, Richard B.; Severinghaus, Jeffrey P. (2016-11-28). "Deglacial temperature history of West Antarctica". Proceedings of the National Academy of Sciences. 113 (50): 14249–14254. Bibcode:2016PNAS..11314249C. doi: 10.1073/pnas.1609132113 . ISSN   0027-8424. PMC   5167188 . PMID   27911783.
  12. 1 2 Thompson, L. G. (2004), "High Altitude, Mid- and Low-Latitude Ice Core Records: Implications for Our Future", Earth Paleoenvironments: Records Preserved in Mid- and Low-Latitude Glaciers, Developments in Paleoenvironmental Research, vol. 9, Dordrecht: Kluwer Academic Publishers, pp. 3–15, doi: 10.1007/1-4020-2146-1_1 , ISBN   1-4020-2145-3
  13. Thompson, L. G.; Mosley-Thompson, E.; Davis, M. E.; Lin, P. -N.; Henderson, K. A.; Cole-Dai, J.; Bolzan, J. F.; Liu, K. -b. (1995-07-07). "Late Glacial Stage and Holocene Tropical Ice Core Records from Huascaran, Peru". Science. 269 (5220): 46–50. Bibcode:1995Sci...269...46T. doi:10.1126/science.269.5220.46. ISSN   0036-8075. PMID   17787701. S2CID   25940751.
  14. J.T. Houghton; et al., eds. (2001). "Figure 1: Variations of the Earth's surface temperature over the last 140 years and the last millennium.". Summary for policy makers. IPCC Third Assessment Report - Climate Change 2001 Contribution of Working Group I. Intergovernmental Panel on Climate Change. Archived from the original on November 13, 2016. Retrieved May 12, 2011.
  15. J.T. Houghton; et al., eds. (2001). Chapter 2. Observed climate variability and change. Climate Change 2001: Working Group I The Scientific Basis. Intergovernmental Panel on Climate Change. Archived from the original on March 9, 2016. Retrieved May 12, 2011.
  16. 1 2 3 National Research Council (U.S.). Committee on Surface Temperature Reconstructions for the Last 2,000 Years Surface temperature reconstructions for the last 2,000 years (2006), National Academies Press ISBN   978-0-309-10225-4
  17. Mann, Michael E.; Zhang, Zhihua; Hughes, Malcolm K.; Bradley, Raymond S.; Miller, Sonya K.; Rutherford, Scott; Ni, Fenbiao (2008). "Proxy-based reconstructions of hemispheric and global surface temperature variations over the past two millennia". Proceedings of the National Academy of Sciences. 105 (36): 13252–13257. Bibcode:2008PNAS..10513252M. doi: 10.1073/pnas.0805721105 . PMC   2527990 . PMID   18765811.
  18. "The Climate Epochs That Weren't". State of the Planet. 2019-07-24. Retrieved 2021-11-27.
  19. O.Muszkat, The outline of the problems and methods used for research of the history of the climate in the Middle Ages, (in polish), Przemyśl 2014, ISSN   1232-7263
  20. The Fall of the Egyptian Old Kingdom Hassan, Fekri BBC June 2001
  21. "Global Temperature Report: January 2019" (PDF). UAH.
  22. "RSS / MSU and AMSU Data / Description". Archived from the original on 23 November 2012. Retrieved 26 February 2011.
  23. "Archived copy" (PDF). Archived from the original (PDF) on 2011-03-14. Retrieved 2011-03-04.{{cite web}}: CS1 maint: archived copy as title (link)
  24. "Index of CCSP".
  25. "Mean Monthly Temperature Records Across the Globe / Timeseries of Global Land and Ocean Areas at Record Levels for October from 1951-2023". NCEI.NOAA.gov. National Centers for Environmental Information (NCEI) of the National Oceanic and Atmospheric Administration (NOAA). November 2023. Archived from the original on 16 November 2023. (change "202310" in URL to see years other than 2023, and months other than 10=October)
  26. "What Are "Proxy" Data?". NCDC.NOAA.gov. National Climatic Data Center, later called the National Centers for Environmental Information, part of the National Oceanic and Atmospheric Administration. 2014. Archived from the original on 10 October 2014.
  27. "GCOS - Deutscher Wetterdienst - CLIMAT Availability". gcos.dwd.de. Retrieved 2022-05-12.
  28. Brohan, P.; Kennedy, J. J.; Harris, I.; Tett, S. F. B.; Jones, P. D. (2006). "Uncertainty estimates in regional and global observed temperature changes: a new dataset from 1850". J. Geophys. Res. 111 (D12): D12106. Bibcode:2006JGRD..11112106B. CiteSeerX   10.1.1.184.4382 . doi:10.1029/2005JD006548. S2CID   250615.
  29. "Remote Sensing Systems". www.remss.com. Retrieved 2022-05-19.
  30. 1 2 IPCC (2021). "Summary for Policymakers" (PDF). The Physical Science Basis. Contribution of Working Group I to the Sixth Assessment Report of the Intergovernmental Panel on Climate Change. ISBN   978-92-9169-158-6.