Graphviz is a package of open-source tools initiated by AT&T Labs Research for drawing graphs specified in DOT language scripts having the file name extension "gv". It also provides libraries for software applications to use the tools. Graphviz is free software licensed under the Eclipse Public License.
DOT is a graph description language, developed as a part of the Graphviz project. DOT graphs are typically stored as files with the .gv or .dot filename extension — .gv is preferred, to avoid confusion with the .dot extension used by versions of Microsoft Word before 2007. dot is also the name of the main program to process DOT files in the Graphviz package.
A GIS software program is a computer program to support the use of a geographic information system, providing the ability to create, store, manage, query, analyze, and visualize geographic data, that is, data representing phenomena for which location is important. The GIS software industry encompasses a broad range of commercial and open-source products that provide some or all of these capabilities within various information technology architectures.

Origin is a proprietary computer program for interactive scientific graphing and data analysis. It is produced by OriginLab Corporation, and runs on Microsoft Windows. It has inspired several platform-independent open-source clones and alternatives like LabPlot and SciDAVis.

QtiPlot is a cross-platform computer program for interactive scientific graphing and data analysis. It is similar to Origin or SigmaPlot.

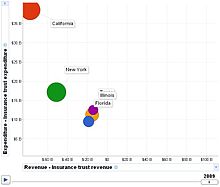
Trendalyzer is an information visualization software for animation of statistics that was initially developed by Hans Rosling's Gapminder Foundation in Sweden. In March 2007 it was acquired by Google Inc. The current beta version is a Flash application that is preloaded with statistical and historical data about the development of the countries of the world.
Tableau Software is an American interactive data visualization software company focused on business intelligence. It was founded in 2003 in Mountain View, California, and is currently headquartered in Seattle, Washington. In 2019 the company was acquired by Salesforce for $15.7 billion. At the time, this was the largest acquisition by Salesforce since its foundation. It was later surpassed by Salesforce's acquisition of Slack.
BigQuery is Google's fully managed, serverless data warehouse that enables scalable analysis over petabytes of data. It is a Platform as a Service (PaaS) that supports querying using a dialect of SQL. It also has built-in machine learning capabilities. BigQuery was announced in May 2010 and made generally available in November 2011.

Google Fusion Tables was a web service provided by Google for data management. Fusion tables was used for gathering, visualising and sharing data tables. Data are stored in multiple tables that Internet users can view and download.
Data journalism or data-driven journalism (DDJ) is journalism based on the filtering and analysis of large data sets for the purpose of creating or elevating a news story.

Wikidata is a collaboratively edited multilingual knowledge graph hosted by the Wikimedia Foundation. It is a common source of open data that Wikimedia projects such as Wikipedia, and anyone else, can use under the CC0 public domain license. Wikidata is a wiki powered by the software MediaWiki, including its extension for semi-structured data, the Wikibase.
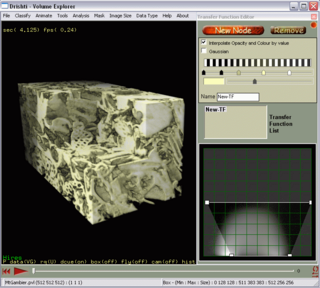
Drishti is a multi-platform, open-source volume-exploration and presentation tool. Written for visualizing tomography data, electron-microscopy data and the like, it aims to ease understanding of data sets and to assist with conveying that understanding to the research community or to lay persons. From the website:
"The central idea about Drishti is that the scientists should be able to use it for exploring volumetric datasets as well as use it in presentations."

NodeXL is a network analysis and visualization software package for Microsoft Excel 2007/2010/2013/2016. The package is similar to other network visualization tools such as Pajek, UCINet, and Gephi. It is widely applied in ring, mapping of vertex and edge, and customizable visual attributes and tags. NodeXL enables researchers to undertake social network analysis work metrics such as centrality, degree, and clustering, as well as monitor relational data and describe the overall relational network structure. When applied to Twitter data analysis, it showed the total network of all users participating in public discussion and its internal structure through data mining. It allows social Network analysis (SNA) to emphasize the relationships rather than the isolated individuals or organizations, allowing interested parties to investigate the two-way dialogue between organizations and the public. SNA also provides a flexible measurement system and parameter selection to confirm the influential nodes in the network, such as in-degree and out-degree centrality. The software contains network visualization, social network analysis features, access to social media network data importers, advanced network metrics, and automation.
The Science of Science (Sci2) Tool is a modular toolset specifically designed for the study of science. It supports the temporal, geospatial, topical, and network analysis and visualization of datasets at the micro (individual), meso (local), and macro (global) levels. Users of the tool can:

Plotly is a technical computing company headquartered in Montreal, Quebec, that develops online data analytics and visualization tools. Plotly provides online graphing, analytics, and statistics tools for individuals and collaboration, as well as scientific graphing libraries for Python, R, MATLAB, Perl, Julia, Arduino, JavaScript and REST.

Enigma Technologies, Inc., is a data science company headquartered in New York City that specializes in providing data and intelligence about businesses. The company is mainly known for Enigma Public, a now defunct library of public data.
Google Kythe is a source code indexer and cross-referencer for code comprehension which describes itself as a "pluggable, (mostly) language-agnostic ecosystem for building tools that work with code".

The KDE Gear is a set of applications and supporting libraries that are developed by the KDE community, primarily used on Linux-based operating systems but mostly multiplatform, and released on a common release schedule.
Datacommons.org is an open knowledge graph hosted by Google that provides a unified view across multiple public datasets, combining economic, scientific and other open datasets into an integrated data graph. The Datacommons.org site was launched in May 2018 with an initial dataset consisting of fact-checking data published in Schema.org "ClaimReview" format by several fact checkers from the International Fact-Checking Network. Google has worked with partners including the United States Census, the World Bank, and US Bureau of Labor Statistics to populate the repository, which also hosts data from Wikipedia, the National Oceanic and Atmospheric Administration and the Federal Bureau of Investigation. The service expanded during 2019 to include an RDF-style Knowledge Graph populated from a number of largely statistical open datasets. The service was announced to a wider audience in 2019. In 2020 the service improved its coverage of non-US datasets, while also increasing its coverage of bioinformatics and coronavirus.