List of large-scale temperature reconstructions of the last 2,000 years
Last updated
This article needs to be updated. Please help update this article to reflect recent events or newly available information.(January 2017)
This list of large-scale temperature reconstructions of the last 2,000 years includes climate reconstructions which have contributed significantly to the modern consensus on the temperature record of the past 2,000 years.
The instrumental temperature record only covers the last 150 years at a hemispheric or global scale, and reconstructions of earlier periods are based on climate proxies. In an early attempt to show that climate had changed, Hubert Lamb's 1965 paper generalised from temperature records of central England together with historical, botanical, and archeological evidence to produce a qualitative estimate of temperatures in the North Atlantic region. Subsequent quantitative reconstructions used statistical techniques with various climate proxies to produce larger-scale reconstructions. Tree ring proxies can give an annual resolution of extratropical regions of the northern hemisphere and can be statistically combined with other sparser proxies to produce multiproxy hemispherical or global reconstructions.
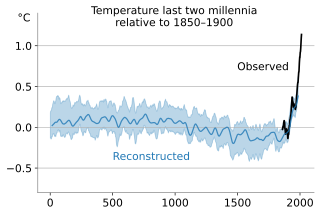
Quantitative reconstructions have consistently shown earlier temperatures below the temperature levels reached in the late 20th century. This pattern as seen in Mann, Bradley & Hughes 1999 was dubbed the hockey stick graph, and as of 2010 this broad conclusion was supported by more than two dozen reconstructions, using various statistical methods and combinations of proxy records, with variations in how flat the pre-20th century "shaft" appears.[1]
Fisher 1997 "High resolution reconstructed Northern Hemisphere temperatures for the last few centuries: using regional average tree ring, ice core and historical annual time series".
Cited in IPCC TAR
The IPCC Third Assessment Report (TAR WG1) of 2001 cited the following reconstructions supporting its conclusion that the 1990s was likely to have been the warmest Northern Hemisphere decade for 1,000 years:[2]
Mann, Bradley & Hughes 1998 "Global-scale temperature patterns and climate forcing over the past six centuries"
Jones et al. 1998 "High-resolution palaeoclimatic records for the last millennium: interpretation, integration and comparison with General Circulation Model control-run temperatures".
North et al. 2006 highlighted six recent reconstructions, one of which was not cited in AR4:[3]
Huang, Pollack & Shen 2000 "Temperature trends over the past five centuries reconstructed from borehole temperatures"
Cited in IPCC AR4
The IPCC Fourth Assessment Report (AR4 WG1) of 2007 cited the following reconstructions in support of its conclusion that the 20th century was likely to have been the warmest in the Northern Hemisphere for at least 1,300 years:[4]
Jones et al. (1998) [also in TAR], calibrated by Jones, Osborn & Briffa 2001 "The Evolution of Climate Over the Last Millennium".
Mann, Bradley & Hughes (1999) [also in TAR]
Briffa (2000) [also in TAR], calibrated by Briffa, Osborn & Schweingruber 2004 "Large-scale temperature inferences from tree rings: a review".
Crowley & Lowery 2000 "How Warm Was the Medieval Warm Period?" [also in TAR]
Briffa et al. 2001 "Low-frequency temperature variations from a northern tree ring density network".
Esper, Cook & Schweingruber 2002 "Low-Frequency Signals in Long Tree-Ring Chronologies for Reconstructing Past Temperature Variability", recalibrated by Cook, Esper & D'Arrigo 2004 "Extra-tropical Northern Hemisphere land temperature variability over the past 1000 years".
Mann & Jones 2003 "Global surface temperatures over the past two millennia."
Oerlemans 2005 "Extracting a climate signal from 169 glacier records".
Rutherford et al. 2005 "Proxy-based Northern Hemisphere surface temperature reconstructions: Sensitivity to method, predictor network, target season, and target domain".
Moberg et al. 2005 "Highly variable Northern Hemisphere temperatures reconstructed from low- and high-resolution proxy data".
Osborn & Briffa 2006 "The spatial extent of 20th-century warmth in the context of the past 1200 years".
Hegerl et al. 2006 "Climate sensitivity constrained by temperature reconstructions over the past seven centuries".
Cited in IPCC AR5
The IPCC Fifth Assessment Report (AR5 WG1) of 2013 examined temperature variations during the last two millennia, and cited the following reconstructions in support of its conclusion that for average annual Northern Hemisphere temperatures, "the period 1983–2012 was very likely the warmest 30-year period of the last 800 years (high confidence) and likely the warmest 30-year period of the last 1400 years (medium confidence)":[5]
Frank, Esper & Cook (2007) "Adjustment for proxy number and coherence in a large-scale temperature reconstruction".
Hegerl et al. (2007) "Detection of human influence on a new, validated 1500–year temperature reconstruction".
Juckes et al. 2007 "Millennial temperature reconstruction intercomparison and evaluation".
Loehle & McCulloch (2008) "Correction to: A 2000-year global temperature reconstruction based on non-tree ring proxies".
Mann et al. 2008 "Proxy-based reconstructions of hemispheric and global surface temperature variations over the past two millennia".
Mann et al. 2009 "Global Signatures and Dynamical Origins of the Little Ice Age and Medieval Climate Anomaly".
Ljungqvist 2010 "A New Reconstruction of Temperature Variability in the Extra-Tropical Northern Hemisphere During the Last Two Millennia".
Christiansen & Ljungqvist 2012 "The extra-tropical Northern Hemisphere temperature in the last two millennia: Reconstructions of low-frequency variability".
Leclercq & Oerlemans (2012) "Global and Hemispheric temperature reconstruction from glacier length fluctuations".
Shi et al. 2013 "Northern Hemisphere temperature reconstruction during the last millennium using multiple annual proxies".
Further reconstructions
Smith et al. 2006 "Reconstructing hemispheric-scale climates from multiple stalagmite records".
Huang, Pollack & Shen 2008 "A late Quaternary climate reconstruction based on borehole heat flux data, borehole temperature data, and the instrumental record"
Tingley & Huybers 2010a "A Bayesian Algorithm for Reconstructing Climate Anomalies in Space and Time".
Christiansen & Ljungqvist 2011 "Reconstruction of the Extratropical NH Mean Temperature over the Last Millennium with a Method that Preserves Low-Frequency Variability".
Ljungqvist et al. 2012 "Northern Hemisphere temperature patterns in the last 12 centuries".
Marcott et al. 2013 "A Reconstruction of Regional and Global Temperature for the Past 11,300 Years"
PAGES 2k Consortium 2013 (78 researchers, corresponding author Darrell S. Kaufman) "Continental-scale temperature variability during the past two millennia"
IPCC FAR WG1 (1990), Houghton, J.T.; Jenkins, G.J.; Ephraums, J.J. (eds.), Climate Change: The IPCC Scientific Assessment (1990), Report prepared for Intergovernmental Panel on Climate Change by Working Group I, Cambridge University Press, ISBN978-0-521-40360-3 (pb: 0-521-40720-6).
Mann, Michael E.; Park, Jeffrey; Bradley, Raymond S. (16 November 1995), "Global interdecadal and century-scale climate oscillations during the past five centuries", Nature, 378 (6554): 266–270, Bibcode:1995Natur.378..266M, doi:10.1038/378266a0, S2CID30872107
1996
Nicholls et al. "Chap. 3: Observed Climate Variability and Change". In IPCC SAR WG1 (1996).
Fisher, D. A. (1997), "High resolution reconstructed Northern Hemisphere temperatures for the last few centuries: using regional average tree ring, ice core and historical annual time series", Paper U32C-7 in Supplement to EOS. Transactions
Briffa, Keith R. (1 January 2000), "Annual climate variability in the Holocene: interpreting the message of ancient trees", Quaternary Science Reviews, 19 (1–5): 87–105, Bibcode:2000QSRv...19...87B, doi:10.1016/S0277-3791(99)00056-6 .
Crowley, Thomas J.; Lowery, Thomas S. (February 2000), "How Warm Was the Medieval Warm Period?", Ambio: A Journal of the Human Environment, 29 (1): 51–54, doi:10.1579/0044-7447-29.1.51, S2CID86527510
Briffa, K. R.; Osborn, T. J.; Schweingruber, F. H.; Harris, I. C.; Jones, P. D.; Shiyatov, S. G.; Vaganov, E. A. (16 February 2001), "Low-frequency temperature variations from a northern tree ring density network", Journal of Geophysical Research, 106 (D3): 2929, Bibcode:2001JGR...106.2929B, doi:10.1029/2000JD900617, S2CID129031846
Briffa, K. R.; Osborn, T. J.; Schweingruber, F. H. (January 2004), "Large-scale temperature inferences from tree rings: A review", Global and Planetary Change, 40 (1–2): 11–26, Bibcode:2004GPC....40...11B, doi:10.1016/S0921-8181(03)00095-X
Moberg, Anders; Sonechkin, Dimitry M.; Holmgren, Karin; Datsenko, Nina M.; Karlén, Wibjörn; Lauritzen, Stein-Erik (23 February 2006), "Corrigendum: Highly variable Northern Hemisphere temperatures reconstructed from low- and high-resolution proxy data", Nature, 439 (7079): 1014, Bibcode:2006Natur.439.1014M, doi:10.1038/nature04575
Hegerl, Gabriele C.; Crowley, Thomas J.; Hyde, William T.; Frame, David J. (20 April 2006), "Climate sensitivity constrained by temperature reconstructions over the past seven centuries", Nature, 440 (7087): 1029–1032, Bibcode:2006Natur.440.1029H, doi:10.1038/nature04679, PMID16625192, S2CID4387059
Juckes, M. N.; Allen, M. R.; Briffa, K. R.; Esper, J.; Hegerl, G. C.; Moberg, Anders; Osborn, T. J.; Weber, S. L. (5 October 2007), "Millennial temperature reconstruction intercomparison and evaluation", Climate of the Past, 3 (4): 591, Bibcode:2007CliPa...3..591J, doi:10.5194/cp-3-591-2007
Mann, Michael E.; Zhang, Zhihua; Hughes, Malcolm K.; Bradley, Raymond S.; Miller, Sonya K.; Rutherford, Scott; Ni, Fenbiao (9 September 2008), "Proxy-based reconstructions of hemispheric and global surface temperature variations over the past two millennia", Proceedings of the National Academy of Sciences of the United States of America, 105 (36): 13252–13257, Bibcode:2008PNAS..10513252M, doi:10.1073/pnas.0805721105, PMC2527990, PMID18765811
Mann, Michael E.; Zhang, Zhihua; Rutherford, Scott; Bradley, Raymond S.; Hughes, Malcolm K.; Shindell, Ddrew; Ammann, Caspar M.; Faluvegi, Greg; Ni, Fenbiao (27 November 2009), "Global Signatures and Dynamical Origins of the Little Ice Age and Medieval Climate Anomaly", Science, 326 (5957): 1256–1260, Bibcode:2009Sci...326.1256M, CiteSeerX10.1.1.210.9930, doi:10.1126/science.1177303, PMID19965474, S2CID18655276
Ljungqvist, F. C.; Krusic, P. J.; Brattström, G.; Sundqvist, H. S. (3 February 2012), "Northern Hemisphere temperature patterns in the last 12 centuries", Climate of the Past, 8 (1): 227, Bibcode:2012CliPa...8..227L, doi:10.5194/cp-8-227-2012
Christiansen, B.; Ljungqvist, F. C. (18 April 2012), "The extra-tropical Northern Hemisphere temperature in the last two millennia: Reconstructions of low-frequency variability", Climate of the Past, 8 (2): 765, Bibcode:2012CliPa...8..765C, doi:10.5194/cp-8-765-2012
Masson-Delmotte V, Schulz M, Abe-Ouchi A, Beer J, Ganopolski A, Rouco JG, etal. (2013). "Chapter 5: Information from Paleoclimate Archives"(PDF). In Stocker TF, Qin D, Plattner GK, Tignor M, Allen SK, Boschung J, etal. (eds.). Climate Change 2013: The Physical Science Basis. Contribution of Working Group I to the Fifth Assessment Report of the Intergovernmental Panel on Climate Change. Cambridge, United Kingdom and New York, NY, USA: Cambridge University Press. pp.383–464. ISBN978-1-107-05799-9. Archived(PDF) from the original on 6 December 2017.
PAGES 2k Consortium, Moinuddin; Anchukaitis, Kevin J.; Asrat, Asfawossen; Borgaonkar, Hemant P.; Braida, Martina; Buckley, Brendan M.; Büntgen, Ulf; Chase, Brian M.; Christie, Duncan A.; Cook, Edward R.; Curran, Mark A. J.; Diaz, Henry F.; Esper, Jan; Fan, Ze-Xin; Gaire, Narayan P.; Ge, Quansheng; Gergis, Joëlle; González-Rouco, J Fidel; Goosse, Hugues; Grab, Stefan W.; Graham, Nicholas; Graham, Rochelle; Grosjean, Martin; Hanhijärvi, Sami T.; Kaufman, Darrell S.; Kiefer, Thorsten; Kimura, Katsuhiko; Korhola, Atte A.; Krusic, Paul J.; etal. (21 April 2013), "Continental-scale temperature variability during the past two millennia"(PDF), Nature Geoscience, 6 (5): 339, Bibcode:2013NatGe...6..339P, doi:10.1038/ngeo1797 (78 researchers, corresponding author Darrell S. Kaufman)
Shi, F.; Yang, B.; Mairesse, A.; von Gunten, L.; Li, J.; Bräuning, A.; Yang, F.; Xiao, X. (2013), "Northern Hemisphere temperature reconstruction during the last millennium using multiple annual proxies", Climate Research, 56 (3): 231, Bibcode:2013ClRes..56..231S, doi:10.3354/cr01156, S2CID54719300pdf
Efforts to scientifically ascertain and attribute mechanisms responsible for recent global warming and related climate changes on Earth have found that the main driver is elevated levels of greenhouse gases produced by human activities, with natural forces adding variability. The likely range of human-induced surface-level air warming by 2010–2019 compared to levels in 1850–1900 is 0.8 °C to 1.3 °C, with a best estimate of 1.07 °C. This is close to the observed overall warming during that time of 0.9 °C to 1.2 °C, while temperature changes during that time were likely only ±0.1 °C due to natural forcings and ±0.2 °C due to variability in the climate.
The temperature record of the last 2,000 years is reconstructed using data from climate proxy records in conjunction with the modern instrumental temperature record which only covers the last 170 years at a global scale. Large-scale reconstructions covering part or all of the 1st millennium and 2nd millennium have shown that recent temperatures are exceptional: the Intergovernmental Panel on Climate Change Fourth Assessment Report of 2007 concluded that "Average Northern Hemisphere temperatures during the second half of the 20th century were very likely higher than during any other 50-year period in the last 500 years and likely the highest in at least the past 1,300 years." The curve shown in graphs of these reconstructions is widely known as the hockey stick graph because of the sharp increase in temperatures during the last century. As of 2010 this broad pattern was supported by more than two dozen reconstructions, using various statistical methods and combinations of proxy records, with variations in how flat the pre-20th-century "shaft" appears. Sparseness of proxy records results in considerable uncertainty for earlier periods.
Michael Evan Mann is an American climatologist and geophysicist. He is the director of the Center for Science, Sustainability & the Media at the University of Pennsylvania. Mann has contributed to the scientific understanding of historic climate change based on the temperature record of the past thousand years. He has pioneered techniques to find patterns in past climate change and to isolate climate signals from noisy data.
In the study of past climates ("paleoclimatology"), climate proxies are preserved physical characteristics of the past that stand in for direct meteorological measurements and enable scientists to reconstruct the climatic conditions over a longer fraction of the Earth's history. Reliable global records of climate only began in the 1880s, and proxies provide the only means for scientists to determine climatic patterns before record-keeping began.
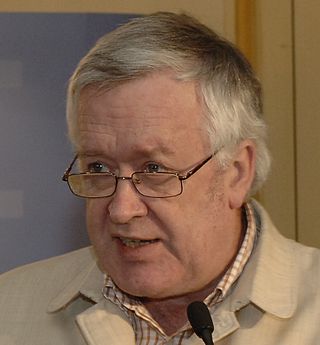
Hans von Storch is a German climate scientist. He is a professor at the Meteorological Institute of the University of Hamburg, and Director of the Institute for Coastal Research at the Helmholtz Research Centre in Geesthacht, Germany. He is a member of the advisory boards of the journals Journal of Climate and Annals of Geophysics. He worked at the Max Planck Institute for Meteorology from 1986 to 1995 and headed the Statistical Analysis and Modelling research group there.
The description of the Medieval Warm Period and Little Ice Age in IPCC reports has changed since the first report in 1990 as scientific understanding of the temperature record of the past 1000 years has improved. The Medieval Warm Period (MWP) and Little Ice Age (LIA) are the best-known temperature fluctuations in the last millennium.
The IPCC Third Assessment Report (TAR), Climate Change 2001, is an assessment of available scientific and socio-economic information on climate change by the IPCC. Statements of the IPCC or information from the TAR were often used as a reference showing a scientific consensus on the subject of global warming. The Third Assessment Report (TAR) was completed in 2001 and consists of four reports, three of them from its Working Groups: Working Group I: The Scientific Basis; Working Group II: Impacts, Adaptation and Vulnerability; Working Group III: Mitigation; Synthesis Report. A number of the TAR's conclusions are given quantitative estimates of how probable it is that they are correct, e.g., greater than 66% probability of being correct. These are "Bayesian" probabilities, which are based on an expert assessment of all the available evidence.
The global temperature record shows the fluctuations of the temperature of the atmosphere and the oceans through various spans of time. There are numerous estimates of temperatures since the end of the Pleistocene glaciation, particularly during the current Holocene epoch. Some temperature information is available through geologic evidence, going back millions of years. More recently, information from ice cores covers the period from 800,000 years before the present time until now. A study of the paleoclimate covers the time period from 12,000 years ago to the present. Tree rings and measurements from ice cores can give evidence about the global temperature from 1,000-2,000 years before the present until now. The most detailed information exists since 1850, when methodical thermometer-based records began. Modifications on the Stevenson-type screen were made for uniform instrument measurements around 1880.
Hockey stick graphs present the global or hemispherical mean temperature record of the past 500 to 2000 years as shown by quantitative climate reconstructions based on climate proxy records. These reconstructions have consistently shown a slow long term cooling trend changing into relatively rapid warming in the 20th century, with the instrumental temperature record by 2000 exceeding earlier temperatures.
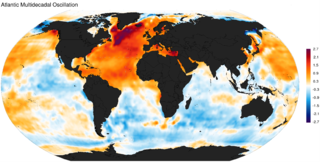
The Atlantic Multidecadal Oscillation (AMO), also known as Atlantic Multidecadal Variability (AMV), is the theorized variability of the sea surface temperature (SST) of the North Atlantic Ocean on the timescale of several decades.
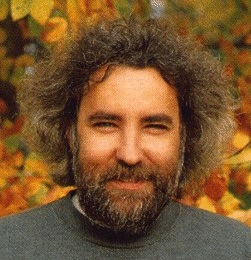
Malcolm K. Hughes is a meso-climatologist and Regents' Professor of Dendrochronology in the Laboratory for Tree-Ring Research at the University of Arizona.
The divergence problem is an anomaly from the field of dendroclimatology, the study of past climate through observations of old trees, primarily the properties of their annual growth rings. It is the disagreement between instrumental temperatures and the temperatures reconstructed from latewood densities or, in some cases, from the widths of tree rings in far northern forests.
The Soon and Baliunas controversy involved the publication in 2003 of a review study written by the aerospace engineer Willie Soon and astronomer Sallie Baliunas in the journal Climate Research. In the review, the authors expressed disagreement with the hockey stick graph and argued that historical temperature changes were related to solar variation rather than greenhouse gas emissions as was the position of the Intergovernmental Panel on Climate Change and other researchers. The publication was quickly taken up by the George W. Bush administration as a basis for amending the first Environmental Protection Agency's Report on the Environment.
Keith Raphael Briffa was a climatologist and deputy director of the Climatic Research Unit. He authored or co-authored over 130 scholarly articles, chapters and books. In his professional work, he focused on climate variability in the late Holocene, with a special focus on northern portions of Europe and Asia. Briffa's preferred method was dendroclimatology, which is a set of procedures intended to decode information about the past climate from tree rings. Briffa helped develop data sets from trees from Canada, Fennoscandia, and northern Siberia which have been used in climate research.
The Roman Warm Period, or Roman Climatic Optimum, was a period of unusually-warm weather in Europe and the North Atlantic that ran from approximately 250 BC to AD 400. Theophrastus wrote that date trees could grow in Greece if they were planted but that they could not set fruit there. That is still the case today, which implies that South Aegean mean summer temperatures in the 4th and the 5th centuries BC were within a degree of modern ones. That and other literary fragments from the time confirm that the Greek climate was basically the same then as around 2000. Tree rings from the Italian Peninsula in the late 3rd century BC indicate a time of mild conditions there around the time of Hannibal's crossing of the Alps with imported elephants in 218 BC.
The Wegman Report was prepared in 2006 by three statisticians led by Edward Wegman at the request of Rep. Joe Barton of the United States House Committee on Energy and Commerce to validate criticisms made by Stephen McIntyre and Ross McKitrick of reconstructions of the temperature record of the past 1000 years, in particular the reconstructions by Mann, Bradley and Hughes of what had been dubbed the hockey stick graph.
The North Report was a 2006 report evaluating reconstructions of the temperature record of the past two millennia, providing an overview of the state of the science and the implications for understanding of global warming. It was produced by a National Research Council committee, chaired by Gerald North, at the request of Representative Sherwood Boehlert as chairman of the U.S. House of Representatives Committee on Science.
Gabriele Clarissa Hegerl is a German climatologist. She is a professor of climate system science at the University of Edinburgh School of GeoSciences. Prior to 2007 she held research positions at Texas A&M University and at Duke University's Nicholas School of the Environment, during which time she was a co-ordinating lead author for the Intergovernmental Panel on Climate Change (IPCC) Fourth and Fifth Assessment Report.
Patterns of solar irradiance and solar variation have been a main driver of climate change over the millions to billions of years of the geologic time scale.
The Medieval Warm Period (MWP), also known as the Medieval Climate Optimum or the Medieval Climatic Anomaly, was a time of warm climate in the North Atlantic region that lasted from c. 950 to c. 1250. Climate proxy records show peak warmth occurred at different times for different regions, which indicate that the MWP was not a globally uniform event. Some refer to the MWP as the Medieval Climatic Anomaly to emphasize that climatic effects other than temperature were also important.
This page is based on this Wikipedia article Text is available under the CC BY-SA 4.0 license; additional terms may apply. Images, videos and audio are available under their respective licenses.