In classical mechanics, a harmonic oscillator is a system that, when displaced from its equilibrium position, experiences a restoring force F proportional to the displacement x:
Signal-to-noise ratio is a measure used in science and engineering that compares the level of a desired signal to the level of background noise. SNR is defined as the ratio of signal power to noise power, often expressed in decibels. A ratio higher than 1:1 indicates more signal than noise.

Pink noise, 1⁄f noise or fractional noise or fractal noise is a signal or process with a frequency spectrum such that the power spectral density is inversely proportional to the frequency of the signal. In pink noise, each octave interval carries an equal amount of noise energy.
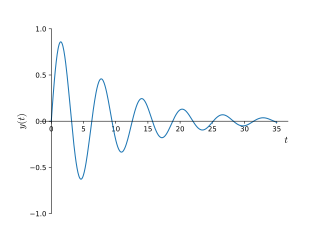
In physics and engineering, the quality factor or Q factor is a dimensionless parameter that describes how underdamped an oscillator or resonator is. It is defined as the ratio of the initial energy stored in the resonator to the energy lost in one radian of the cycle of oscillation. Q factor is alternatively defined as the ratio of a resonator's centre frequency to its bandwidth when subject to an oscillating driving force. These two definitions give numerically similar, but not identical, results. Higher Q indicates a lower rate of energy loss and the oscillations die out more slowly. A pendulum suspended from a high-quality bearing, oscillating in air, has a high Q, while a pendulum immersed in oil has a low one. Resonators with high quality factors have low damping, so that they ring or vibrate longer.
The relative strength index (RSI) is a technical indicator used in the analysis of financial markets. It is intended to chart the current and historical strength or weakness of a stock or market based on the closing prices of a recent trading period. The indicator should not be confused with relative strength.
In mathematical statistics, the Kullback–Leibler (KL) divergence, denoted , is a type of statistical distance: a measure of how one probability distribution P is different from a second, reference probability distribution Q. A simple interpretation of the KL divergence of P from Q is the expected excess surprise from using Q as a model when the actual distribution is P. While it is a measure of how different two distributions are, and in some sense is thus a "distance", it is not actually a metric, which is the most familiar and formal type of distance. In particular, it is not symmetric in the two distributions, and does not satisfy the triangle inequality. Instead, in terms of information geometry, it is a type of divergence, a generalization of squared distance, and for certain classes of distributions, it satisfies a generalized Pythagorean theorem.

MACD, short for moving average convergence/divergence, is a trading indicator used in technical analysis of securities prices, created by Gerald Appel in the late 1970s. It is designed to reveal changes in the strength, direction, momentum, and duration of a trend in a stock's price.
Williams %R, or just %R, is a technical analysis oscillator showing the current closing price in relation to the high and low of the past N days. It was developed by a publisher and promoter of trading materials, Larry Williams. Its purpose is to tell whether a stock or commodity market is trading near the high or the low, or somewhere in between, of its recent trading range.
The commodity channel index (CCI) is an oscillator originally introduced by Donald Lambert in 1980.
The accumulation/distribution line or accumulation/distribution index in the stock market, is a technical analysis indicator intended to relate price and volume, which supposedly acts as a leading indicator of price movements.

The detrended price oscillator (DPO) is an indicator in technical analysis that attempts to eliminate the long-term trends in prices by using a displaced moving average so it does not react to the most current price action. This allows the indicator to show intermediate overbought and oversold levels effectively.
Ewald summation, named after Paul Peter Ewald, is a method for computing long-range interactions in periodic systems. It was first developed as the method for calculating the electrostatic energies of ionic crystals, and is now commonly used for calculating long-range interactions in computational chemistry. Ewald summation is a special case of the Poisson summation formula, replacing the summation of interaction energies in real space with an equivalent summation in Fourier space. In this method, the long-range interaction is divided into two parts: a short-range contribution, and a long-range contribution which does not have a singularity. The short-range contribution is calculated in real space, whereas the long-range contribution is calculated using a Fourier transform. The advantage of this method is the rapid convergence of the energy compared with that of a direct summation. This means that the method has high accuracy and reasonable speed when computing long-range interactions, and it is thus the de facto standard method for calculating long-range interactions in periodic systems. The method requires charge neutrality of the molecular system to accurately calculate the total Coulombic interaction. A study of the truncation errors introduced in the energy and force calculations of disordered point-charge systems is provided by Kolafa and Perram.

A parametric oscillator is a driven harmonic oscillator in which the oscillations are driven by varying some parameters of the system at some frequencies, typically different from the natural frequency of the oscillator. A simple example of a parametric oscillator is a child pumping a playground swing by periodically standing and squatting to increase the size of the swing's oscillations. The child's motions vary the moment of inertia of the swing as a pendulum. The "pump" motions of the child must be at twice the frequency of the swing's oscillations. Examples of parameters that may be varied are the oscillator's resonance frequency and damping .

The ultimate oscillator is a theoretical concept in finance developed by Larry Williams as a way to account for the problems experienced in most oscillators when used over different lengths of time.

A pendulum is a body suspended from a fixed support so that it swings freely back and forth under the influence of gravity. When a pendulum is displaced sideways from its resting, equilibrium position, it is subject to a restoring force due to gravity that will accelerate it back towards the equilibrium position. When released, the restoring force acting on the pendulum's mass causes it to oscillate about the equilibrium position, swinging it back and forth. The mathematics of pendulums are in general quite complicated. Simplifying assumptions can be made, which in the case of a simple pendulum allow the equations of motion to be solved analytically for small-angle oscillations.
The range expansion index (REI) is a technical indicator used in the technical analysis of financial markets. It is intended to chart the relative strength or weakness of a trading vehicle based on the comparison of the recent price changes and the overall price changes for the period.
The true strength index (TSI) is a technical indicator used in the analysis of financial markets that attempts to show both trend direction and overbought/oversold conditions. It was first published William Blau in 1991. The indicator uses moving averages of the underlying momentum of a financial instrument. Momentum is considered a leading indicator of price movements, and a moving average characteristically lags behind price. The TSI combines these characteristics to create an indication of price and direction more in sync with market turns than either momentum or moving average. The TSI is provided as part of the standard collection of indicators offered by various trading platforms.
Pulse-Doppler signal processing is a radar and CEUS performance enhancement strategy that allows small high-speed objects to be detected in close proximity to large slow moving objects. Detection improvements on the order of 1,000,000:1 are common. Small fast moving objects can be identified close to terrain, near the sea surface, and inside storms.

Chaikin Analytics is a platform for stock trading ideas. It was founded in 2011 by Marc Chaikin. The centerpiece of Chaikin Analytics is the Chaikin Power Gauge stock rating. In 2016, it was named one of "Two Top Websites for Quantitative Analysis" by Barron's (newspaper).

t-distributed stochastic neighbor embedding (t-SNE) is a statistical method for visualizing high-dimensional data by giving each datapoint a location in a two or three-dimensional map. It is based on Stochastic Neighbor Embedding originally developed by Geoffrey Hinton and Sam Roweis, where Laurens van der Maaten proposed the t-distributed variant. It is a nonlinear dimensionality reduction technique for embedding high-dimensional data for visualization in a low-dimensional space of two or three dimensions. Specifically, it models each high-dimensional object by a two- or three-dimensional point in such a way that similar objects are modeled by nearby points and dissimilar objects are modeled by distant points with high probability.


