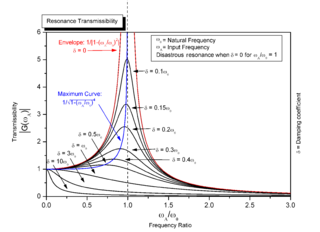
Resonance is the phenomenon, pertaining to oscillatory dynamical systems, wherein amplitude rises are caused by an external force with time-varying amplitude with the same frequency of variation as the natural frequency of the system. The amplitude rises that occur are a result of the fact that applied external forces at the natural frequency entail a net increase in mechanical energy of the system.

In thermodynamics and solid-state physics, the Debye model is a method developed by Peter Debye in 1912 to estimate phonon contribution to the specific heat in a solid. It treats the vibrations of the atomic lattice (heat) as phonons in a box in contrast to the Einstein photoelectron model, which treats the solid as many individual, non-interacting quantum harmonic oscillators. The Debye model correctly predicts the low-temperature dependence of the heat capacity of solids, which is proportional to – the Debye T 3 law. Similarly to the Einstein photoelectron model, it recovers the Dulong–Petit law at high temperatures. Due to simplifying assumptions, its accuracy suffers at intermediate temperatures.
The relative strength index (RSI) is a technical indicator used in the analysis of financial markets. It is intended to chart the current and historical strength or weakness of a stock or market based on the closing prices of a recent trading period. The indicator should not be confused with relative strength.

MACD, short for moving average convergence/divergence, is a trading indicator used in technical analysis of securities prices, created by Gerald Appel in the late 1970s. It is designed to reveal changes in the strength, direction, momentum, and duration of a trend in a stock's price.
The money flow index (MFI) is an oscillator that ranges from 0 to 100. It is used to show the money flow over several days.
In financial technical analysis, momentum (MTM) and rate of change (ROC) are simple indicators showing the difference between today's closing price and the close N days ago. Momentum is the absolute difference in stock, commodity:
The commodity channel index (CCI) is an oscillator originally introduced by Donald Lambert in 1980.
The accumulation/distribution line or accumulation/distribution index in the stock market, is a technical analysis indicator intended to relate price and volume, which supposedly acts as a leading indicator of price movements. It provides a measure of the commitment of bulls and bears to the market and is used to detect divergences between volume and price action - signs that a trend is weakening.

Keltner channel is a technical analysis indicator showing a central moving average line plus channel lines at a distance above and below. The indicator is named after Chester W. Keltner (1909–1998) who described it in his 1960 book How To Make Money in Commodities. This name was applied by those who heard about it from him, but Keltner called it the ten-day moving average trading rule and indeed made no claim to any originality for the idea.

The detrended price oscillator (DPO) is an indicator in technical analysis that attempts to eliminate the long-term trends in prices by using a displaced moving average so it does not react to the most current price action. This allows the indicator to show intermediate overbought and oversold levels effectively.
The mass index is an indicator, developed by Donald Dorsey, used in technical analysis to predict trend reversals. It is based on the notion that there is a tendency for reversal when the price range widens, and therefore compares previous trading ranges.

The ultimate oscillator is a theoretical concept in finance developed by Larry Williams as a way to account for the problems experienced in most oscillators when used over different lengths of time.
In technical analysis of securities trading, the stochastic oscillator is a momentum indicator that uses support and resistance levels. George Lane developed this indicator in the late 1950s. The term stochastic refers to the point of a current price in relation to its price range over a period of time. This method attempts to predict price turning points by comparing the closing price of a security to its price range.
The McClellan oscillator is a market breadth indicator used in technical analysis by financial analysts of the New York Stock Exchange to evaluate the balance between the advancing and declining stocks. The McClellan oscillator is based on the Advance-Decline Data and it could be applied to stock market exchanges, indexes, portfolio of stocks or any basket of stocks.
The advance–decline line is a stock market technical indicator used by investors to measure the number of individual stocks participating in a market rise or fall. As price changes of large stocks can have a disproportionate effect on capitalization weighted stock market indices such as the S&P 500, the NYSE Composite Index, and the NASDAQ Composite index, it can be useful to know how broadly this movement extends into the larger universe of smaller stocks. Since market indexes represent a group of stocks, they do not present the whole picture of the trading day and the performance of the market during this day. Though the market indices give an idea about what has happened during the trading day, advance/decline numbers give an idea about the individual performance of particular stocks.
In financial technical analysis, the know sure thing (KST) oscillator is a complex, smoothed price velocity indicator developed by Martin J. Pring.
Laser linewidth is the spectral linewidth of a laser beam.
The range expansion index (REI) is a technical indicator used in the technical analysis of financial markets. It is intended to chart the relative strength or weakness of a trading vehicle based on the comparison of the recent price changes and the overall price changes for the period.
The true strength index (TSI) is a technical indicator used in the analysis of financial markets that attempts to show both trend direction and overbought/oversold conditions. It was first published William Blau in 1991. The indicator uses moving averages of the underlying momentum of a financial instrument. Momentum is considered a leading indicator of price movements, and a moving average characteristically lags behind price. The TSI combines these characteristics to create an indication of price and direction more in sync with market turns than either momentum or moving average. The TSI is provided as part of the standard collection of indicators offered by various trading platforms.

Chaikin Analytics is a platform for stock trading ideas. It was founded in 2011 by Marc Chaikin. The centerpiece of Chaikin Analytics is the Chaikin Power Gauge stock rating. In 2016, it was named one of "Two Top Websites for Quantitative Analysis" by Barron's (newspaper).


