The Black–Scholes or Black–Scholes–Merton model is a mathematical model for the dynamics of a financial market containing derivative investment instruments. From the parabolic partial differential equation in the model, known as the Black–Scholes equation, one can deduce the Black–Scholes formula, which gives a theoretical estimate of the price of European-style options and shows that the option has a unique price given the risk of the security and its expected return. The equation and model are named after economists Fischer Black and Myron Scholes. Robert C. Merton, who first wrote an academic paper on the subject, is sometimes also credited.
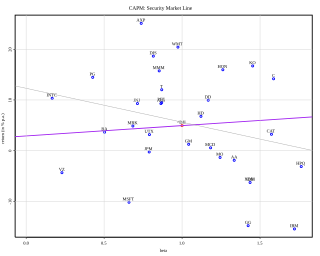
In finance, the capital asset pricing model (CAPM) is a model used to determine a theoretically appropriate required rate of return of an asset, to make decisions about adding assets to a well-diversified portfolio.
In finance, moneyness is the relative position of the current price of an underlying asset with respect to the strike price of a derivative, most commonly a call option or a put option. Moneyness is firstly a three-fold classification:
Modern portfolio theory (MPT), or mean-variance analysis, is a mathematical framework for assembling a portfolio of assets such that the expected return is maximized for a given level of risk. It is a formalization and extension of diversification in investing, the idea that owning different kinds of financial assets is less risky than owning only one type. Its key insight is that an asset's risk and return should not be assessed by itself, but by how it contributes to a portfolio's overall risk and return. The variance of return is used as a measure of risk, because it is tractable when assets are combined into portfolios. Often, the historical variance and covariance of returns is used as a proxy for the forward-looking versions of these quantities, but other, more sophisticated methods are available.
In finance, the duration of a financial asset that consists of fixed cash flows, such as a bond, is the weighted average of the times until those fixed cash flows are received. When the price of an asset is considered as a function of yield, duration also measures the price sensitivity to yield, the rate of change of price with respect to yield, or the percentage change in price for a parallel shift in yields.
In finance, the beta is a statistic that measures the expected increase or decrease of an individual stock price in proportion to movements of the stock market as a whole. Beta can be used to indicate the contribution of an individual asset to the market risk of a portfolio when it is added in small quantity. It refers to an asset's non-diversifiable risk, systematic risk, or market risk. Beta is not a measure of idiosyncratic risk.
In finance, the Sharpe ratio measures the performance of an investment such as a security or portfolio compared to a risk-free asset, after adjusting for its risk. It is defined as the difference between the returns of the investment and the risk-free return, divided by the standard deviation of the investment returns. It represents the additional amount of return that an investor receives per unit of increase in risk.
The Sortino ratio measures the risk-adjusted return of an investment asset, portfolio, or strategy. It is a modification of the Sharpe ratio but penalizes only those returns falling below a user-specified target or required rate of return, while the Sharpe ratio penalizes both upside and downside volatility equally. Though both ratios measure an investment's risk-adjusted return, they do so in significantly different ways that will frequently lead to differing conclusions as to the true nature of the investment's return-generating efficiency.
The Treynor reward to volatility model, named after Jack L. Treynor, is a measurement of the returns earned in excess of that which could have been earned on an investment that has no diversifiable risk, per unit of market risk assumed.
Alpha is a measure of the active return on an investment, the performance of that investment compared with a suitable market index. An alpha of 1% means the investment's return on investment over a selected period of time was 1% better than the market during that same period; a negative alpha means the investment underperformed the market. Alpha, along with beta, is one of two key coefficients in the capital asset pricing model used in modern portfolio theory and is closely related to other important quantities such as standard deviation, R-squared and the Sharpe ratio.
The drawdown is the measure of the decline from a historical peak in some variable.
The information ratio measures and compares the active return of an investment compared to a benchmark index relative to the volatility of the active return. It is defined as the active return divided by the tracking error. It represents the additional amount of return that an investor receives per unit of increase in risk. The information ratio is simply the ratio of the active return of the portfolio divided by the tracking error of its return, with both components measured relative to the performance of the agreed-on benchmark.
The following outline is provided as an overview of and topical guide to finance:
The single-index model (SIM) is a simple asset pricing model to measure both the risk and the return of a stock. The model has been developed by William Sharpe in 1963 and is commonly used in the finance industry. Mathematically the SIM is expressed as:
Simply stated, post-modern portfolio theory (PMPT) is an extension of the traditional modern portfolio theory (MPT) of Markowitz and Sharpe. Both theories provide analytical methods for rational investors to use diversification to optimize their investment portfolios. The essential difference between PMPT and MPT is that PMPT emphasizes the return that must be earned on an investment in order to meet future, specified obligations, MPT is concerned only with the absolute return vis-a-vis the risk-free rate.
In financial mathematics, a risk measure is used to determine the amount of an asset or set of assets to be kept in reserve. The purpose of this reserve is to make the risks taken by financial institutions, such as banks and insurance companies, acceptable to the regulator. In recent years attention has turned towards convex and coherent risk measurement.
The bias ratio is an indicator used in finance to analyze the returns of investment portfolios, and in performing due diligence.
The Sterling ratio (SR) is a measure of the risk-adjusted return of an investment portfolio.
Modigliani risk-adjusted performance (also known as M2, M2, Modigliani–Modigliani measure or RAP) is a measure of the risk-adjusted returns of some investment portfolio. It measures the returns of the portfolio, adjusted for the risk of the portfolio relative to that of some benchmark (e.g., the market). We can interpret the measure as the difference between the scaled excess return of our portfolio P and that of the market, where the scaled portfolio has the same volatility as the market. It is derived from the widely used Sharpe ratio, but it has the significant advantage of being in units of percent return (as opposed to the Sharpe ratio – an abstract, dimensionless ratio of limited utility to most investors), which makes it dramatically more intuitive to interpret.
The V2 ratio (V2R) is a measure of excess return per unit of exposure to loss of an investment asset, portfolio or strategy, compared to a given benchmark.


