A stock market crash is a sudden dramatic decline of stock prices across a major cross-section of a stock market, resulting in a significant loss of paper wealth. Crashes are driven by panic selling and underlying economic factors. They often follow speculation and economic bubbles.
A market trend is a perceived tendency of the financial markets to move in a particular direction over time. Analysts classify these trends as secular for long time-frames, primary for medium time-frames, and secondary for short time-frames. Traders attempt to identify market trends using technical analysis, a framework which characterizes market trends as predictable price tendencies within the market when price reaches support and resistance levels, varying over time.
In finance, technical analysis is an analysis methodology for analysing and forecasting the direction of prices through the study of past market data, primarily price and volume. As a type of active management, it stands in contradiction to much of modern portfolio theory. The efficacy of technical analysis is disputed by the efficient-market hypothesis, which states that stock market prices are essentially unpredictable, and research on whether technical analysis offers any benefit has produced mixed results. It is distinguished from fundamental analysis, which considers a company's financial statements, health, and the overall state of the market and economy.
The relative strength index (RSI) is a technical indicator used in the analysis of financial markets. It is intended to chart the current and historical strength or weakness of a stock or market based on the closing prices of a recent trading period. The indicator should not be confused with relative strength.

In finance, a dead cat bounce is a small, brief recovery in the price of a declining stock. Derived from the idea that "even a dead cat will bounce if it falls from a great height", the phrase is also popularly applied to any case where a subject experiences a brief resurgence during or following a severe decline. This may also be known as a "sucker rally".

A candlestick chart is a style of financial chart used to describe price movements of a security, derivative, or currency.
This article is a summary of the closing milestones of the Dow Jones Industrial Average, a United States stock market index. Since first closing at 62.76 on February 16, 1885, the Dow Jones Industrial Average has increased, despite several periods of decline.
A chart pattern or price pattern is a pattern within a chart when prices are graphed. In stock and commodity markets trading, chart pattern studies play a large role during technical analysis. When data is plotted there is usually a pattern which naturally occurs and repeats over a period. Chart patterns are used as either reversal or continuation signals.
The October 27, 1997, mini-crash is a global stock market crash that was caused by an economic crisis in Asia, the "Asian contagion", or Tom Yum Goong crisis. The point loss that the Dow Jones Industrial Average suffered on this day currently ranks as the 18th biggest percentage loss since the Dow's creation in 1896. This crash is considered a "mini-crash" because the percentage loss was relatively small compared to some other notable crashes. After the crash, the markets still remained positive for 1997, but the "mini-crash" may be considered as the beginning of the end of the 1990s economic boom in the United States and Canada, as both consumer confidence and economic growth were mildly reduced during the winter of 1997–1998, and when both returned to pre-October levels, they began to grow at an even slower pace than before the crash.
The commodity channel index (CCI) is an oscillator originally introduced by Donald Lambert in 1980.

In financial markets, a pivot point is a price level that is used by traders as a possible indicator of market movement. A pivot point is calculated as an average of significant prices from the performance of a market in the prior trading period. If the market in the following period trades above the pivot point it is usually evaluated as a bullish sentiment, whereas trading below the pivot point is seen as bearish.
On the technical analysis chart, the head and shoulders formation occurs when a market trend is in the process of reversal either from a bullish or bearish trend; a characteristic pattern takes shape and is recognized as reversal formation.
On the technical analysis chart, a wedge pattern is a market trend commonly found in traded assets. The pattern is characterized by a contracting range in prices coupled with an upward trend in prices or a downward trend in prices.
The flag and pennant patterns are commonly found patterns in the price charts of financially traded assets. The patterns are characterized by a clear direction of the price trend, followed by a consolidation and rangebound movement, which is then followed by a resumption of the trend. They are continuation patterns and form when the asset prices rally or fall sharply.
The doji is a commonly found pattern in a candlestick chart of financially traded assets in technical analysis. It is characterized by being small in length—meaning a small trading range—with an opening and closing price that are virtually equal. The efficacy of technical analysis is disputed by the efficient-market hypothesis, which states that stock market prices are essentially unpredictable.

The Morning Star is a pattern seen in a candlestick chart, a popular type of a chart used by technical analysts to anticipate or predict price action of a security, derivative, or currency over a short period of time.
Broadening top is technical analysis chart pattern describing trends of stocks, commodities, currencies, and other assets. Broadening Top formation appears much more frequently at tops than at bottoms. Its formation usually has bearish implications.
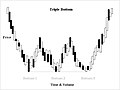
Double top and double bottom are reversal chart patterns observed in the technical analysis of financial trading markets of stocks, commodities, currencies, and other assets.

In both stock trading and financial technical analysis, an island reversal is a candlestick pattern with compact trading activity within a range of prices, separated from the move preceding it. A "candlestick pattern" is a movement in prices shown graphically on a candlestick chart. This separation shown on the chart, is said to be caused by an exhaustion gap and the subsequent move in the opposite direction occurs as a result of a breakaway gap.
Price action is a method of analysis of the basic price movements to generate trade entry and exit signals that is considered reliable while not requiring the use of indicators. It is a form of technical analysis, as it ignores the fundamental factors of a security and looks primarily at the security's price history. However, this method is different from other forms of technical analysis, as it focuses on the relation of the security's current price to its price history, which consists of all price movements, as opposed to values derived from the price history.