Wafer bond characterization

Last updated

The wafer bond characterization is based on different methods and tests. Considered a high importance of the wafer are the successful bonded wafers without flaws. Those flaws can be caused by void formation in the interface due to unevenness or impurities. The bond connection is characterized for wafer bond development or quality assessment of fabricated wafers and sensors.

Contents

Overview

Wafer bonds are commonly characterized by three important encapsulation parameters: bond strength, hermeticity of encapsulation and bonding induced stress. [1]

The bond strength can be evaluated using double cantilever beam or chevron respectively micro-chevron tests. Other pull tests as well as burst, direct shear tests or bend tests enable the determination of the bond strength. [2] The packaging hermeticity is characterized using membrane, He-leak, resonator/pressure tests. [1]

Three additional possibilities to evaluate the bond connection are optical, electron and Acoustical measurements and instrumentation. At first, optical measurement techniques are using an optical microscope, IR transmission microscopy and visual inspection. Secondly, the electron measurement is commonly applied using an electron microscope, e.g. scanning electron microscopy (SEM), high voltage transmittance electron microscopy (HVTEM) and high resolution scanning electron microscopy (HRSEM). And finally, typical acoustic measurement approaches are scanning acoustic microscope (SAM), scanning laser acoustic microscope (SLAM) and C-mode scanning acoustic microscope (C-SAM).

The specimen preparation is sophisticated and the mechanical, electronic properties are important for the bonding technology characterization and comparison. [3]

Infrared (IR) transmission microscopy

Infrared (IR) void imaging is possible if the analyzed materials are IR transparent, i.e. silicon. This method gives a rapid qualitative examination [4] and is very suitable due to its sensitivity to the surface and to the buried interface. It obtains information on chemical nature of surface and interface.

Schematic infrared transmission microscopy setup. A-ir.png
Schematic infrared transmission microscopy setup.

Infrared transmitted light is based on the fact that silicon is translucent at wavelength ≥ 1.2 μm. The equipment consists of an infrared lamp as light source and an infrared video system (compare to figure "Schematic infrared transmission microscopy setup").

The IR imaging system enables the analysis of the bond wave and additionally micro mechanical structures as well as deformities in the silicon. This procedure allows also to analyze multiple layer bonds. [3] The image contrast depends on the distance between the wafers. Usually if using monochromatic color IR the center of the wafers is display brighter based on the vicinity. Particles in the bond interface generate highly visible spots with differing contrast because of the interference (wave propagation) fringes. [5] Unbonded areas can be shown if the void opening (height) is ≥ 1 nm. [4]

Fourier transform infrared (FT-IR) spectroscopy

The Fourier transform infrared (FT-IR) spectroscopy is a non-destructive hermeticity characterization method. The radiation absorption enables the analysis with a specific wavelength for gases. [6]

Ultrasonic microscopy

Ultrasonic microscopy uses high frequency sound waves to image bonded interfaces. Deionized water is used as the acoustic interconnect medium between the electromagnetic acoustic transducer and the wafer. [4] [7]

This method works with an ultrasonic transducer scanning the wafer bond. The reflected sound signal is used for the image creation. The lateral resolutions depends on the ultrasonic frequency, the acoustic beam diameter and the signal-to-noise ratio (contrast).

Unbonded areas, i.e. impurities or voids, do not reflect the ultrasonic beam like bonded areas, therefore a quality assessment of the bond is possible. [3]

Double cantilever beam (DCB) test

Double cantilever beam test, also referred to as crack opening or razor blade method, is a method to define the strength of the bond. This is achieved by determining the energy of the bonded surfaces. A blade of a specific thickness is inserted between the bonded wafer pair. This leads to a split-up of the bond connection. [3] The crack length equals the distance between the blade tip and the crack tip and is determined using IR transmitted light. The IR light is able to illuminate the crack, when using materials transparent to IR or visible light. [8] If the fracture surface toughness is very high, it is very difficult to insert the blade and the wafers are endangered to break at the slide in of the blade. [3]

Blade insertion between the bonded wafers. A-dcb1.png
Blade insertion between the bonded wafers.

The DCB test characterizes the time dependent strength by mechanical fracture evaluation and is therefore well suited for lifetime predictions. [9] A disadvantage of this method is, that between the entering of the blade and the time to take the IR image, the results can be influenced. In addition, the measurement inaccuracy increases with a high surface fracture toughness resulting in a smaller crack length or broken wafers at the blade insertion as well as the influence of the fourth power of the measured crack length. The measured crack length determines surface energy in relation to a rectangular, beam-shaped specimen.

Thereby is the Young's modulus, the wafer thickness, the blade thickness and the measured crack length. [10] In literature different DCB models are mentioned, i.e. measurement approaches by Maszara, Gillis and Gilman, Srawley and Gross, Kanninen or Williams. The most commonly used approaches are by Maszara or Gillis and Gilman. [8]

Maszara model

The Maszara model neglects shear stress as well as stress in the un-cleaved part for the obtained crack lengths. The compliance of a symmetric DCB specimen is described as follows:

The compliance is determined out of the crack length , the width and the beam thickness . defines the Young's modulus. The surface fracture energy is:

with as load-point displacement.

Gillis and Gilman model

The Gillis and Gilman approach considers bend and shear forces in the beam. The compliance equation is:

The first term describes the strain energy in the cantilever due to bending. The second term is the contribution from elastic deformations in the un-cleaved specimen part and the third term considers the shear deformation. Therefore, and are dependent on the conditions of the fixed end of the cantilever. The shear coefficient is dependent on the cross-section geometry of the beam.

Chevron test

The chevron test is used to determine the fracture toughness of brittle construction materials. The fracture toughness is a basic material parameter for analyzing the bond strength.

The chevron test uses a special notch geometry for the specimen that is loaded with an increasing tensile force. The chevron notch geometry is commonly in shape of a triangle with different bond patterns. At a specific tensile load the crack starts at the chevron tip and grows with continuous applied load until a critical length is reached. [11] The crack growth becomes unstable and accelerates resulting in a fracture of the specimen. [8] The critical length depends only on the specimen geometry and the loading condition. The fracture toughness commonly is determined by measuring the recorded fracture load of the test. This improves the test quality and accuracy and decreases measurement scatter. [11]

Two approaches, based on energy release rate or stress intensity factor , can be used for explaining the chevron test method. [8] The fracture occurs when or reach a critical value, describing the fracture toughness or . The advantage using chevron notch specimen is due to the formation of a specified crack of well-defined length. [12] The disadvantage of the approach is that the gluing required for loading is time consuming and may induce data scatter due to misalignment. [8]

Chevron test
A-chevron2.png
Scheme of a chevron test setup. [8]
A-chevron1.png
Scheme of a chevron notched specimen. [8]
A-chevron3.png
Schematic chevron notched specimen with cracked area according to Bagdahn. [12]

Micro chevron (MC) test

The micro chevron (MC) test is a modification of the chevron test using a specimen of defined and reproducible size and shape. The test allows the determination of the critical energy release rate and the critical fracture toughness . [13] It is commonly used to characterize the wafer bond strength as well as the reliability. The reliability characterization is determined based on the fracture mechanical evaluation of critical failure. [9] The evaluation is determined by analyzing the fracture toughness as well as the resistance against crack propagation. [10]

The fracture toughness allows comparison of the strength properties independent on the particular specimen geometry. [12] In addition, bond strength of the bonded interface can be determined. [11] The chevron specimen is designed out of bonded stripes in shape of a triangle. The space of the tip of the chevron structure triangle is used as lever arm for the applied force. This reduces the force required to initiate the crack. The dimensions of the micro chevron structures are in the range of several millimeters and usually an angle of 70 ° chevron notch. [13] This chevron pattern is fabricated using wet or reactive ion etching. [12]

The MC test is applied with special specimen stamp glued onto the non-bonded edge of the processed structures. The specimen is loaded in a tensile tester and the load is applied perpendicular to the bonded area. When the load equals the maximum bearable conditions, a crack is initiated at the tip of the chevron notch.´ [13]

By increasing the mechanical stress by means of a higher loading, two opposing effects can be observed. First, the resistance against the crack expansion increases based on the increasing bonding of the triangular shaped first half of the chevron pattern. Second, the lever arm is getting longer with increased crack length . From the critical crack length an instable crack expansion and the destruction of the specimen is initiated. [13] The critical crack length corresponds to the maximum force in a force-length-diagram and a minimum of the geometric function . [14]

The fracture toughness can be calculated with maximum force, width and thickness :

The maximum force is determined during the test and the minimal stress intensity coefficient is determined by FE Simulation. [15] In addition, the energy release rate can be determined with as modulus of elasticity and as Poisson's ratio in the following way.´ [13]

The advantage of this test is the high accuracy compared to other tensile or bend tests. It is an effective, reliable and precise approach for the development of wafer bonds as well as for the quality control of the micro mechanical device production. [12]

Bond testing

Bond strength measurement or bond testing is performed in two basic methods: pull testing and shear testing. Both can be done destructively, which is more common (also on wafer level), or non destructively. They are used to determine the integrity of materials and manufacturing procedures, and to evaluate the overall performance of the bonding frame, as well as to compare various bonding technologies with each other. The success or failure of the bond is based on measuring the applied force, the failure type due to the applied force and the visual appearance of the residual medium used.

A development in bond strength testing of adhesively bonded composite structures is laser bond inspection (LBI). LBI provides a relative strength quotient derived from the fluence level of the laser energy delivered onto the material for the strength test compared to the strength of bonds previously mechanically tested at the same laser fluence. LBI provides nondestructive testing of bonds that were adequately prepared and meet engineering intent. [16]

Pull testing

USB Tweezers performing cold bump pull (CPB) on a bond tester USB Tweezers CBP.jpg
USB Tweezers performing cold bump pull (CPB) on a bond tester

Measuring bond strength by pull testing is often the best way to get the failure mode in which you are interested. Additionally, and unlike a shear test, as the bond separates, the fracture surfaces are pulled away from each other, cleanly enabling accurate failure mode analysis. To pull a bond requires the substrate and interconnect to be gripped; because of size, shape and material properties, this can be difficult, particularly for the interconnection. In these cases, a set of accurately formed and aligned tweezer tips with precision control of their opening and closing is likely to make the difference between success and failure. [17]

The most common type of pull tests is a Wire Pull test. Wire Pull testing applies an upward force under the wire, effectively pulling it away from the substrate or die.

Shear testing

Shear testing is the alternative method to determine the strength a bond can withstand. Various variants of shear testing exist. Like with pull testing, the objective is to recreate the failure mode of interest in the test. If that is not possible, the operator should focus on putting the highest possible load on the bond. [18]

White Light Interferometers

White light interferometry is commonly used for detecting deformations of the wafer surface based on optical measurements. Low-coherence light from a white light source passes through the optical top wafer, e.g. glass wafer, to the bond interface. Usually there are three different white light interferometers:

For the white light interferometer the position of zero order interference fringe and the spacing of the interference fringes needs to be independent of wavelength. [19] White light interferometry is utilized to detect deformations of the wafer. Low coherence light from a white light source passes through the top wafer to the sensor. The white light is generated by a halogen lamp and modulated. The spectrum of the reflected light of the sensor cavity is detected by a spectrometer. The captured spectrum is used to obtain the cavity length of the sensor. The cavity length d corresponds to the applied pressure and is determined by the spectrum of the reflection of the light of the sensor. This pressure value is subsequently displayed on a screen. The cavity length is determined using

with as refractive index of the sensor cavity material, and as adjacent peaks in the reflection spectrum.

The advantage of using white light interferometry as characterization method is the influence reduction of the bending loss. [20]

Related Research Articles

<span class="mw-page-title-main">Fracture</span> Split of materials or structures under stress

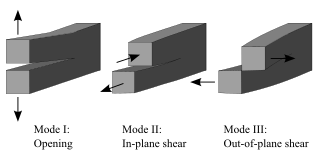
Fracture is the appearance of a crack or complete separation of an object or material into two or more pieces under the action of stress. The fracture of a solid usually occurs due to the development of certain displacement discontinuity surfaces within the solid. If a displacement develops perpendicular to the surface, it is called a normal tensile crack or simply a crack; if a displacement develops tangentially, it is called a shear crack, slip band, or dislocation.

<span class="mw-page-title-main">Compressive strength</span> Capacity of a material or structure to withstand loads tending to reduce size

In mechanics, compressive strength is the capacity of a material or structure to withstand loads tending to reduce size. In other words, compressive strength resists compression, whereas tensile strength resists tension. In the study of strength of materials, tensile strength, compressive strength, and shear strength can be analyzed independently.

<span class="mw-page-title-main">Fracture mechanics</span> Study of propagation of cracks in materials

Fracture mechanics is the field of mechanics concerned with the study of the propagation of cracks in materials. It uses methods of analytical solid mechanics to calculate the driving force on a crack and those of experimental solid mechanics to characterize the material's resistance to fracture.

Thermal shock is a phenomenon characterized by a rapid change in temperature that results in a transient mechanical load on an object. The load is caused by the differential expansion of different parts of the object due to the temperature change. This differential expansion can be understood in terms of strain, rather than stress. When the strain exceeds the tensile strength of the material, it can cause cracks to form and eventually lead to structural failure.

<span class="mw-page-title-main">Delamination</span> Mode of failure for which a material fractures into layers

Delamination is a mode of failure where a material fractures into layers. A variety of materials, including laminate composites and concrete, can fail by delamination. Processing can create layers in materials, such as steel formed by rolling and plastics and metals from 3D printing which can fail from layer separation. Also, surface coatings, such as paints and films, can delaminate from the coated substrate.

<span class="mw-page-title-main">Stress intensity factor</span> Quantity in fracture mechanics; predicts stress intensity near a cracks tip

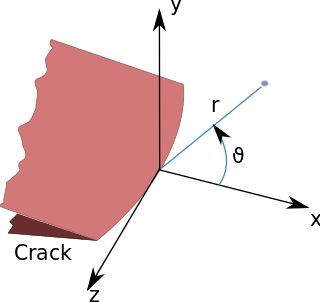
In fracture mechanics, the stress intensity factor is used to predict the stress state near the tip of a crack or notch caused by a remote load or residual stresses. It is a theoretical construct usually applied to a homogeneous, linear elastic material and is useful for providing a failure criterion for brittle materials, and is a critical technique in the discipline of damage tolerance. The concept can also be applied to materials that exhibit small-scale yielding at a crack tip.

<span class="mw-page-title-main">Fracture toughness</span> Stress intensity factor at which a cracks propagation increases drastically

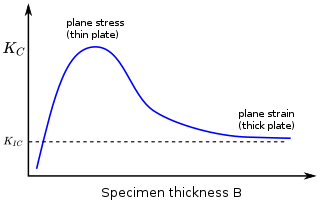
In materials science, fracture toughness is the critical stress intensity factor of a sharp crack where propagation of the crack suddenly becomes rapid and unlimited. A component's thickness affects the constraint conditions at the tip of a crack with thin components having plane stress conditions and thick components having plane strain conditions. Plane strain conditions give the lowest fracture toughness value which is a material property. The critical value of stress intensity factor in mode I loading measured under plane strain conditions is known as the plane strain fracture toughness, denoted . When a test fails to meet the thickness and other test requirements that are in place to ensure plane strain conditions, the fracture toughness value produced is given the designation . Fracture toughness is a quantitative way of expressing a material's resistance to crack propagation and standard values for a given material are generally available.

<span class="mw-page-title-main">Three-point flexural test</span> Standard procedure for measuring modulus of elasticity in bending

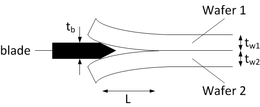
The three-point bending flexural test provides values for the modulus of elasticity in bending , flexural stress , flexural strain and the flexural stress–strain response of the material. This test is performed on a universal testing machine with a three-point or four-point bend fixture. The main advantage of a three-point flexural test is the ease of the specimen preparation and testing. However, this method has also some disadvantages: the results of the testing method are sensitive to specimen and loading geometry and strain rate.

The J-integral represents a way to calculate the strain energy release rate, or work (energy) per unit fracture surface area, in a material. The theoretical concept of J-integral was developed in 1967 by G. P. Cherepanov and independently in 1968 by James R. Rice, who showed that an energetic contour path integral was independent of the path around a crack.

<span class="mw-page-title-main">Ceramography</span> Preparation and study of ceramics with optical instruments

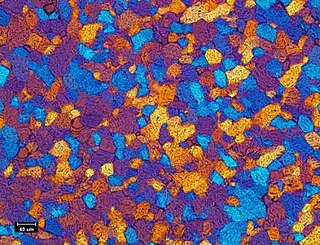
Ceramography is the art and science of preparation, examination and evaluation of ceramic microstructures. Ceramography can be thought of as the metallography of ceramics. The microstructure is the structure level of approximately 0.1 to 100 μm, between the minimum wavelength of visible light and the resolution limit of the naked eye. The microstructure includes most grains, secondary phases, grain boundaries, pores, micro-cracks and hardness microindentations. Most bulk mechanical, optical, thermal, electrical and magnetic properties are significantly affected by the microstructure. The fabrication method and process conditions are generally indicated by the microstructure. The root cause of many ceramic failures is evident in the microstructure. Ceramography is part of the broader field of materialography, which includes all the microscopic techniques of material analysis, such as metallography, petrography and plastography. Ceramography is usually reserved for high-performance ceramics for industrial applications, such as 85–99.9% alumina (Al2O3) in Fig. 1, zirconia (ZrO2), silicon carbide (SiC), silicon nitride (Si3N4), and ceramic-matrix composites. It is seldom used on whiteware ceramics such as sanitaryware, wall tiles and dishware.

Rubber toughening is a process in which rubber nanoparticles are interspersed within a polymer matrix to increase the mechanical robustness, or toughness, of the material. By "toughening" a polymer it is meant that the ability of the polymeric substance to absorb energy and plastically deform without fracture is increased. Considering the significant advantages in mechanical properties that rubber toughening offers, most major thermoplastics are available in rubber-toughened versions; for many engineering applications, material toughness is a deciding factor in final material selection.

Material failure theory is an interdisciplinary field of materials science and solid mechanics which attempts to predict the conditions under which solid materials fail under the action of external loads. The failure of a material is usually classified into brittle failure (fracture) or ductile failure (yield). Depending on the conditions most materials can fail in a brittle or ductile manner or both. However, for most practical situations, a material may be classified as either brittle or ductile.

In fracture mechanics, the energy release rate, , is the rate at which energy is transformed as a material undergoes fracture. Mathematically, the energy release rate is expressed as the decrease in total potential energy per increase in fracture surface area, and is thus expressed in terms of energy per unit area. Various energy balances can be constructed relating the energy released during fracture to the energy of the resulting new surface, as well as other dissipative processes such as plasticity and heat generation. The energy release rate is central to the field of fracture mechanics when solving problems and estimating material properties related to fracture and fatigue.

<span class="mw-page-title-main">Compact tension specimen</span>

A compact tension specimen (CT) is a type of standard notched specimen in accordance with ASTM and ISO standards. Compact tension specimens are used extensively in the area of fracture mechanics and corrosion testing, in order to establish fracture toughness and fatigue crack growth data for a material.

Polymer fracture is the study of the fracture surface of an already failed material to determine the method of crack formation and extension in polymers both fiber reinforced and otherwise. Failure in polymer components can occur at relatively low stress levels, far below the tensile strength because of four major reasons: long term stress or creep rupture, cyclic stresses or fatigue, the presence of structural flaws and stress-cracking agents. Formations of submicroscopic cracks in polymers under load have been studied by x ray scattering techniques and the main regularities of crack formation under different loading conditions have been analyzed. The low strength of polymers compared to theoretically predicted values are mainly due to the many microscopic imperfections found in the material. These defects namely dislocations, crystalline boundaries, amorphous interlayers and block structure can all lead to the non-uniform distribution of mechanical stress.

In fracture mechanics, a crack growth resistance curve shows the energy required for crack extension as a function of crack length in a given material. For materials that can be modeled with linear elastic fracture mechanics (LEFM), crack extension occurs when the applied energy release rate exceeds the material's resistance to crack extension .

<span class="mw-page-title-main">Crack tip opening displacement</span>

Crack tip opening displacement (CTOD) or is the distance between the opposite faces of a crack tip at the 90° intercept position. The position behind the crack tip at which the distance is measured is arbitrary but commonly used is the point where two 45° lines, starting at the crack tip, intersect the crack faces. The parameter is used in fracture mechanics to characterize the loading on a crack and can be related to other crack tip loading parameters such as the stress intensity factor and the elastic-plastic J-integral.

<span class="mw-page-title-main">Palmqvist method</span>

The Palmqvist method, or the Palmqvist toughness test, is a common method to determine the fracture toughness for cemented carbides. In this case, the material's fracture toughness is given by the critical stress intensity factor KIc.

In materials science, toughening refers to the process of making a material more resistant to the propagation of cracks. When a crack propagates, the associated irreversible work in different materials classes is different. Thus, the most effective toughening mechanisms differ among different materials classes. The crack tip plasticity is important in toughening of metals and long-chain polymers. Ceramics have limited crack tip plasticity and primarily rely on different toughening mechanisms.

<span class="mw-page-title-main">Crack growth equation</span>

A crack growth equation is used for calculating the size of a fatigue crack growing from cyclic loads. The growth of a fatigue crack can result in catastrophic failure, particularly in the case of aircraft. When many growing fatigue cracks interact with one another it is known as widespread fatigue damage. A crack growth equation can be used to ensure safety, both in the design phase and during operation, by predicting the size of cracks. In critical structure, loads can be recorded and used to predict the size of cracks to ensure maintenance or retirement occurs prior to any of the cracks failing. Safety factors are used to reduce the predicted fatigue life to a service fatigue life because of the sensitivity of the fatigue life to the size and shape of crack initiating defects and the variability between assumed loading and actual loading experienced by a component.

References

  1. 1 2 Khan, M. F.; Ghavanini, F. A.; Haasl, S.; Löfgren, L.; Persson, K.; Rusu, C.; Schjølberg-Henriksen, K.; Enoksson, P. (2010). "Methods for characterization of wafer-level encapsulation applied on silicon to LTCC anodic bonding". Journal of Micromechanics and Microengineering. 20 (6): 064020. Bibcode:2010JMiMi..20f4020K. doi:10.1088/0960-1317/20/6/064020. S2CID   111119698.
  2. Cui, Z. (2008). "Anodic Bonding". In Li, D. (ed.). Encyclopedia of Microfluidics and Nanofluidics . Springer Science+Business Media, LLC. pp.  50–54. ISBN   978-0-387-48998-8.
  3. 1 2 3 4 5 6 Mack, S. (1997). Eine vergleichende Untersuchung der physikalisch-chemischen Prozesse an der Grenzschicht direkt und anodischer verbundener Festkörper (Report). Jena: Max-Planck-Institut. ISBN   3-18-343602-7.
  4. 1 2 3 Farrens, S. (2008). "Metal Based Wafer Level Packaging". Global SMT & Packaging.
  5. Weldon, M. K.; Marsico, V. E.; Chabal, Y. J.; Hamann, D. R.; Christman, S. B.; Chaban, E. E. (1996). "Infrared spectroscopy as a probe of fundamental processes in microelectronics: silicon wafer cleaning and bonding". Surface Science. 368 (1–3): 163–178. Bibcode:1996SurSc.368..163W. doi:10.1016/S0039-6028(96)01046-1.
  6. Lin, Y.-C.; Baum, M.; Haubold, M.; Fromel, J.; Wiemer, M.; Gessner, T.; Esashi, M. (2009). "Development and evaluation of AuSi eutectic wafer bonding". Solid-State Sensors, Actuators and Microsystems Conference, 2009. TRANSDUCERS 2009. International. pp. 244–247. doi:10.1109/SENSOR.2009.5285519.
  7. Sood, S.; Thomas, R.; Adams, T. (2008). "Acoustic Characterization of Bonded Wafers". ECS Transactions. 16 (8): 425–428. Bibcode:2008ECSTr..16h.425S. doi:10.1149/1.2982896. S2CID   137175862.
  8. 1 2 3 4 5 6 7 {{cite journal \|author=Vallin, Ö. |author2=Jonsson, K. |author3=Lindberg, U. |title = Adhesion quantification methods for wafer bonding |journal = Materials Science and Engineering: R: Reports |year = 2005 |volume = 50 |pages = 109–165 |number = 4–5 |doi = 10.1016/j.mser.2005.07.002 }}
  9. 1 2 Nötzold, K.; Graf, J.; Müller-Fiedler, R. (2008). "A four-point-bending-test for the stability assessment of glass frit bonded molded microsensors". Microelectronics Reliability. 48 (8–9): 1562–1566. doi:10.1016/j.microrel.2008.07.001.
  10. 1 2 Wünsch, D.; Müller, B.; Wiemer, M.; Gessner, T.; Mischke, H. (May 2010). "Aktivierung mittels Niederdruckplasma zur Herstellung von Si-Verbunden im Niedertemperatur-Bereich und deren Charakterisierung mittels Mikro-Chevron-Test". Technologien und Werkstoffe der Mikrosystem- und Nanotechnik (GMM-Fachbereicht Band 65). Darmstadt: VDE Verlag GmbH Berlin Offenbach. pp. 66–71. ISBN   978-3-8007-3253-1.
  11. 1 2 3 Wiemer, M.; Frömel, J.; Chenping, J.; Haubold, M.; Gessner, T. (2008). "Waferbond technologies and quality assessment". Electronic Components and Technology Conference, 2008. ECTC 2008. 58th. pp. 319–324. doi:10.1109/ECTC.2008.4549989.
  12. 1 2 3 4 5 Petzold, M.; Knoll, H.; Bagdahn, J. (2001). "Strength assessment of wafer-bonded micromechanical components using the Micro-Chevron-Test". Reliability, Testing, and Characterization of MEMS/MOEMS. doi:10.1117/12.442994.
  13. 1 2 3 4 5 Schneider, A.; Rank, H.; Müller-Fiedler, R.; Wittler, O.; Reichl, H. (2009). "Stabilitätsbewertung eutektisch gebondeter Sensorstrukturen auf Waferlevel". In Hermann, G. (ed.). 9. Chemnitzer Fachtagung Mikromechanik & Mikroelektronik. pp. 51–56.
  14. Petzold, M.; Dresbach, C.; Ebert, M.; Bagdahn, J.; Wiemer, M.; Glien, K.; Graf, J.; Müller-Fiedler, R.; Höfer, H. (2006). "Fracture mechanical life-time investigation of glass frit-bonded sensors". The Tenth Intersociety Conference on Thermal and Thermomechanical Phenomena in Electronics Systems, 2006. ITHERM '06. pp. 1343–1348. doi:10.1109/ITHERM.2006.1645501.
  15. Vogel, K.; Wünsch, D.; Shaporin, A.; Mehner, J.; Billep, D.; Wiemer, D. (2010). "Crack propagation in micro-chevron-test samples of direct bonded silicon-silicon wafers". 9th Youth Symposium on Experimental Solid Mechanics. pp. 44–47.
  16. Arrigoni, Michel. "Adhesive Bond Testing by Laser Induced Shock Waves".
  17. Sykes, Bob (May 2014). "Advances in tweezer pull testing". Chip Scale Review.
  18. Sykes, Bob (June 2010). "Why test bonds?". Global SMT & Packaging magazine.
  19. Wyant, J. C. (2002). "White Light Interferometry". In H. John Caulfield (ed.). Holography: A Tribute to Yuri Denisyuk and Emmett Leith. Vol. 4737. pp. 98–107. doi:10.1117/12.474947. S2CID   123532345.
  20. Totsu, K.; Haga, Y.; Esashi, M. (2005). "Ultra-miniature fiber-optic pressure sensor using white light interferometry". Journal of Micromechanics and Microengineering. 15 (1): 71–75. Bibcode:2005JMiMi..15...71T. doi:10.1088/0960-1317/15/1/011. S2CID   250923158.