| |||||||||||||||||||||||||
All 18 Pennsylvania seats to the United States House of Representatives | |||||||||||||||||||||||||
---|---|---|---|---|---|---|---|---|---|---|---|---|---|---|---|---|---|---|---|---|---|---|---|---|---|
| |||||||||||||||||||||||||
|
Elections in Pennsylvania |
---|
Government |
The 2020 United States House of Representatives elections in Pennsylvania were held on November 3, 2020, to elect the 18 U.S. representatives from the state of Pennsylvania, one from each of the state's 18 congressional districts. The state's primary election occurred on June 2, 2020. The elections coincided with the 2020 U.S. presidential election, as well as other elections to the House of Representatives, elections to the United States Senate and various state and local elections.
Results of the 2020 United States House of Representatives elections in Pennsylvania by district: [1]
District | Republican | Democratic | Total | Result | |||
---|---|---|---|---|---|---|---|
Votes | % | Votes | % | Votes | % | ||
District 1 | 249,804 | 56.56% | 191,875 | 43.44% | 441,679 | 100.0% | Republican hold |
District 2 | 75,022 | 27.46% | 198,140 | 72.54% | 273,162 | 100.0% | Democratic hold |
District 3 | 33,671 | 8.97% | 341,708 | 91.03% | 375,379 | 100.0% | Democratic hold |
District 4 | 179,926 | 40.47% | 264,637 | 59.53% | 444,563 | 100.0% | Democratic hold |
District 5 | 139,552 | 35.3% | 255,743 | 64.7% | 395,295 | 100.0% | Democratic hold |
District 6 | 177,526 | 43.95% | 226,440 | 56.05% | 403,966 | 100.0% | Democratic hold |
District 7 | 181,407 | 47.87% | 195,475 | 52.13% | 376,882 | 100.0% | Democratic hold |
District 8 | 165,783 | 48.22% | 178,004 | 51.78% | 343,787 | 100.0% | Democratic hold |
District 9 | 232,988 | 66.33% | 118,266 | 33.67% | 351,254 | 100.0% | Republican hold |
District 10 | 208,896 | 53.31% | 182,938 | 46.69% | 391,834 | 100.0% | Republican hold |
District 11 | 241,915 | 63.12% | 141,325 | 36.88% | 383,240 | 100.0% | Republican hold |
District 12 | 241,035 | 70.84% | 99,199 | 29.16% | 340,234 | 100.0% | Republican hold |
District 13 | 267,789 | 73.49% | 96,612 | 26.51% | 364,401 | 100.0% | Republican hold |
District 14 | 241,688 | 64.69% | 131,895 | 35.31% | 373,583 | 100.0% | Republican hold |
District 15 | 255,058 | 73.46% | 92,156 | 26.54% | 347,214 | 100.0% | Republican hold |
District 16 | 210,088 | 59.34% | 143,962 | 40.66% | 354,050 | 100.0% | Republican hold |
District 17 | 212,284 | 48.85% | 222,253 | 51.15% | 434,537 | 100.0% | Democratic hold |
District 18 | 118,163 | 30.75% | 266,084 | 69.25% | 384,247 | 100.0% | Democratic hold |
Total | 3,432,595 | 50.63% | 3,346,712 | 49.37% | 6,779,307 | 100.0% |
| |||||||||||||||||
Precinct results Fitzpatrick: 50–60% 60–70% 70–80% Finello: 40–50% 50–60% 60–70% | |||||||||||||||||
|
The 1st district consists of all of Bucks County and a sliver of Montgomery County. The incumbent was Republican Brian Fitzpatrick, who was re-elected with 51.3% of the vote in 2018. [2]
Party | Candidate | Votes | % | |
---|---|---|---|---|
Republican | Brian Fitzpatrick (incumbent) | 48,017 | 63.2 | |
Republican | Andy Meehan | 27,895 | 36.8 | |
Total votes | 75,912 | 100.0 |
Party | Candidate | Votes | % | |
---|---|---|---|---|
Democratic | Christina Finello | 71,571 | 77.5 | |
Democratic | Skylar Hurwitz | 20,737 | 22.5 | |
Total votes | 92,308 | 100.0 |
No. | Date | Host | Moderator | Link | Republican | Democratic |
---|---|---|---|---|---|---|
Key: P Participant A Absent N Not invited I Invited W Withdrawn | ||||||
Brian Fitzpatrick | Christina Finello | |||||
1 | Oct. 6, 2020 | YouTube | P | P |
Source | Ranking | As of |
---|---|---|
The Cook Political Report [22] | Lean R | July 2, 2020 |
Inside Elections [23] | Lean R | October 1, 2020 |
Politico [24] | Tossup | November 2, 2020 |
Daily Kos [25] | Tossup | October 26, 2020 |
RCP [26] | Tossup | June 9, 2020 |
Niskanen [27] | Lean R | June 7, 2020 |
270toWin [28] | Lean R | August 21, 2020 |
Sabato's Crystal Ball [29] | Lean R | September 3, 2020 |
Graphs are unavailable due to technical issues. There is more info on Phabricator and on MediaWiki.org. |
Poll source | Date(s) administered | Sample size [lower-alpha 1] | Margin of error | Brian Fitzpatrick (R) | Christina Finello (D) | Other | Undecided |
---|---|---|---|---|---|---|---|
Public Policy Polling (D) Archived October 14, 2020, at the Wayback Machine [upper-alpha 1] | October 6–7, 2020 | 569 (LV) | – | 46% | 47% | – | 7% |
Global Strategy Group (D) [upper-alpha 2] | October 1–4, 2020 | 400 (LV) | ± 4.9% | 47% | 45% | – | – |
American Viewpoint (R) [upper-alpha 3] | September 14–16, 2020 | 400 (LV) | ± 4.9% | 52% | 36% | – | – |
DFM Research Archived August 23, 2020, at the Wayback Machine | August 16–18, 2020 | 384 (LV) | ± 5.0% | 47% | 35% | 4% [lower-alpha 2] | 14% |
American Viewpoint (R) [upper-alpha 3] | July 13–15, 2020 | 400 (LV) | ± 4.9% | 50% | 35% | 5% [lower-alpha 3] | 8% |
Public Opinion Strategies (R) [upper-alpha 4] | July 11–14, 2020 | 400 (LV) | ± 4.9% | 53% | 39% | – | – |
Victoria Research & Consulting (D) [upper-alpha 1] | June 7–14, 2020 | 403 (LV) | ± 4.9% | 46% | 46% | – | 8% |
Public Policy Polling (D) [upper-alpha 2] | June 10–11, 2020 | 753 (LV) | ± 3.6% | 40% | 38% | – | 21% |
Poll source | Date(s) administered | Sample size [lower-alpha 1] | Margin of error | Brian Fitzpatrick (R) | Debbie Waschspress (D) | Undecided |
---|---|---|---|---|---|---|
Remington Research (R) [upper-alpha 3] | November 6–7, 2019 | 803 (LV) | ± 3.4% | 50% | 36% | 14% |
Poll source | Date(s) administered | Sample size [lower-alpha 1] | Margin of error | Generic Republican | Generic Democrat | Other | Undecided |
---|---|---|---|---|---|---|---|
Public Policy Polling (D) Archived October 14, 2020, at the Wayback Machine | October 6–7, 2020 | 569 (LV) | – | 44% | 50% | – | 6% |
Public Policy Polling (D) [upper-alpha 2] | June 10–11, 2020 | 753 (LV) | ± 3.6% | 40% | 49% | – | 11% |
Victoria Research & Consulting (D) [upper-alpha 1] | June 7–14, 2020 | 403 (LV) | ± 4.9% | 40% [lower-alpha 4] | 52% | 2% [lower-alpha 5] | 8% |
Party | Candidate | Votes | % | |
---|---|---|---|---|
Republican | Brian Fitzpatrick (incumbent) | 249,804 | 56.6 | |
Democratic | Christina Finello | 191,875 | 43.4 | |
Total votes | 441,679 | 100.0 | ||
Republican hold | ||||
| |||||||||||||||||
Precinct results Boyle: 50–60% 60–70% 70–80% 80–90% >90% Torres: 50–60% 60–70% Tie: 50% | |||||||||||||||||
|
The 2nd district consists of Northeast Philadelphia and parts of North Philadelphia. The incumbent was Democrat Brendan Boyle who was re-elected with 79.0% of the vote in 2018. [2]
Party | Candidate | Votes | % | |
---|---|---|---|---|
Democratic | Brendan Boyle (incumbent) | 73,980 | 100.0 | |
Total votes | 73,980 | 100.0 |
Party | Candidate | Votes | % | |
---|---|---|---|---|
Republican | David Torres | 14,010 | 100.0 | |
Total votes | 14,010 | 100.0 |
Source | Ranking | As of |
---|---|---|
The Cook Political Report [22] | Safe D | July 2, 2020 |
Inside Elections [23] | Safe D | June 2, 2020 |
Sabato's Crystal Ball [29] | Safe D | July 2, 2020 |
Politico [24] | Safe D | April 19, 2020 |
Daily Kos [25] | Safe D | June 3, 2020 |
RCP [26] | Safe D | June 9, 2020 |
Niskanen [27] | Safe D | June 7, 2020 |
270toWin [28] | Safe D | August 21, 2020 |
Party | Candidate | Votes | % | |
---|---|---|---|---|
Democratic | Brendan Boyle (incumbent) | 198,140 | 72.5 | |
Republican | David Torres | 75,022 | 27.5 | |
Total votes | 273,162 | 100.0 | ||
Democratic hold | ||||
| |||||||||||||||||
Precinct results Evans: 50–60% 60–70% 70–80% 80–90% >90% Harvey: 50–60% | |||||||||||||||||
|
The 3rd district is anchored by Philadelphia, taking in the northwest, west, and Center City sections of the city. The incumbent was Democrat Dwight Evans, who was re-elected with 93.4% of the vote in 2018. [2]
Party | Candidate | Votes | % | |
---|---|---|---|---|
Democratic | Dwight Evans (incumbent) | 164,871 | 100.0 | |
Total votes | 164,871 | 100.0 |
Party | Candidate | Votes | % | |
---|---|---|---|---|
Republican | Michael Harvey | 5,020 | 100.0 | |
Total votes | 5,020 | 100.0 |
Source | Ranking | As of |
---|---|---|
The Cook Political Report [22] | Safe D | July 2, 2020 |
Inside Elections [23] | Safe D | June 2, 2020 |
Sabato's Crystal Ball [29] | Safe D | July 2, 2020 |
Politico [24] | Safe D | April 19, 2020 |
Daily Kos [25] | Safe D | June 3, 2020 |
RCP [26] | Safe D | June 9, 2020 |
Niskanen [27] | Safe D | June 7, 2020 |
270toWin [28] | Safe D | August 21, 2020 |
Party | Candidate | Votes | % | |
---|---|---|---|---|
Democratic | Dwight Evans (incumbent) | 341,708 | 91.0 | |
Republican | Michael Harvey | 33,671 | 9.0 | |
Total votes | 375,379 | 100.0 | ||
Democratic hold | ||||
| |||||||||||||||||
Precinct results Dean: 50–60% 60–70% 70–80% 80–90% >90% Barnette: 50–60% 60–70% 70–80% | |||||||||||||||||
|
The 4th district takes in the northern suburbs of Philadelphia, centering on Montgomery County. The incumbent was Democrat Madeleine Dean, who was elected with 63.5% of the vote in 2018. [2]
Party | Candidate | Votes | % | |
---|---|---|---|---|
Democratic | Madeleine Dean (incumbent) | 122,657 | 100.0 | |
Total votes | 122,657 | 100.0 |
Party | Candidate | Votes | % | |
---|---|---|---|---|
Republican | Kathy Barnette | 58,571 | 100.0 | |
Total votes | 58,571 | 100.0 |
Source | Ranking | As of |
---|---|---|
The Cook Political Report [22] | Safe D | July 2, 2020 |
Inside Elections [23] | Safe D | June 2, 2020 |
Sabato's Crystal Ball [29] | Safe D | July 2, 2020 |
Politico [24] | Safe D | April 19, 2020 |
Daily Kos [25] | Safe D | June 3, 2020 |
RCP [26] | Safe D | June 9, 2020 |
Niskanen [27] | Safe D | June 7, 2020 |
270toWin [28] | Safe D | August 21, 2020 |
Party | Candidate | Votes | % | |
---|---|---|---|---|
Democratic | Madeleine Dean (incumbent) | 264,637 | 59.5 | |
Republican | Kathy Barnette | 179,926 | 40.5 | |
Total votes | 444,563 | 100.0 | ||
Democratic hold | ||||
| |||||||||||||||||
Precinct results Scanlon: 50–60% 60–70% 70–80% 80–90% >90% Pruett: 50–60% 60–70% Tie: 40–50% 50% No data | |||||||||||||||||
|
The 5th district consists of Delaware County, portions of South Philadelphia, and a sliver of Montgomery County. The incumbent was Democrat Mary Gay Scanlon, who flipped the district with 65.2% of the vote in 2018. [2]
Party | Candidate | Votes | % | |
---|---|---|---|---|
Democratic | Mary Gay Scanlon (incumbent) | 103,194 | 100.0 | |
Total votes | 103,194 | 100.0 |
Party | Candidate | Votes | % | |
---|---|---|---|---|
Republican | Dasha Pruett | 31,734 | 61.5 | |
Republican | Rob Jordan | 19,890 | 38.5 | |
Total votes | 51,624 | 100.0 |
Source | Ranking | As of |
---|---|---|
The Cook Political Report [22] | Safe D | July 2, 2020 |
Inside Elections [23] | Safe D | June 2, 2020 |
Sabato's Crystal Ball [29] | Safe D | July 2, 2020 |
Politico [24] | Safe D | April 19, 2020 |
Daily Kos [25] | Safe D | June 3, 2020 |
RCP [26] | Safe D | June 9, 2020 |
Niskanen [27] | Safe D | June 7, 2020 |
270toWin [28] | Safe D | August 21, 2020 |
Party | Candidate | Votes | % | |
---|---|---|---|---|
Democratic | Mary Gay Scanlon (incumbent) | 255,743 | 64.7 | |
Republican | Dasha Pruett | 139,552 | 35.3 | |
Total votes | 395,295 | 100.0 | ||
Democratic hold | ||||
| |||||||||||||||||
Precinct results Houlahan: 50–60% 60–70% 70–80% 80–90% >90% Emmons: 50–60% 60–70% 70–80% >90% | |||||||||||||||||
|
The 6th district encompasses all of Chester County and the part of southern Berks County including Reading. The incumbent was Democrat Chrissy Houlahan, who flipped the district and was elected with 58.9% of the vote in 2018. [2]
Party | Candidate | Votes | % | |
---|---|---|---|---|
Democratic | Chrissy Houlahan (incumbent) | 89,411 | 100.0 | |
Total votes | 89,411 | 100.0 |
Party | Candidate | Votes | % | |
---|---|---|---|---|
Republican | John Emmons | 56,928 | 100.0 | |
Total votes | 56,928 | 100.0 |
Source | Ranking | As of |
---|---|---|
The Cook Political Report [22] | Safe D | July 2, 2020 |
Inside Elections [23] | Safe D | June 2, 2020 |
Sabato's Crystal Ball [29] | Safe D | July 2, 2020 |
Politico [24] | Safe D | April 19, 2020 |
Daily Kos [25] | Safe D | June 3, 2020 |
RCP [26] | Safe D | June 9, 2020 |
Niskanen [27] | Safe D | June 7, 2020 |
270toWin [28] | Safe D | August 21, 2020 |
Party | Candidate | Votes | % | |
---|---|---|---|---|
Democratic | Chrissy Houlahan (incumbent) | 226,440 | 56.1 | |
Republican | John Emmons | 177,526 | 43.9 | |
Total votes | 403,966 | 100.0 | ||
Democratic hold | ||||
| |||||||||||||||||
Wild: 50–60% 60–70% 70–80% 80–90% Scheller: 50–60% 60–70% 70–80% | |||||||||||||||||
|
The 7th district is based in the Lehigh Valley, and consists of Lehigh and Northampton counties as well as parts of Monroe County, including the cities of Allentown, Bethlehem, and Easton. The incumbent was Democrat Susan Wild, who flipped the district and was elected with 53.5% of the vote in 2018. [2]
Party | Candidate | Votes | % | |
---|---|---|---|---|
Democratic | Susan Wild (incumbent) | 76,878 | 100.0 | |
Total votes | 76,878 | 100.0 |
Party | Candidate | Votes | % | |
---|---|---|---|---|
Republican | Lisa Scheller | 29,673 | 52.1 | |
Republican | Dean Browning | 27,260 | 47.9 | |
Total votes | 56,933 | 100.0 |
Source | Ranking | As of |
---|---|---|
The Cook Political Report [22] | Likely D | October 8, 2020 |
Inside Elections [23] | Safe D | June 2, 2020 |
Sabato's Crystal Ball [29] | Likely D | October 8, 2020 |
Politico [24] | Lean D | April 19, 2020 |
Daily Kos [25] | Safe D | October 29, 2020 |
RCP [26] | Likely D | June 9, 2020 |
Niskanen [27] | Safe D | June 7, 2020 |
270toWin [28] | Likely D | August 21, 2020 |
Poll source | Date(s) administered | Sample size [lower-alpha 1] | Margin of error | Susan Wild (D) | Lisa Scheller (R) | Other | Undecided |
---|---|---|---|---|---|---|---|
DeSales University | October 11–24, 2020 [lower-alpha 6] | 448 (LV) | ± 4.4% | 54% | 36% | – | – |
Franklin & Marshall College | October 12–18, 2020 | 447 (V) | ± 5.8% | 44% | 36% | – | 20% |
DeSales University | October 3–10, 2020 | 466 (LV) | ± 4.3% | 54% | 36% | – | – |
Muhlenberg College/Morning Call | September 21–24, 2020 | 414 (LV) | ± 5.5% | 52% | 39% | 2% [lower-alpha 5] | 8% |
Party | Candidate | Votes | % | |
---|---|---|---|---|
Democratic | Susan Wild (incumbent) | 195,475 | 51.9 | |
Republican | Lisa Scheller | 181,407 | 48.1 | |
Total votes | 376,882 | 100.0 | ||
Democratic hold | ||||
| |||||||||||||||||
Cartwright: 50–60% 60–70% 70–80% Bognet: 50–60% 60–70% 70–80% | |||||||||||||||||
|
The 8th district, based in the northeastern part of the state, is home to the cities of Scranton and Wilkes-Barre. The incumbent was Democrat Matt Cartwright, who was re-elected with 54.6% of the vote in 2018. [2]
Party | Candidate | Votes | % | |
---|---|---|---|---|
Democratic | Matt Cartwright (incumbent) | 75,101 | 100.0 | |
Total votes | 75,101 | 100.0 |
Party | Candidate | Votes | % | |
---|---|---|---|---|
Republican | Jim Bognet | 16,281 | 28.4 | |
Republican | Teddy Daniels | 13,560 | 23.7 | |
Republican | Earl Granville | 13,283 | 23.2 | |
Republican | Mike Marsciano | 7,404 | 12.9 | |
Republican | Harry Haas | 5,369 | 9.4 | |
Republican | Mike Cammisa | 1,367 | 2.4 | |
Total votes | 57,264 | 100.0 |
Source | Ranking | As of |
---|---|---|
The Cook Political Report [22] | Lean D | July 17, 2020 |
Inside Elections [23] | Safe D | October 16, 2020 |
Sabato's Crystal Ball [29] | Likely D | October 8, 2020 |
Politico [24] | Lean D | April 19, 2020 |
Daily Kos [25] | Likely D | October 26, 2020 |
RCP [26] | Tossup | June 9, 2020 |
Niskanen [27] | Safe D | June 7, 2020 |
270toWin [28] | Lean D | August 21, 2020 |
Poll source | Date(s) administered | Sample size [lower-alpha 1] | Margin of error | Matt Cartwright (D) | Jim Bognet (R) | Undecided |
---|---|---|---|---|---|---|
co/efficient (R) Archived October 17, 2020, at the Wayback Machine [upper-alpha 5] | October 13–14, 2020 | 615 (LV) | – | 48% | 43% | 9% |
Party | Candidate | Votes | % | |
---|---|---|---|---|
Democratic | Matt Cartwright (incumbent) | 178,004 | 51.8 | |
Republican | Jim Bognet | 165,783 | 48.2 | |
Total votes | 343,787 | 100.0 | ||
Democratic hold | ||||
| |||||||||||||||||
Precinct results Meuser: 40–50% 50–60% 60–70% 70–80% 80–90% >90% Wegman: 50–60% 60–70% No data | |||||||||||||||||
|
The 9th district encompasses the Coal Region of Northeastern Pennsylvania. The incumbent was Republican Dan Meuser, who was elected with 59.7% of the vote in 2018. [2]
Party | Candidate | Votes | % | |
---|---|---|---|---|
Republican | Dan Meuser (incumbent) | 77,350 | 100.0 | |
Total votes | 77,350 | 100.0 |
Party | Candidate | Votes | % | |
---|---|---|---|---|
Democratic | Gary Wegman | 27,451 | 51.0 | |
Democratic | Laura Quick | 26,385 | 49.0 | |
Total votes | 53,836 | 100.0 |
Source | Ranking | As of |
---|---|---|
The Cook Political Report [22] | Safe R | July 2, 2020 |
Inside Elections [23] | Safe R | June 2, 2020 |
Sabato's Crystal Ball [29] | Safe R | July 2, 2020 |
Politico [24] | Safe R | April 19, 2020 |
Daily Kos [25] | Safe R | June 3, 2020 |
RCP [26] | Safe R | June 9, 2020 |
Niskanen [27] | Safe R | June 7, 2020 |
270toWin [28] | Safe R | August 21, 2020 |
Party | Candidate | Votes | % | |
---|---|---|---|---|
Republican | Dan Meuser (incumbent) | 232,988 | 66.3 | |
Democratic | Gary Wegman | 118,266 | 33.7 | |
Total votes | 351,254 | 100.0 | ||
Republican hold | ||||
| |||||||||||||||||
Precinct results Perry: 50–60% 60–70% 70–80% 80–90% DePasquale: 50–60% 60–70% 70–80% 80–90% >90% | |||||||||||||||||
|
The 10th district covers all of Dauphin County and parts of Cumberland and York counties, including the cities of Harrisburg and York. The incumbent was Republican Scott Perry, who was re-elected with 51.3% of the vote in 2018. [2]
Party | Candidate | Votes | % | |
---|---|---|---|---|
Republican | Scott Perry (incumbent) | 79,365 | 100.0 | |
Total votes | 79,365 | 100.0 |
Poll source | Date(s) administered | Sample size [lower-alpha 1] | Margin of error | Tom Brier | Eugene De Pasquale |
---|---|---|---|---|---|
GBAO Strategies [upper-alpha 6] | February 5–9, 2020 | – (V) [lower-alpha 7] | – | 16% | 68% |
Party | Candidate | Votes | % | |
---|---|---|---|---|
Democratic | Eugene DePasquale | 45,453 | 57.4 | |
Democratic | Tom Brier | 33,661 | 42.6 | |
Total votes | 79,114 | 100.0 |
Source | Ranking | As of |
---|---|---|
The Cook Political Report [22] | Tossup | July 2, 2020 |
Inside Elections [23] | Tossup | October 16, 2020 |
Sabato's Crystal Ball [29] | Lean D (flip) | November 2, 2020 |
Politico [24] | Tossup | April 19, 2020 |
Daily Kos [25] | Lean R | June 3, 2020 |
RCP [26] | Tossup | June 9, 2020 |
Niskanen [27] | Lean R | June 7, 2020 |
270toWin [28] | Tossup | August 21, 2020 |
Graphs are unavailable due to technical issues. There is more info on Phabricator and on MediaWiki.org. |
Poll source | Date(s) administered | Sample size [lower-alpha 1] | Margin of error | Scott Perry (R) | Eugene DePasquale (D) | Other/ Undecided |
---|---|---|---|---|---|---|
Tarrance Group (R) [upper-alpha 7] | October 13–15, 2020 | 400 (LV) | ± 4.9% | 48% | 44% | 8% [lower-alpha 8] |
GBAO Strategies (D) [upper-alpha 8] | September 29 – October 2, 2020 | 500 (LV) | ± 4.4% | 45% | 51% | – |
Victoria Research (D) Archived October 3, 2020, at the Wayback Machine [upper-alpha 1] | September 22–24, 2020 | 401 (LV) | ± 4.9% | 43% | 50% | 7% [lower-alpha 9] |
Pulse Research | August 18 – September 3, 2020 | 1,100 (LV) | ± 2.9% | 45% [lower-alpha 10] | 44% | – |
GBAO Strategies (D) [upper-alpha 8] | August 30 – September 1, 2020 | 500 (LV) | ± 4.4% | 46% | 50% | – |
DFM Research Archived August 17, 2020, at the Wayback Machine | August 6–9, 2020 | 384 (LV) | ± 5.0% | 44% | 46% | 10% [lower-alpha 11] |
Victoria Research (D) Archived October 3, 2020, at the Wayback Machine [upper-alpha 1] | June, 2020 | – (V) [lower-alpha 7] | – | 50% | 44% | – |
GBAO Strategies (D) [upper-alpha 8] | May 28–31, 2020 | 600 (LV) | ± 4.0% | 50% | 47% | – |
Poll source | Date(s) administered | Sample size [lower-alpha 1] | Margin of error | Generic Republican | Generic Democrat | Other | Undecided |
---|---|---|---|---|---|---|---|
Pennsylvania Survey Research (D) [upper-alpha 1] | September 22–24, 2020 | 401 (LV) | ± 4.9% | 44% | 47% | 2% [lower-alpha 5] | 7% [lower-alpha 12] |
GBAO Strategies (D) [upper-alpha 8] | August 30 – September 1, 2020 | 500 (LV) | ± 4.4% | 45% | 46% | – | – |
Pennsylvania Survey Research (D) Archived October 3, 2020, at the Wayback Machine [upper-alpha 1] | June, 2020 | – (V) [lower-alpha 7] | – | 47% | 43% | – | – |
Party | Candidate | Votes | % | |
---|---|---|---|---|
Republican | Scott Perry (incumbent) | 208,896 | 53.3 | |
Democratic | Eugene DePasquale | 182,938 | 46.7 | |
Total votes | 391,834 | 100.0 | ||
Republican hold | ||||
| |||||||||||||||||
Precinct results Smucker: 50–60% 60–70% 70–80% 80–90% Hammond: 50–60% 60–70% 70–80% 80–90% | |||||||||||||||||
|
The 11th district is located in South Central Pennsylvania, centering on Lancaster County and southern York County. The incumbent was Republican Lloyd Smucker, who was re-elected with 59.0% of the vote in 2018. [2]
Party | Candidate | Votes | % | |
---|---|---|---|---|
Republican | Lloyd Smucker (incumbent) | 78,842 | 100.0 | |
Total votes | 78,842 | 100.0 |
Party | Candidate | Votes | % | |
---|---|---|---|---|
Democratic | Sarah Hammond | 39,038 | 72.3 | |
Democratic | Paul Daigle | 14,936 | 27.7 | |
Total votes | 53,974 | 100.0 |
Source | Ranking | As of |
---|---|---|
The Cook Political Report [22] | Safe R | July 2, 2020 |
Inside Elections [23] | Safe R | June 2, 2020 |
Sabato's Crystal Ball [29] | Safe R | July 2, 2020 |
Politico [24] | Safe R | April 19, 2020 |
Daily Kos [25] | Safe R | June 3, 2020 |
RCP [26] | Safe R | June 9, 2020 |
Niskanen [27] | Safe R | June 7, 2020 |
270toWin [28] | Safe R | August 21, 2020 |
Party | Candidate | Votes | % | |
---|---|---|---|---|
Republican | Lloyd Smucker (incumbent) | 241,915 | 63.1 | |
Democratic | Sarah Hammond | 141,325 | 36.9 | |
Total votes | 383,240 | 100.0 | ||
Republican hold | ||||
| |||||||||||||||||
Precinct results Keller: 50–60% 60–70% 70–80% 80–90% >90% Griffin: 50–60% 60–70% 70–80% 80–90% | |||||||||||||||||
|
The 12th district encompasses rural North Central Pennsylvania, including Williamsport. The incumbent was Republican Fred Keller, who was elected in a 2019 special election with 68.1% of the vote.
Party | Candidate | Votes | % | |
---|---|---|---|---|
Republican | Fred Keller (incumbent) | 87,886 | 100.0 | |
Total votes | 87,886 | 100.0 |
Party | Candidate | Votes | % | |
---|---|---|---|---|
Democratic | Lee Griffin | 41,313 | 100.0 | |
Total votes | 41,313 | 100.0 |
Source | Ranking | As of |
---|---|---|
The Cook Political Report [22] | Safe R | July 2, 2020 |
Inside Elections [23] | Safe R | June 2, 2020 |
Sabato's Crystal Ball [29] | Safe R | July 2, 2020 |
Politico [24] | Safe R | April 19, 2020 |
Daily Kos [25] | Safe R | June 3, 2020 |
RCP [26] | Safe R | June 9, 2020 |
Niskanen [27] | Safe R | June 7, 2020 |
270toWin [28] | Safe R | August 21, 2020 |
Party | Candidate | Votes | % | |
---|---|---|---|---|
Republican | Fred Keller (incumbent) | 241,035 | 70.8 | |
Democratic | Lee Griffin | 99,199 | 29.2 | |
Total votes | 340,234 | 100.0 | ||
Republican hold | ||||
| |||||||||||||||||
Joyce: 50–60% 60–70% 70–80% 80–90% >90% Rowley: 50–60% 60–70% 70–80% Tie: 50% No data | |||||||||||||||||
|
The 13th district encompasses rural southwestern Pennsylvania, including Altoona. The incumbent was Republican John Joyce, who was elected with 70.5% of the vote in 2018. [2]
Party | Candidate | Votes | % | |
---|---|---|---|---|
Republican | John Joyce (incumbent) | 94,171 | 100.0 | |
Total votes | 94,171 | 100.0 |
Party | Candidate | Votes | % | |
---|---|---|---|---|
Democratic | Todd Rowley | 41,988 | 100.0 | |
Total votes | 41,988 | 100.0 |
Source | Ranking | As of |
---|---|---|
The Cook Political Report [22] | Safe R | July 2, 2020 |
Inside Elections [23] | Safe R | June 2, 2020 |
Sabato's Crystal Ball [29] | Safe R | July 2, 2020 |
Politico [24] | Safe R | April 19, 2020 |
Daily Kos [25] | Safe R | June 3, 2020 |
RCP [26] | Safe R | June 9, 2020 |
Niskanen [27] | Safe R | June 7, 2020 |
270toWin [28] | Safe R | August 21, 2020 |
Party | Candidate | Votes | % | |
---|---|---|---|---|
Republican | John Joyce (incumbent) | 267,789 | 73.5 | |
Democratic | Todd Rowley | 96,612 | 26.5 | |
Total votes | 364,401 | 100.0 | ||
Republican hold | ||||
| |||||||||||||||||
Precinct results Reschenthaler: 40–50% 50–60% 60–70% 70–80% 80–90% >90% Marx: 50–60% 60–70% 70–80% Tie: 50% | |||||||||||||||||
|
The 14th district encompasses the southern exurbs of Pittsburgh. The incumbent was Republican Guy Reschenthaler, who was elected with 57.9% of the vote in 2018. [2]
Party | Candidate | Votes | % | |
---|---|---|---|---|
Republican | Guy Reschenthaler (incumbent) | 66,671 | 100.0 | |
Total votes | 66,671 | 100.0 |
Party | Candidate | Votes | % | |
---|---|---|---|---|
Democratic | Bill Marx | 70,468 | 100.0 | |
Total votes | 70,468 | 100.0 |
Source | Ranking | As of |
---|---|---|
The Cook Political Report [22] | Safe R | July 2, 2020 |
Inside Elections [23] | Safe R | June 2, 2020 |
Sabato's Crystal Ball [29] | Safe R | July 2, 2020 |
Politico [24] | Safe R | April 19, 2020 |
Daily Kos [25] | Safe R | June 3, 2020 |
RCP [26] | Safe R | June 9, 2020 |
Niskanen [27] | Safe R | June 7, 2020 |
270toWin [28] | Safe R | August 21, 2020 |
Party | Candidate | Votes | % | |
---|---|---|---|---|
Republican | Guy Reschenthaler (incumbent) | 241,688 | 64.7 | |
Democratic | Bill Marx | 131,895 | 35.3 | |
Total votes | 373,583 | 100.0 | ||
Republican hold | ||||
| |||||||||||||||||
Precinct results Thompson: 50–60% 60–70% 70–80% 80–90% >90% Williams: 50–60% 60–70% 70–80% No data | |||||||||||||||||
|
The 15th district is located in rural North Central Pennsylvania. The incumbent was Republican Glenn Thompson, who was re-elected with 67.8% of the vote in 2018. [2]
Party | Candidate | Votes | % | |
---|---|---|---|---|
Republican | Glenn Thompson (incumbent) | 88,364 | 100.0 | |
Total votes | 88,364 | 100.0 |
Party | Candidate | Votes | % | |
---|---|---|---|---|
Democratic | Robert Williams | 48,714 | 100.0 | |
Total votes | 48,714 | 100.0 |
Source | Ranking | As of |
---|---|---|
The Cook Political Report [22] | Safe R | July 2, 2020 |
Inside Elections [23] | Safe R | June 2, 2020 |
Sabato's Crystal Ball [29] | Safe R | July 2, 2020 |
Politico [24] | Safe R | April 19, 2020 |
Daily Kos [25] | Safe R | June 3, 2020 |
RCP [26] | Safe R | June 9, 2020 |
Niskanen [27] | Safe R | June 7, 2020 |
270toWin [28] | Safe R | August 21, 2020 |
Party | Candidate | Votes | % | |
---|---|---|---|---|
Republican | Glenn Thompson (incumbent) | 255,058 | 73.5 | |
Democratic | Robert Williams | 92,156 | 26.5 | |
Total votes | 347,214 | 100.0 | ||
Republican hold | ||||
| |||||||||||||||||
Precinct results Kelly: 50–60% 60–70% 70–80% 80–90% >90% Gnibus: 40–50% 50–60% 60–70% 70–80% 80–90% Tie: 50% | |||||||||||||||||
|
The 16th district is located in the northwestern portion of the state, and covers all of Erie, Crawford, Mercer, and Lawrence counties, as well as much of Butler County. The incumbent was Republican Mike Kelly, who was re-elected with 51.6% of the vote in 2018. [2]
Party | Candidate | Votes | % | |
---|---|---|---|---|
Republican | Mike Kelly (incumbent) | 68,199 | 100.0 | |
Total votes | 68,199 | 100.0 |
Party | Candidate | Votes | % | |
---|---|---|---|---|
Democratic | Kristy Gnibus | 63,640 | 100.0 | |
Total votes | 63,640 | 100.0 |
Source | Ranking | As of |
---|---|---|
The Cook Political Report [22] | Likely R | October 8, 2020 |
Inside Elections [23] | Safe R | June 2, 2020 |
Sabato's Crystal Ball [29] | Safe R | July 2, 2020 |
Politico [24] | Lean R | April 19, 2020 |
Daily Kos [25] | Safe R | June 3, 2020 |
RCP [26] | Safe R | June 9, 2020 |
Niskanen [27] | Safe R | June 7, 2020 |
270toWin [28] | Safe R | August 21, 2020 |
Poll source | Date(s) administered | Sample size [lower-alpha 1] | Margin of error | Mike Kelly (R) | Kristy Gnibus (D) | Undecided |
---|---|---|---|---|---|---|
Public Policy Polling (D) [upper-alpha 9] | June 22–23, 2020 | 726 (V) | ± 3.6% | 48% | 40% | 12% |
Party | Candidate | Votes | % | |
---|---|---|---|---|
Republican | Mike Kelly (incumbent) | 210,088 | 59.3 | |
Democratic | Kristy Gnibus | 143,962 | 40.7 | |
Total votes | 354,050 | 100.0 | ||
Republican hold | ||||
| |||||||||||||||||
Precinct results Lamb: 50–60% 60–70% 70–80% 80–90% >90% Parnell: 50–60% 60–70% 70–80% 80–90% Tie: 50% | |||||||||||||||||
|
The 17th district encompasses the northwestern Pittsburgh suburbs, including Beaver County, the southwestern corner of Butler County, and northern Allegheny County. The incumbent was Democrat Conor Lamb, who was re-elected with 56.3% of the vote in 2018. [2]
Party | Candidate | Votes | % | |
---|---|---|---|---|
Democratic | Conor Lamb (incumbent) | 111,828 | 100.0 | |
Total votes | 111,828 | 100.0 |
Party | Candidate | Votes | % | |
---|---|---|---|---|
Republican | Sean Parnell | 60,253 | 100.0 | |
Total votes | 60,253 | 100.0 |
Source | Ranking | As of |
---|---|---|
The Cook Political Report [22] | Likely D | November 2, 2020 |
Inside Elections [23] | Safe D | October 28, 2020 |
Sabato's Crystal Ball [29] | Likely D | July 2, 2020 |
Politico [24] | Lean D | April 19, 2020 |
Daily Kos [25] | Likely D | June 3, 2020 |
RCP [26] | Lean D | October 24, 2020 |
Niskanen [27] | Safe D | June 7, 2020 |
270toWin [28] | Likely D | August 21, 2020 |
Poll source | Date(s) administered | Sample size [lower-alpha 1] | Margin of error | Conor Lamb (D) | Sean Parnell (R) | Undecided |
---|---|---|---|---|---|---|
OnMessage Inc. (R) [upper-alpha 10] | September 2–3, 2020 | 400 (LV) | – | 45% | 44% | 11% |
OnMessage Inc. (R) [upper-alpha 10] | July 27–29, 2020 | 400 (LV) | – | 50% | 41% | 9% |
OnMessage Inc. (R) [upper-alpha 10] | March 9–11, 2020 | 400 (LV) | – | 54% | 36% | 10% |
Party | Candidate | Votes | % | |
---|---|---|---|---|
Democratic | Conor Lamb (incumbent) | 222,253 | 51.1 | |
Republican | Sean Parnell | 212,284 | 48.9 | |
Total votes | 434,537 | 100.0 | ||
Democratic hold | ||||
| |||||||||||||||||
Precinct results Doyle: 50–60% 60–70% 70–80% 80–90% >90% Negron: 40–50% 50–60% 60–70% Tie: 40–50% No data | |||||||||||||||||
|
The 18th district includes the entire city of Pittsburgh and parts of surrounding suburbs. The incumbent was Democrat Mike Doyle, who was re-elected unopposed in 2018. [2]
Party | Candidate | Votes | % | |
---|---|---|---|---|
Democratic | Mike Doyle (incumbent) | 90,353 | 67.2 | |
Democratic | Jerry Dickinson | 44,170 | 32.8 | |
Total votes | 134,523 | 100.0 |
Party | Candidate | Votes | % | |
---|---|---|---|---|
Republican | Luke Negron | 30,497 | 100.0 | |
Total votes | 30,497 | 100.0 |
Source | Ranking | As of |
---|---|---|
The Cook Political Report [22] | Safe D | June 26, 2020 |
Inside Elections [23] | Safe D | June 2, 2020 |
Sabato's Crystal Ball [29] | Safe D | July 2, 2020 |
Politico [24] | Safe D | April 19, 2020 |
Daily Kos [25] | Safe D | June 3, 2020 |
RCP [26] | Safe D | June 9, 2020 |
Niskanen [27] | Safe D | June 7, 2020 |
270toWin [28] | Safe D | August 21, 2020 |
Party | Candidate | Votes | % | |
---|---|---|---|---|
Democratic | Mike Doyle (incumbent) | 266,084 | 69.3 | |
Republican | Luke Negron | 118,163 | 30.7 | |
Total votes | 384,247 | 100.0 | ||
Democratic hold | ||||
The 2018 United States House of Representatives elections in Pennsylvania were held on November 6, 2018, to elect the 18 U.S. representatives from the Commonwealth of Pennsylvania, one from each of the state's 18 congressional districts.
The 2020 United States House of Representatives elections in Nevada was held on November 3, 2020, to elect the four U.S. representatives from the state of Nevada, one from each of the state's four congressional districts. The elections coincided with the 2020 U.S. presidential election, as well as other elections to the House of Representatives, elections to the Nevada Senate and various state and local elections.
A special election for Pennsylvania's 18th congressional district was held on March 13, 2018, following the resignation of Republican representative Tim Murphy. Murphy, who held the seat since January 3, 2003, declared his intent to resign on October 5, 2017, and vacated his seat on October 21 that year. Democrat Conor Lamb defeated Republican Rick Saccone 49.86% to 49.53%. Saccone conceded the race eight days after the election.
The 2020 United States House of Representatives elections in South Carolina were held on November 3, 2020, to elect the seven U.S. representatives from the state of South Carolina, one from each of the state's seven congressional districts. The elections coincided with the 2020 U.S. presidential election, as well as other elections to the House of Representatives, elections to the United States Senate and various state and local elections.
The 2020 United States House of Representatives elections in Texas were held on November 3, 2020, to elect the 36 U.S. representatives from the state of Texas, one from each of the state's 36 congressional districts. The elections coincided with the 2020 U.S. presidential election, as well as other elections to the House of Representatives, elections to the U.S. Senate and various state and local elections. Primaries were held on March 3 and run-offs were held on July 14.
The 2020 United States House of Representatives elections in California were held on November 3, 2020, to elect the 53 U.S. representatives from the state of California, one from each of the state's 53 congressional districts. The elections coincided with the 2020 U.S. presidential election, as well as other elections to the United States House of Representatives, elections to the United States Senate, and various state and local elections.
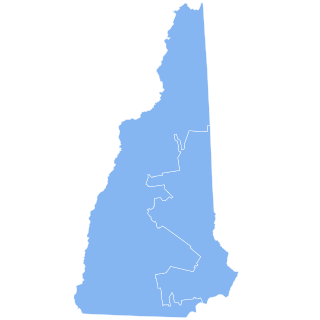
The 2020 United States House of Representatives elections in New Hampshire were held on November 3, 2020, to elect the two U.S. representatives from the state of New Hampshire, one from each of the state's two congressional districts. The elections coincided with the 2020 U.S. presidential election, as well as other elections to the House of Representatives, elections to the United States Senate and various state and local elections.
The 2020 United States House of Representatives elections in Minnesota was held on November 3, 2020, to elect the eight U.S. representatives from the state of Minnesota, one from each of its congressional districts. Primary elections were held in six districts on August 11. The elections coincided with the 2020 United States presidential election as well as other elections to the House of Representatives, elections to the United States Senate and other state and local elections.
The 2020 United States House of Representatives elections in Oklahoma were held on November 3, 2020, to elect the five U.S. representatives from the state of Oklahoma, one from each of the state's five congressional districts. The elections coincided with the 2020 U.S. presidential election, as well as other elections to the House of Representatives, elections to the United States Senate and various state and local elections.
The 2022 United States House of Representatives elections in Ohio were held on November 8, 2022, to elect the 15 U.S. representatives from Ohio, one from each of the state's 15 congressional districts. The elections coincided with other elections to the House of Representatives, other elections to the United States Senate, and various state and local elections. Primary elections took place on May 3.
The 2022 United States House of Representatives elections in Arizona were held on November 8, 2022, to determine the nine representatives of the state of Arizona. The elections coincided with the 2022 Arizona gubernatorial election, as well as other elections to the U.S. House of Representatives, the U.S. Senate, and various other state and local elections. Despite losing the concurrent Senate and governor elections, the Republicans flipped both the 2nd and 6th congressional districts, making this the first time that the party controlled 6 seats in Arizona since 2004. Primaries in Arizona took place on August 2.
The 2022 United States House of Representatives elections in California were held on November 8, 2022, to elect representatives for the 52 seats in California. This marked the first time in the state's history where it lost a seat.
The 2022 United States House of Representatives elections in Indiana were held on November 8, 2022, to elect the nine U.S. representatives from the state of Indiana, one from each of the state's nine congressional districts. The elections coincided with other elections to the U.S. House of Representatives, elections to the U.S. Senate, and various state and local elections. Primary elections took place on May 3.
The 2022 United States House of Representatives elections in Kansas were held on November 8, 2022, to elect the four U.S. representatives from the state of Kansas, one from each of the state's four congressional districts. The elections coincided with other elections to the House of Representatives, elections to the United States Senate and various state and local elections.
The 2022 United States House of Representatives elections in Michigan were held on November 8, 2022, to elect representatives for the thirteen seats in Michigan. The deadline for candidates to file for the August 2 primary was April 19. The congressional makeup prior to the election was seven Democrats and seven Republicans. However, after the 2020 census, Michigan lost one congressional seat. Democrats won a majority of seats in the state for the first time since 2008. This can be partly attributed to the decrease in the number of districts, which resulted in two Republican incumbents – Bill Huizenga and Fred Upton – in the new 4th district. Redistricting also played a part in shifting partisan lean of the districts which favored the Democrats overall, including in the 3rd district, which Democrats were able to flip with a margin of victory of 13 points. That was made possible by a non-partisan citizens' commission drawing the new political boundaries instead of the Michigan legislature after a 2018 ballot proposal was approved.
The 2022 United States House of Representatives elections in Nevada were held on November 8, 2022, to elect the four U.S. representatives from the state of Nevada, one from each of the state's four congressional districts. The elections coincided with the Nevada gubernatorial election, as well as other elections to the U.S. House of Representatives, elections to the U.S. Senate, and various state and local elections.
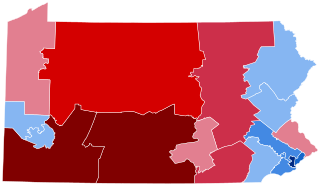
The 2022 United States House of Representatives elections in Pennsylvania were held on November 8, 2022, to elect representatives for the seventeen seats in Pennsylvania.
The 2024 United States House of Representatives elections in Illinois will be held on November 5, 2024, to elect the seventeen U.S. representatives from the State of Illinois, one from all seventeen of the state's congressional districts. The elections will coincide with the 2024 U.S. presidential election, as well as other elections to the House of Representatives, elections to the United States Senate, and various state and local elections. The primary elections were held on March 19, 2024.
The 2024 United States House of Representatives elections in Pennsylvania will be held on November 5, 2024, to elect the seventeen U.S. representatives from the State of Pennsylvania, one from each of the state's congressional districts. The elections will coincide with the 2024 U.S. presidential election, as well as other elections to the House of Representatives, elections to the United States Senate, and various state and local elections. The primary elections are scheduled for April 23, 2024.
The 2024 United States House of Representatives elections in Washington will be held on November 5, 2024, to elect the ten U.S. representatives from the State of Washington, one from each of the state's congressional districts. The elections will coincide with the 2024 U.S. presidential election, as well as other elections to the House of Representatives, elections to the United States Senate, and various state and local elections. The primary elections are scheduled for August 6, 2024.
Decorated war veteran and veterans advocate Earl Granville on Thursday announced his candidacy for Congress in Pennsylvania's 8th Congressional District