Definition
For two random variables X and Y there are three non-trivial cokurtosis statistics [1] [2]


and

where E[X] is the expected value of X, also known as the mean of X, and is the standard deviation of X.
In probability theory and statistics, cokurtosis is a measure of how much two random variables change together. Cokurtosis is the fourth standardized cross central moment. [1] If two random variables exhibit a high level of cokurtosis they will tend to undergo extreme positive and negative deviations at the same time.
For two random variables X and Y there are three non-trivial cokurtosis statistics [1] [2]
and
where E[X] is the expected value of X, also known as the mean of X, and is the standard deviation of X.
Let X and Y each be normally distributed with correlation coefficient ρ. The cokurtosis terms are
Since the cokurtosis depends only on ρ, which is already completely determined by the lower-degree covariance matrix, the cokurtosis of the bivariate normal distribution contains no new information about the distribution. It is a convenient reference, however, for comparing to other distributions.
Let X be standard normally distributed and Y be the distribution obtained by setting X=Y whenever X<0 and drawing Y independently from a standard half-normal distribution whenever X>0. In other words, X and Y are both standard normally distributed with the property that they are completely correlated for negative values and uncorrelated apart from sign for positive values. The joint probability density function is
where H(x) is the Heaviside step function and δ(x) is the Dirac delta function. The fourth moments are easily calculated by integrating with respect to this density:
It is useful to compare this result to what would have been obtained for an ordinary bivariate normal distribution with the usual linear correlation. From integration with respect to density, we find that the linear correlation coefficient of X and Y is
A bivariate normal distribution with this value of ρ would have and . Therefore, all of the cokurtosis terms of this distribution with this nonlinear correlation are smaller than what would have been expected from a bivariate normal distribution with ρ=0.818.
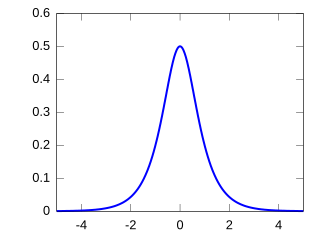
Note that although X and Y are individually standard normally distributed, the distribution of the sum X+Y is platykurtic. The standard deviation of the sum is
Inserting that and the individual cokurtosis values into the kurtosis sum formula above, we have
This can also be computed directly from the probability density function of the sum:
In probability theory and statistics, kurtosis refers to the degree of “tailedness” in the probability distribution of a real-valued random variable. Similar to skewness, kurtosis provides insight into specific characteristics of a distribution. Various methods exist for quantifying kurtosis in theoretical distributions, and corresponding techniques allow estimation based on sample data from a population. It’s important to note that different measures of kurtosis can yield varying interpretations.

In probability theory and statistics, a normal distribution or Gaussian distribution is a type of continuous probability distribution for a real-valued random variable. The general form of its probability density function is

In probability theory and statistics, the multivariate normal distribution, multivariate Gaussian distribution, or joint normal distribution is a generalization of the one-dimensional (univariate) normal distribution to higher dimensions. One definition is that a random vector is said to be k-variate normally distributed if every linear combination of its k components has a univariate normal distribution. Its importance derives mainly from the multivariate central limit theorem. The multivariate normal distribution is often used to describe, at least approximately, any set of (possibly) correlated real-valued random variables, each of which clusters around a mean value.

In statistics, the Pearson correlation coefficient (PCC) is a correlation coefficient that measures linear correlation between two sets of data. It is the ratio between the covariance of two variables and the product of their standard deviations; thus, it is essentially a normalized measurement of the covariance, such that the result always has a value between −1 and 1. As with covariance itself, the measure can only reflect a linear correlation of variables, and ignores many other types of relationships or correlations. As a simple example, one would expect the age and height of a sample of children from a primary school to have a Pearson correlation coefficient significantly greater than 0, but less than 1.
In mathematics, a Gaussian function, often simply referred to as a Gaussian, is a function of the base form and with parametric extension for arbitrary real constants a, b and non-zero c. It is named after the mathematician Carl Friedrich Gauss. The graph of a Gaussian is a characteristic symmetric "bell curve" shape. The parameter a is the height of the curve's peak, b is the position of the center of the peak, and c controls the width of the "bell".

In probability theory and statistics, the Rayleigh distribution is a continuous probability distribution for nonnegative-valued random variables. Up to rescaling, it coincides with the chi distribution with two degrees of freedom. The distribution is named after Lord Rayleigh.
In probability theory, the central limit theorem states that, under certain circumstances, the probability distribution of the scaled mean of a random sample converges to a normal distribution as the sample size increases to infinity. Under stronger assumptions, the Berry–Esseen theorem, or Berry–Esseen inequality, gives a more quantitative result, because it also specifies the rate at which this convergence takes place by giving a bound on the maximal error of approximation between the normal distribution and the true distribution of the scaled sample mean. The approximation is measured by the Kolmogorov–Smirnov distance. In the case of independent samples, the convergence rate is n−1/2, where n is the sample size, and the constant is estimated in terms of the third absolute normalized moment.

In statistics, the Fisher transformation of a Pearson correlation coefficient is its inverse hyperbolic tangent (artanh). When the sample correlation coefficient r is near 1 or -1, its distribution is highly skewed, which makes it difficult to estimate confidence intervals and apply tests of significance for the population correlation coefficient ρ. The Fisher transformation solves this problem by yielding a variable whose distribution is approximately normally distributed, with a variance that is stable over different values of r.
In probability theory and statistics, the generalized extreme value (GEV) distribution is a family of continuous probability distributions developed within extreme value theory to combine the Gumbel, Fréchet and Weibull families also known as type I, II and III extreme value distributions. By the extreme value theorem the GEV distribution is the only possible limit distribution of properly normalized maxima of a sequence of independent and identically distributed random variables. that a limit distribution needs to exist, which requires regularity conditions on the tail of the distribution. Despite this, the GEV distribution is often used as an approximation to model the maxima of long (finite) sequences of random variables.

In probability theory, the Rice distribution or Rician distribution is the probability distribution of the magnitude of a circularly-symmetric bivariate normal random variable, possibly with non-zero mean (noncentral). It was named after Stephen O. Rice (1907–1986).
In probability theory and statistics, the hyperbolic secant distribution is a continuous probability distribution whose probability density function and characteristic function are proportional to the hyperbolic secant function. The hyperbolic secant function is equivalent to the reciprocal hyperbolic cosine, and thus this distribution is also called the inverse-cosh distribution.
In probability theory and statistics, the noncentral chi distribution is a noncentral generalization of the chi distribution. It is also known as the generalized Rayleigh distribution.
In probability theory, calculation of the sum of normally distributed random variables is an instance of the arithmetic of random variables.
In statistics, the multivariate t-distribution is a multivariate probability distribution. It is a generalization to random vectors of the Student's t-distribution, which is a distribution applicable to univariate random variables. While the case of a random matrix could be treated within this structure, the matrix t-distribution is distinct and makes particular use of the matrix structure.
A ratio distribution is a probability distribution constructed as the distribution of the ratio of random variables having two other known distributions. Given two random variables X and Y, the distribution of the random variable Z that is formed as the ratio Z = X/Y is a ratio distribution.
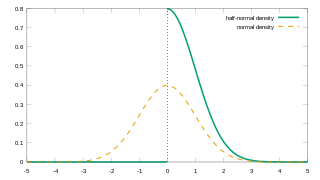
In probability theory and statistics, the half-normal distribution is a special case of the folded normal distribution.
In quantum mechanics, and especially quantum information and the study of open quantum systems, the trace distance is a metric on the space of density matrices and gives a measure of the distinguishability between two states. It is the quantum generalization of the Kolmogorov distance for classical probability distributions.
A product distribution is a probability distribution constructed as the distribution of the product of random variables having two other known distributions. Given two statistically independent random variables X and Y, the distribution of the random variable Z that is formed as the product is a product distribution.
In probability theory and statistics, coskewness is a measure of how much three random variables change together. Coskewness is the third standardized cross central moment, related to skewness as covariance is related to variance. In 1976, Krauss and Litzenberger used it to examine risk in stock market investments. The application to risk was extended by Harvey and Siddique in 2000.
In the mathematical theory of probability, multivariate Laplace distributions are extensions of the Laplace distribution and the asymmetric Laplace distribution to multiple variables. The marginal distributions of symmetric multivariate Laplace distribution variables are Laplace distributions. The marginal distributions of asymmetric multivariate Laplace distribution variables are asymmetric Laplace distributions.


