Electoral results for Molonglo electorate

Last updated

This is a list of electoral results for Molonglo electorate in the Australian Capital Territory Legislative Assembly elections.

Contents

Election results

Elections in the 2010s

2012

2012 Australian Capital Territory general election: Molonglo [1]
PartyCandidateVotes%±%
Quota 11,442
Labor Katy Gallagher (elected 1)23,99626.2+10.4
Labor Andrew Barr (elected 3)3,8804.2−2.0
Labor Meegan Fitzharris 2,6262.9+2.9
Labor Simon Corbell (elected 4)1,9092.1−3.1
Labor Mark Kulasingham1,7491.9+1.9
Labor David Mathews1,4081.5−0.8
Labor Angie Drake1,4041.5+1.5
Liberal Jeremy Hanson (elected 2)10,23511.2+7.5
Liberal Giulia Jones (elected 6)5,7546.3+3.7
Liberal Steve Doszpot (elected 7)5,2455.7+5.7
Liberal Elizabeth Lee 4,4594.9+4.9
Liberal Tom Sefton3,8344.2+4.2
Liberal James Milligan 2,9843.3+3.3
Liberal Murray Gordon1,7501.9+1.9
Greens Shane Rattenbury (elected 5)4,9665.4−5.4
Greens Caroline Le Couteur 4,5315.0+1.2
Greens Adriana Siddle1,3951.5+1.5
Greens Alan Kerlin1,1731.3+1.3
Bullet Train Tim Bohm2,2182.4+2.4
Bullet Train Shelley Dickerson1,8932.1+2.1
Motorist David Cumbers9751.1+0.5
Motorist Mark Curran9221.0+1.0
Liberal Democrats Ian Gardner6100.7+0.7
Liberal Democrats Trisha Jha5170.6+0.6
Independent Philip Pocock6510.7+0.7
Stuart Biggs4500.5+0.5
Total formal votes91,53497.1+0.5
Informal votes2,7532.9−0.5
Turnout 94,28787.1−1.0
Party total votes
Labor 36,97240.4+4.3
Liberal 34,26137.4+5.9
Greens 12,06513.2−5.0
Bullet Train 4,1114.5+4.5
Motorist 1,8972.1–0.7
Liberal Democrats 1,1271.2+0.3
Independent Philip Pocock6510.7+0.9
Stuart Biggs4500.5+0.5

Elections in the 2000s

2008

2008 Australian Capital Territory general election: Molonglo [2]
PartyCandidateVotes%±%
Quota 11,034
Labor Katy Gallagher (elected 2)13,93115.8+4.2
Labor Andrew Barr (elected 4)5,4956.2+2.4
Labor Simon Corbell (elected 6)4,5905.2−4.8
Labor Mike Hettinger2,8223.2−0.8
Labor David Mathews2,0422.3+2.3
Labor Eleanor Bates1,6251.8+1.8
Labor Louise Crossman1,3791.6+1.6
Liberal Zed Seselja (elected 1)16,73919.0+12.9
Liberal Jeremy Hanson (elected 5)3,2783.7+3.7
Liberal Giulia Jones 2,2522.6+2.6
Liberal Gary Kent1,6881.9+1.9
Liberal Jacqui Burke 1,5481.8−4.1
Liberal Belinda Barnier1,2491.4+1.4
Liberal Clinton White1,0541.2+1.2
Greens Shane Rattenbury (elected 3)9,56410.8+10.8
Greens Caroline Le Couteur (elected 7)3,3343.8+3.8
Greens Elena Kirschbaum3,2093.6+3.6
Pangallo IndependentsFrank Pangallo3,5134.0+4.0
Pangallo IndependentsPhil Thompson3960.4+0.4
Pangallo IndependentsLuciano Lombardo3430.4+0.4
Motorist David Cumbers4930.6+0.6
Motorist Anthony Seddon3660.4+0.4
Motorist Stuart Green3610.4+0.4
Motorist Kim Evans3560.4+0.4
Motorist Stephen Rowland3220.4+0.4
Motorist Darren O'Neil3100.4+0.4
Motorist Angus Laburn2430.3+0.3
Canberra Party Richard Mulcahy 2,0572.3+2.3
Canberra Party Ben O'Neill1480.2+0.2
Canberra Party Joanne Allen1360.2+0.2
Independent Helen Cross 1,1201.3−1.6
Community Alliance Norvan Vogt5860.7+0.7
Community Alliance Owen Saddler1510.2+0.2
Community Alliance Nancy-Louise Scherger1350.2+0.2
Community Alliance Alvin Hopper1320.1+0.1
Liberal Democrats David McAlary3980.5+0.5
Liberal Democrats David Pinkerton3760.4+0.4
Greg Tannahill2020.2+0.2
Independent Tony Farrell1720.2+0.0
Independent Kerri Taranto1510.2+0.2
Total formal votes88,26696.6−0.9
Informal votes3,0853.4+0.9
Turnout 91,35188.1−3.2
Party total votes
Labor 31,88436.1−9.2
Liberal 27,80831.5−1.1
Greens 16,10718.2+6.7
Pangallo Independents4,2524.8+4.8
Motorist 2,4512.8+2.8
Canberra Party 2,3412.7+2.7
Independent Helen Cross 1,1201.3−1.6
Community Alliance 1,0041.1+1.1
Liberal Democrats 7740.9−0.9
Greg Tannahill2020.2+0.2
Independent Tony Farrell1720.2+0.0
Independent Kerri Taranto1510.2+0.2

2004

2004 Australian Capital Territory general election: Molonglo [3]
PartyCandidateVotes%±%
Quota 10,628
Labor Ted Quinlan (elected 2)10,09811.88+2.54
Labor Katy Gallagher (elected 1)9,85611.59+7.21
Labor Simon Corbell (elected 3)8,4659.96-0.64
Labor Mike Hettinger3,4054.01+4.01
Labor Andrew Barr 3,2193.79+3.79
Labor Kim Sattler2,0582.42+2.42
Labor Adina Cirson1,4151.66+1.66
Liberal Richard Mulcahy (elected 5)6,5837.74+7.74
Liberal Zed Seselja (elected 7)5,1596.07+6.07
Liberal Jacqui Burke (elected 6)4,9835.86+3.61
Liberal Lucille Bailie 3,4594.07+4.07
Liberal David Kibbey2,6913.17+3.17
Liberal Ron Forrester2,4182.84+2.84
Liberal Gordon Scott2,3912.81+2.81
Greens Deb Foskey (elected 4)3,9384.63+3.79
Greens Charlie Pahlman2,9783.50+3.50
Greens Amanda Bresnan 2,8603.36+3.36
Helen Cross Independents Helen Cross 2,4902.93-0.07
Helen Cross Independents Renee Stramandinoli1180.14+0.14
Independent Ken Helm2,2022.59+2.59
Liberal Democrats John Humphreys1,1681.37+1.37
Liberal Democrats Melanie Sutcliffe3330.39+0.39
Australian Democrats Robert Rose6780.80+0.80
Australian Democrats Fred Leftwich5500.65-2.31
Free Range CanberraSimone Gray3360.40+0.40
Free Range CanberraJo McKinley2940.35+0.35
ACT Equality PartyJohn Simsons2740.32+0.32
ACT Equality PartyNancy-Louise McCullough910.11+0.11
Independent Kurt Kennedy1680.20+0.20
Independent Tony Farrell1490.18+0.18
Non-PartyJohn Farrell760.09+0.09
Non-PartyRobert Fearn300.04+0.04
Independent Luke Garner840.10+0.10
Total formal votes85,01797.46+1.09
Informal votes2,2182.54-1.09
Turnout 87,23591.30+2.08
Party total votes
Labor 38,51645.30+5.99
Liberal 27,68432.56-1.57
Greens 9,77611.50-1.07
Helen Cross Independents 2,6083.07+3.07
Independent Ken Helm2,2022.59+2.59
Liberal Democrats 1,5011.77+1.77
Australian Democrats 1,1281.44-6.19
Free Range Canberra6300.74+0.74
ACT Equality Party3650.43+0.43
Independent Kurt Kennedy1680.20+0.20
Independent Tony Farrell1490.18+0.18
Non-Party1060.12+0.12
Independent Luke Garner840.10+0.10
Labor hold Swing +7.21
Labor hold Swing +2.54
Labor hold Swing -0.64
Liberal hold Swing +7.74
Liberal hold Swing +3.61
Liberal hold Swing +6.07
Greens hold Swing +3.79

2001

2001 Australian Capital Territory general election: Molonglo [4]
PartyCandidateVotes%±%
Quota 9,817
Labor Simon Corbell (elected 3)8,32210.60+5.95
Labor Ted Quinlan (elected 4)7,3319.34+5.38
Labor Katy Gallagher (elected 5)3,4434.38+4.38
Labor John O'Keefe3,3054.21+0.82
Labor Christina Ryan3,2024.08+4.08
Labor Marion Reilly 2,9423.75-0.18
Labor Fred Leftwich2,3282.96+2.96
Liberal Gary Humphries (elected 1)15,85620.19+17.67
Liberal Manuel Xyrakis2,4113.07+3.07
Liberal Helen Cross (elected 6)2,3523.00+3.00
Liberal Jacqui Burke 1,7642.25+1.29
Liberal Greg Cornwell (elected 7)1,6162.06+0.41
Liberal Amalia Matheson1,5061.92+1.92
Liberal Mark Spill1,2981.65+1.65
Greens Kerrie Tucker (elected 2)7,90610.07+3.92
Greens Victoria Young7160.91+0.91
Greens Deb Foskey 6580.84+0.84
Greens Michael Nolan5890.75+0.75
Australian Democrats Jane Errey2,2302.84+0.94
Australian Democrats Stella Jones1,4371.83+1.83
Australian Democrats Isabel Walters1,3521.72+1.72
Australian Democrats Eric Bray9731.24+1.24
Nurses 7650.97+0.97
Nurses Phillip Hickox3440.44+0.44
Group IHilary Back8131.04-0.71
Group IMelanie Marshall1190.15+0.15
Gungahlin Equality PartyIan Ruecroft3820.49+0.49
Gungahlin Equality PartyJonathon Reynolds3620.46+0.46
Canberra First PartyLucinda Spier3140.40+0.40
Canberra First PartyNancy Louise McCullough1460.19+0.19
Canberra First PartyJoel Pasternak1050.13+0.13
Canberra First PartyClaire James1040.13+0.13
Liberal Democrats Duncan Spender 2120.27+0.27
Liberal Democrats Brett Graham1690.22+0.22
Liberal Democrats John Purnell-Webb1500.19+0.19
Independent Ian Black 4240.54+0.54
Group GPamela Ayson1930.25+0.25
Group GTania Gelonesi910.12+0.12
Kaine Independent Group Alan Parker1290.16+0.16
Kaine Independent Group Colin Cartwright1150.15+0.15
Independent Marnie Black540.07+0.07
Total formal votes78,52896.37+0.44
Informal votes2,9553.63-0.44
Turnout 81,48389.22-1.20
Party total votes
Labor 30,87339.31+13.67
Liberal 26,80334.13-7.33
Greens 9,86912.57+2.46
Australian Democrats 5,9927.63+2.56
Nurses Robyn Staniforth1,1091.41+1.41
Group I9321.19+1.19
Gungahlin Equality Party7440.95+0.95
Canberra First Party6690.85+0.85
Liberal Democrats 5310.68+0.68
Independent Ian Black 4240.54+0.54
Group G2840.36+0.36
Kaine Independent Group 2440.31+0.31
Independent Marnie Black540.07+0.07
Labor hold Swing +5.95
Labor hold Swing +5.38
Labor gain from Independent Swing +4.38
Liberal hold Swing +17.67
Liberal hold Swing +3.00
Liberal hold Swing +0.41
Greens hold Swing +3.92

Elections in the 1990s

1998

1998 Australian Capital Territory general election: Molonglo [5]
PartyCandidateVotes%±%
Quota 9,459
Liberal Kate Carnell (elected 1)25,37933.54+4.79
Liberal Gary Humphries (elected 2)1,9032.52-2.04
Liberal Greg Cornwell (elected 4)1,2481.65-0.97
Liberal Nick Tolley8511.12+1.12
Liberal Jacqui Burke 7280.96+0.96
Liberal John Louttit6790.90+0.90
Liberal Greg Aouad5820.77-0.76
Labor Simon Corbell (elected 5)3,5154.65+3.96
Labor Ted Quinlan (elected 6)3,0003.96+3.96
Labor Marion Reilly 2,9743.93+3.03
Labor Tania McMurtry2,7283.61+3.61
Labor Steve Garth2,6603.52+3.52
Labor John O'Keefe2,5653.39+3.39
Labor Chris Flaherty1,9622.59+2.59
Greens Kerrie Tucker (elected 3)4,6526.15-0.16
Greens Roland Manderson7200.95+0.95
Greens Caroline Le Couteur 5660.75+0.75
Greens Niki Ruker4860.64+0.64
Greens Tiffany Lynch4830.64+0.64
Greens Miko Kirschbaum3730.49+0.49
Greens Michael Smitheram3700.49+0.49
Moore Independents Michael Moore (elected 7)4,9366.52-0.53
Moore Independents Joan Kellett3250.43+0.43
Australian Democrats Jane Errey1,4371.90+1.90
Australian Democrats Melissa McEwen7300.96+1.90
Australian Democrats Jim Coates3850.51+0.51
Australian Democrats John Davey3630.48+0.48
Australian Democrats John Kennedy3090.41+0.41
Australian Democrats Jason Wood3080.41+0.41
Australian Democrats Jonathan Tonge3040.40+0.40
Osborne Independent Group Chris Uhlmann 1,6442.17+2.17
Osborne Independent Group Chris Carlile1,1221.48+1.48
Group FJacqui Rees1,4581.93+1.93
Group FNoel Haberecht1730.23+0.23
Christian Democrats Terry Craig5970.79+0.79
Christian Democrats John Edward Miller5970.79+0.79
Democratic Socialist Sue Bull5190.69+0.69
Democratic Socialist Tim Gooden1260.17+0.17
Democratic Socialist Nicholas Adam Soudakoff1000.13+0.13
Independent Jeremy Leyland4870.64+0.64
Independent Pamela Ayson3510.46+0.46
Independent Jerzy Gray-Grzeszkiewicz3200.42+0.42
Progressive Labour Robin Bartrum1030.14+0.14
Progressive Labour Bora Kanra940.12+0.12
Independent John Hancock1660.22+0.22
Independent Nick Dyer1390.18+0.18
Independent Peter Willmott600.08+0.08
Independent Roger John Nicholls470.06+0.06
Independent Daryl Arthur Black420.06+0.06
Total formal votes75,66695.93+1.82
Informal votes3,2134.07-1.82
Turnout 78,87990.42+2.91
Party total votes
Liberal 31,37041.46-1.39
Labor 19,40425.64-5.16
Greens 7,65010.11-0.01
Moore Independents 5,2616.95-1.80
Australian Democrats 3,8365.07+1.87
Osborne Independent Group 2,7663.66+3.66
Group F1,6312.16+2.16
Christian Democrats 1,1941.58+1.58
Democratic Socialist 7450.98+0.98
Independent Jeremy Leyland4870.64+0.64
Independent Pamela Ayson3510.46+0.46
Independent Jerzy Gray-Grzeszkiewicz3200.42+0.42
Progressive Labour Robin Bartrum1970.26+0.26
Independent John Hancock1660.22+0.22
Independent Nick Dyer1390.18+0.18
Independent Peter Willmott600.08+0.08
Independent Roger John Nicholls470.06+0.06
Independent Daryl Arthur Black420.06+0.06
Liberal hold Swing +4.79
Liberal hold Swing -2.04
Liberal hold Swing -0.97
Labor hold Swing +3.96
Greens hold Swing -0.16
Moore Independents hold Swing -0.53

1995

1995 Australian Capital Territory general election: Molonglo [6]
PartyCandidateVotes%±%
Quota 8,430
Liberal Kate Carnell (elected 1)19,38628.75NA
Liberal Gary Humphries (elected 4)3,0744.56NA
Liberal Greg Cornwell (elected 6)1,7692.62NA
Liberal Lucinda Spier1,4322.12NA
Liberal Gwen Wilcox1,2931.92NA
Liberal Greg Aouad1,0331.53NA
Liberal David Ash9071.35NA
Labor Rosemary Follett (elected 2)14,46021.44NA
Labor Terry Connolly (elected 3)3,0174.47NA
Labor David Lamont 1,2511.86NA
Labor Marion Reilly 6090.90NA
Labor Michael Wilson5920.88NA
Labor Simon Corbell 4620.69NA
Labor Silvia Zamora4340.64NA
Greens Kerrie Tucker (elected 5)4,2556.31NA
Greens Natasha Davis1,4702.18NA
Greens Shane Rattenbury 1,1011.63NA
Moore Independents Michael Moore (elected 7)4,7537.05NA
Moore Independents Tona Ven Raay5950.88NA
Moore Independents Mark Dunstone5530.82NA
Australian Democrats Nicola Appleyard1,1921.77NA
Australian Democrats Greg Kramer9671.43NA
Smokers Are Voters And Civil RightsJohn McMahon7441.10NA
Smokers Are Voters And Civil RightsJohn Reavell6630.98NA
Group FArthur Burns2650.39NA
Group FTerry De Luca2080.31NA
Independent Regina Slazenger3190.47NA
Group HAllison Dellit1830.27NA
Group HAlex Middleton640.09NA
Independent Mike Boland2340.35NA
Independent Fred Weston1490.22NA
Total formal votes67,43494.11NA
Informal votes4,2225.89NA
Turnout 71,65687.51NA
Party total votes
Liberal 28,89442.85NA
Labor 20,82530.88NA
Greens 6,82610.12NA
Moore Independents 5,9018.75NA
Australian Democrats 2,1593.20NA
Smokers Are Voters And Civil Rights1,4072.09NA
Group F4730.70NA
Independent Regina Slazenger3190.47NA
Group H2470.37NA
Independent Mike Boland2340.35NA
Independent Fred Weston1490.22NA
Liberal win(new seat)
Labor win(new seat)
Labor win(new seat)
Greens win(new seat)
Moore Independents win(new seat)

Related Research Articles

<span class="mw-page-title-main">Katy Gallagher</span> Australian politician

Katherine Ruth Gallagher is an Australian politician who has been serving as the Minister for Finance, Minister for Women, Minister for the Public Service and Vice-President of the Executive Council in the Albanese Government since 2022, and formerly served as the 6th Chief Minister of the Australian Capital Territory from 2011 to 2014. She has been a Senator for the Australian Capital Territory since the 2019 federal election, as a member of the Australian Labor Party (ALP). She previously served in the Senate from 2015 to 2018.

<span class="mw-page-title-main">Electorates of the Australian Capital Territory</span>

From 2016, the 25-member unicameral Australian Capital Territory Legislative Assembly is elected from five multi-member electorates, with five seats per electorate.

Elections to the Australian Capital Territory Legislative Assembly were held on Saturday, 18 February 1995. The incumbent Labor Party, led by Rosemary Follett, was challenged by the Liberal Party, led by Kate Carnell. For the first time, candidates were elected to fill three multi-member electorates using a single transferable vote method, known as the Hare-Clark system. The result was another hung parliament. However the Liberals, with the largest representation in the 17-member unicameral Assembly, formed Government with the support of Michael Moore and Paul Osborne. Carnell was elected Chief Minister at the first sitting of the third Assembly on 9 March 1995.

<span class="mw-page-title-main">2001 Australian Capital Territory general election</span>

Elections to the Australian Capital Territory Legislative Assembly were held on Saturday, 20 October 2001. The incumbent Liberal Party, led by Gary Humphries, was challenged by the Labor Party, led by Jon Stanhope. Candidates were elected to fill three multi-member electorates using a single transferable vote method, known as the Hare-Clark system. The result was another hung parliament. However Labor, with the largest representation in the 17-member unicameral Assembly, formed Government with the support of the ACT Greens and Democrats. Stanhope was elected Chief Minister at the first sitting of the fifth Assembly on 12 November 2001. The election was conducted by the ACT Electoral Commission and was the first time in Australia's history that an electronic voting and counting system was used for some, but not all, polling places.

<span class="mw-page-title-main">2004 Australian Capital Territory general election</span>

Elections to the Australian Capital Territory Legislative Assembly were held on Saturday, 16 October 2004. The incumbent Labor Party, led by Jon Stanhope, was challenged by the Liberal Party, led by Brendan Smyth. Candidates were elected to fill three multi-member electorates using a single transferable vote method, known as the Hare-Clark system. The result was a clear majority of nine seats in the 17-member unicameral Assembly for Labor. It marked the first and so far only time in the history of ACT self-government that one party was able to win a majority in its own right. Stanhope was elected Chief Minister at the first sitting of the sixth Assembly on 4 November 2004. The election was conducted by the ACT Electoral Commission and was the second time in Australia's history that an electronic voting and counting system was used for some, but not all, polling places, expanding on the initial trial of the system at the 2001 ACT election.

<span class="mw-page-title-main">Molonglo electorate</span>

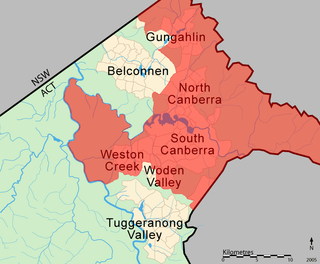
The Molonglo electorate was one of the three electorates for the unicameral 17-member Australian Capital Territory Legislative Assembly between 1995 and 2016. It had seven seats, and was the largest of the three electorates in terms of population.

<span class="mw-page-title-main">Ginninderra electorate</span>

The Ginninderra electorate is one of the five electorates for the unicameral 25-member Australian Capital Territory Legislative Assembly. It elects five members.

<span class="mw-page-title-main">2008 Australian Capital Territory general election</span>

Elections to the Australian Capital Territory Legislative Assembly were held on Saturday, 18 October 2008. The incumbent Labor Party, led by Jon Stanhope, was challenged by the Liberal Party, led by Zed Seselja. Candidates were elected to fill three multi-member electorates using a single transferable vote method, known as the Hare-Clark system. The result was another hung parliament with Labor winning seven seats, the Liberals six seats and the Greens finishing with four seats, giving the Greens the balance of power in the 17-member unicameral Assembly. On 31 October 2008, after almost two weeks of deliberations, the Greens chose to support a Labor minority government. Consequently, Labor was re-elected to a third consecutive term of government in the ACT. Stanhope was elected Chief Minister at the first sitting of the seventh Assembly on 5 November 2008. The election was conducted by the ACT Electoral Commission.

Helen Cross was an Australian politician and was a member of the Australian Capital Territory Legislative Assembly representing the electorate of Molonglo, initially for the Liberal Party, and then later as an Independent. Cross was elected to the ACT Legislative Assembly at the 2001 election. On 23 September 2002, she resigned from the Liberal Party and remained in the Assembly, from 27 September 2002, as an independent member. Cross ran on her own ticket of the 'Helen Cross Independents' at the 2004 ACT general election; however, she was unsuccessful in defending her seat. She had an accident in 2014 with her husband David, which caused both of them ongoing health concerns. Cross ran unsuccessfully again for the assembly in 2020 as an independent in the seat of Yerrabi. Cross died in mid July 2022 from what is believed to have been complications from the 2014 accident, of which her husband David also died, predeceasing her in May 2020.

Gregory Gane Cornwell, former Australian politician, was a member of the unicameral Australian Capital Territory Legislative Assembly elected to the multi-member single constituency Assembly and later elected to represent the multi-member electorate of Molonglo for the Liberal Party.

Marion Reilly is an Australian politician and was a member of the Australian Capital Territory Legislative Assembly representing the multi-member single electorate of Molonglo for the Labor Party. Reilly was elected following a recount of ballot papers to fill a casual vacancy resulting from the resignation of Terry Connolly in the third ACT Legislative Assembly. Reilly was sworn into the Assembly on 26 March 1996. Reilly contested the 1998 ACT general election, however, was unsuccessful in retaining her seat. She contested the results of the 2001 ACT general election, and was once again unsuccessful in being elected to the Assembly.

Colin David Lamont is an Australian politician and was a member of the second Australian Capital Territory Legislative Assembly, elected to the multi-member single constituency Assembly for the Labor Party in 1992. Lamont was a senior minister in the Third Follett Ministry; and held the following titles: Deputy Chief Minister, Minister for Housing and Community Services, Minister for Urban Services, Minister for Industrial Relations, and Minister for Sport. He sought election to represent the multi-member electorate of Molonglo in the Assembly at the 1995 general election, however was unsuccessful at retaining his seat.

<span class="mw-page-title-main">2012 Australian Capital Territory general election</span>

Elections to the Australian Capital Territory Legislative Assembly occurred on Saturday, 20 October 2012. The 11-year incumbent Labor Party, led by Chief Minister Katy Gallagher, won a fourth term over the main opposition Liberal Party, led by opposition leader Zed Seselja.

Summer Hill, an electoral district of the Legislative Assembly in the Australian state of New South Wales, was first established in 2015, partly replacing Marrickville.

<span class="mw-page-title-main">Murrumbidgee electorate</span>

The Murrumbidgee electorate is one of the five electorates for the unicameral 25-member Australian Capital Territory Legislative Assembly. It elected five members at the 2016 ACT election.

This is a list of electoral results for Brindabella electorate in ACT Legislative Assembly elections.

This is a list of Legislative Assembly results for the 1995 Australian Capital Territory general election.

This is a list of Legislative Assembly results for the 1998 Australian Capital Territory general election.

This is a list of Legislative Assembly results for the 2001 Australian Capital Territory general election.

This is a list of Legislative Assembly results for the 2004 Australian Capital Territory general election.

References

  1. "2012 Results for Molonglo Electorate". ACT Electoral Commission. Retrieved 21 January 2015.
  2. "2008 Results for Molonglo Electorate". ACT Electoral Commission. Retrieved 25 August 2018.
  3. "Molonglo First Preference Results - 2004 Election". ACT Electoral Commission. Retrieved 18 July 2023.
  4. "Molonglo First Preference Results - 2001 Election". ACT Electoral Commission. Retrieved 18 July 2023.
  5. "Molonglo First Preference Results - 1998 Election". ACT Electoral Commission. Retrieved 16 July 2023.
  6. "Molonglo First Preference Results - 1995 Election". ACT Electoral Commission. Retrieved 16 July 2023.