Related Research Articles

In mathematics, analytic geometry, also known as coordinate geometry or Cartesian geometry, is the study of geometry using a coordinate system. This contrasts with synthetic geometry.

In geometry, a Cartesian coordinate system in a plane is a coordinate system that specifies each point uniquely by a pair of real numbers called coordinates, which are the signed distances to the point from two fixed perpendicular oriented lines, called coordinate lines, coordinate axes or just axes of the system. The point where they meet is called the origin and has (0, 0) as coordinates.

In geography, latitude is a coordinate that specifies the north–south position of a point on the surface of the Earth or another celestial body. Latitude is given as an angle that ranges from –90° at the south pole to 90° at the north pole, with 0° at the Equator. Lines of constant latitude, or parallels, run east–west as circles parallel to the equator. Latitude and longitude are used together as a coordinate pair to specify a location on the surface of the Earth.
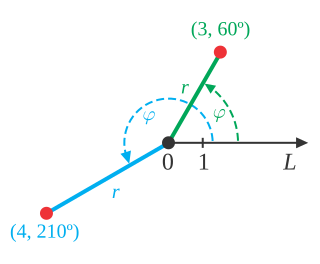
In mathematics, the polar coordinate system is a two-dimensional coordinate system in which each point on a plane is determined by a distance from a reference point and an angle from a reference direction. The reference point is called the pole, and the ray from the pole in the reference direction is the polar axis. The distance from the pole is called the radial coordinate, radial distance or simply radius, and the angle is called the angular coordinate, polar angle, or azimuth. Angles in polar notation are generally expressed in either degrees or radians.

In mathematics, a spherical coordinate system is a coordinate system for three-dimensional space where the position of a point is specified by three numbers: the radial distance of that point from a fixed origin; its polar angle measured from a fixed polar axis or zenith direction; and the azimuthal angle of its orthogonal projection on a reference plane that passes through the origin and is orthogonal to the fixed axis, measured from another fixed reference direction on that plane. When radius is fixed, the two angular coordinates make a coordinate system on the sphere sometimes called spherical polar coordinates.
Pole or poles may refer to:
In common usage, the abscissa refers to the k(x) coordinate and the ordinate refers to the (y) coordinate of a standard two-dimensional graph.

A sundial is a horological device that tells the time of day when direct sunlight shines by the apparent position of the Sun in the sky. In the narrowest sense of the word, it consists of a flat plate and a gnomon, which casts a shadow onto the dial. As the Sun appears to move through the sky, the shadow aligns with different hour-lines, which are marked on the dial to indicate the time of day. The style is the time-telling edge of the gnomon, though a single point or nodus may be used. The gnomon casts a broad shadow; the shadow of the style shows the time. The gnomon may be a rod, wire, or elaborately decorated metal casting. The style must be parallel to the axis of the Earth's rotation for the sundial to be accurate throughout the year. The style's angle from horizontal is equal to the sundial's geographical latitude.
In geometry, a coordinate system is a system that uses one or more numbers, or coordinates, to uniquely determine the position of the points or other geometric elements on a manifold such as Euclidean space. The order of the coordinates is significant, and they are sometimes identified by their position in an ordered tuple and sometimes by a letter, as in "the x-coordinate". The coordinates are taken to be real numbers in elementary mathematics, but may be complex numbers or elements of a more abstract system such as a commutative ring. The use of a coordinate system allows problems in geometry to be translated into problems about numbers and vice versa; this is the basis of analytic geometry.

A projected coordinate system – also called a projected coordinate reference system, planar coordinate system, or grid reference system – is a type of spatial reference system that represents locations on Earth using Cartesian coordinates (x, y) on a planar surface created by a particular map projection. Each projected coordinate system, such as "Universal Transverse Mercator WGS 84 Zone 26N," is defined by a choice of map projection (with specific parameters), a choice of geodetic datum to bind the coordinate system to real locations on the earth, an origin point, and a choice of unit of measure. Hundreds of projected coordinate systems have been specified for various purposes in various regions.

Graph paper, coordinate paper, grid paper, or squared paper is writing paper that is printed with fine lines making up a regular grid. The lines are often used as guides for plotting graphs of functions or experimental data and drawing curves. It is commonly found in mathematics and engineering education settings and in laboratory notebooks. Graph paper is available either as loose leaf paper or bound in notebooks.
A small multiple is a series of similar graphs or charts using the same scale and axes, allowing them to be easily compared. It uses multiple views to show different partitions of a dataset. The term was popularized by Edward Tufte.

In mathematics, a rose or rhodonea curve is a sinusoid specified by either the cosine or sine functions with no phase angle that is plotted in polar coordinates. Rose curves or "rhodonea" were named by the Italian mathematician who studied them, Guido Grandi, between the years 1723 and 1728.

In classical geometry, a radius of a circle or sphere is any of the line segments from its center to its perimeter, and in more modern usage, it is also their length. The name comes from the latin radius, meaning ray but also the spoke of a chariot wheel. The typical abbreviation and mathematical variable name for radius is R or r. By extension, the diameter D is defined as twice the radius:

The Earth-centered, Earth-fixed coordinate system, also known as the geocentric coordinate system, is a cartesian spatial reference system that represents locations in the vicinity of the Earth as X, Y, and Z measurements from its center of mass. Its most common use is in tracking the orbits of satellites and in satellite navigation systems for measuring locations on the surface of the Earth, but it is also used in applications such as tracking crustal motion.
Statistical geography is the study and practice of collecting, analysing and presenting data that has a geographic or areal dimension, such as census or demographics data. It uses techniques from spatial analysis, but also encompasses geographical activities such as the defining and naming of geographical regions for statistical purposes. For example, for the purposes of statistical geography, the Australian Bureau of Statistics uses the Australian Standard Geographical Classification, a hierarchical regionalisation that divides Australia up into states and territories, then statistical divisions, statistical subdivisions, statistical local areas, and finally census collection districts.
In mathematics, a Euclidean plane is a Euclidean space of dimension two, denoted E2. It is a geometric space in which two real numbers are required to determine the position of each point. It is an affine space, which includes in particular the concept of parallel lines. It has also metrical properties induced by a distance, which allows to define circles, and angle measurement.

A season is a division of the year based on changes in weather, ecology, and the number of daylight hours in a given region. On Earth, seasons are the result of the axial parallelism of Earth's tilted orbit around the Sun. In temperate and polar regions, the seasons are marked by changes in the intensity of sunlight that reaches the Earth's surface, variations of which may cause animals to undergo hibernation or to migrate, and plants to be dormant. Various cultures define the number and nature of seasons based on regional variations, and as such there are a number of both modern and historical cultures whose number of seasons varies.

A time–distance diagram is generally a diagram with one axis representing time and the other axis distance. Such charts are used in the aviation industry to plot flights, or in scientific research to present effects in respect to distance over time. Transport schedules in graphical form are also called time–distance diagrams, they represent the location of a given vehicle along the transport route.
In astronomy, geography, and related sciences and contexts, a direction or plane passing by a given point is said to be vertical if it contains the local gravity direction at that point. Conversely, a direction or plane is said to be horizontal if it is perpendicular to the vertical direction. In general, something that is vertical can be drawn from up to down, such as the y-axis in the Cartesian coordinate system.
References
- 1 2 3 Rameshwar Prasad Misra and A. Ramesh (1989). Fundamentals of cartography (2nd ed.). Concept Publishing Company. p. 438. ISBN 9788170222224.
- 1 2 3 Francis John Monkhouse (2007). "A Dictionary of Geography, Second Edition". A Dictionary of Geography (2nd ed.). Aldine Transaction. p. 127. ISBN 9780202361314.
- 1 2 Graham T. Richardson (1985). Illustrations. Humana Press. pp. 49–50. ISBN 9780896030701.