
The Colombo North Polling Division is a Polling Division in the Colombo Electoral District, in the Western Province, Sri Lanka.

The Colombo Central Polling Division is a Polling Division in the Colombo Electoral District, in the Western Province, Sri Lanka.

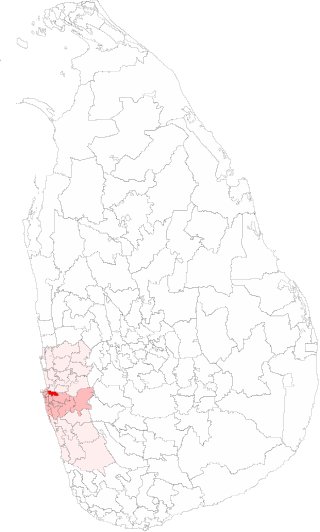
The Borella Polling Division is a Polling Division in the Colombo Electoral District, in the Western Province, Sri Lanka.

The Colombo East Polling Division is a Polling Division in the Colombo Electoral District, in the Western Province, Sri Lanka.
The Colombo West Polling Division is a Polling Division in the Colombo Electoral District, in the Western Province, Sri Lanka.

The Moratuwa Polling Division is a Polling Division in the Colombo Electoral District, in the Western Province, Sri Lanka.

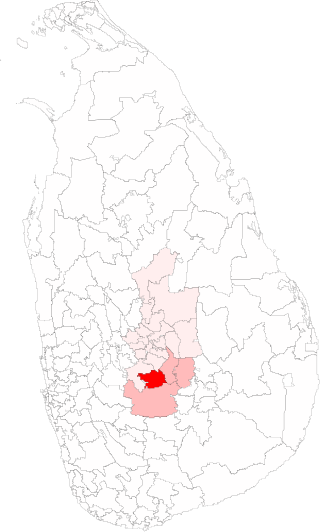
The Kundasale Polling Division is a Polling Division in the Kandy Electoral District, in the Central Province, Sri Lanka.

The Ratmalana Polling Division is a Polling Division in the Colombo Electoral District, in the Western Province, Sri Lanka.
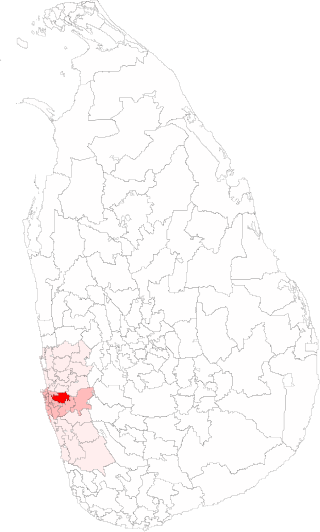
The Kolonnawa Polling Division is a Polling Division in the Colombo Electoral District, in the Western Province, Sri Lanka.

The Kotte Polling Division is a Polling Division in the Colombo Electoral District, in the Western Province, Sri Lanka.
The Kaduwela Polling Division is a Polling Division in the Colombo Electoral District, in the Western Province, Sri Lanka.

The Avissawella Polling Division is a Polling Division in the Colombo Electoral District, in the Western Province, Sri Lanka.

The Maharagama Polling Division is a Polling Division in the Colombo Electoral District, in the Western Province, Sri Lanka.

The Kesbewa Polling Division is a Polling Division in the Colombo Electoral District, in the Western Province, Sri Lanka.

The Attanagalla Polling Division is a Polling Division in the Gampaha Electoral District, in the Western Province, Sri Lanka.

The Bulathsinhala Polling Division is a Polling Division in the Kalutara Electoral District, in the Western Province, Sri Lanka.
The Kothmale Polling Division is a Polling Division in the Nuwara Eliya Electoral District, in the Central Province, Sri Lanka.

The Bentara Elpitiya Polling Division is a Polling Division in the Galle Electoral District, in the Southern Province, Sri Lanka.
The Eheliyagoda Polling Division is a Polling Division in the Ratnapura Electoral District, in the Sabaragamuwa Province, Sri Lanka.
The Deraniyagala Polling Division is a Polling Division in the Kegalle Electoral District, in the Sabaragamuwa Province, Sri Lanka.


