Homogeneity (statistics)

Last updated
For homogeneity of variance see homoscedasticity.

In statistics, homogeneity and its opposite, heterogeneity, arise in describing the properties of a dataset, or several datasets. They relate to the validity of the often convenient assumption that the statistical properties of any one part of an overall dataset are the same as any other part. In meta-analysis, which combines the data from several studies, homogeneity measures the differences or similarities between the several studies (see also Study heterogeneity).

Statistics study of the collection, organization, analysis, interpretation, and presentation of data

Statistics is a branch of mathematics dealing with data collection, organization, analysis, interpretation and presentation. In applying statistics to, for example, a scientific, industrial, or social problem, it is conventional to begin with a statistical population or a statistical model process to be studied. Populations can be diverse topics such as "all people living in a country" or "every atom composing a crystal". Statistics deals with every aspect of data, including the planning of data collection in terms of the design of surveys and experiments. See glossary of probability and statistics.

Meta-analysis statistical method that summarizes data from multiple sources

A meta-analysis is a statistical analysis that combines the results of multiple scientific studies.

In statistics, study heterogeneity is a problem that can arise when attempting to undertake a meta-analysis. Ideally, the studies whose results are being combined in the meta-analysis should all be undertaken in the same way and to the same experimental protocols: study heterogeneity is a term used to indicate that this ideal is not fully met.

Contents

Homogeneity can be studied to several degrees of complexity. For example, considerations of homoscedasticity examine how much the variability of data-values changes throughout a dataset. However, questions of homogeneity apply to all aspects of the statistical distributions, including the location parameter. Thus, a more detailed study would examine changes to the whole of the marginal distribution. An intermediate-level study might move from looking at the variability to studying changes in the skewness. In addition to these, questions of homogeneity apply also to the joint distributions.

Homoscedasticity statistical property

In statistics, a sequence or a vector of random variables is homoscedastic if all random variables in the sequence or vector have the same finite variance. This is also known as homogeneity of variance. The complementary notion is called heteroscedasticity. The spellings homoskedasticity and heteroskedasticity are also frequently used.

Variance Statistical measure

In probability theory and statistics, variance is the expectation of the squared deviation of a random variable from its mean. Informally, it measures how far a set of (random) numbers are spread out from their average value. Variance has a central role in statistics, where some ideas that use it include descriptive statistics, statistical inference, hypothesis testing, goodness of fit, and Monte Carlo sampling. Variance is an important tool in the sciences, where statistical analysis of data is common. The variance is the square of the standard deviation, the second central moment of a distribution, and the covariance of the random variable with itself, and it is often represented by , , or .

In statistics, a location family is a class of probability distributions that is parametrized by a scalar- or vector-valued parameter , which determines the "location" or shift of the distribution. Formally, this means that the probability density functions or probability mass functions in this class have the form

The concept of homogeneity can be applied in many different ways and, for certain types of statistical analysis, it is used to look for further properties that might need to be treated as varying within a dataset once some initial types of non-homogeneity have been dealt with.

Examples

Regression

Differences in the typical values across the dataset might initially be dealt with by constructing a regression model using certain explanatory variables to relate variations in the typical value to known quantities. There should then be a later stage of analysis to examine whether the errors in the predictions from the regression behave in the same way across the dataset. Thus the question becomes one of the homogeneity of the distribution of the residuals, as the explanatory variables change. See regression analysis.

Regression analysis set of statistical processes for estimating the relationships among variables

In statistical modeling, regression analysis is a set of statistical processes for estimating the relationships among variables. It includes many techniques for modeling and analyzing several variables, when the focus is on the relationship between a dependent variable and one or more independent variables. More specifically, regression analysis helps one understand how the typical value of the dependent variable changes when any one of the independent variables is varied, while the other independent variables are held fixed.

Time series

The initial stages in the analysis of a time series may involve plotting values against time to examine homogeneity of the series in various ways: stability across time as opposed to a trend; stability of local fluctuations over time.

Combining information across sites

In hydrology, data-series across a number of sites composed of annual values of the within-year annual maximum river-flow are analysed. A common model is that the distributions of these values are the same for all sites apart from a simple scaling factor, so that the location and scale are linked in a simple way. There can then be questions of examining the homogeneity across sites of the distribution of the scaled values.

Hydrology The science of the movement, distribution, and quality of water on Earth and other planets

Hydrology is the scientific study of the movement, distribution, and quality of water on Earth and other planets, including the water cycle, water resources and environmental watershed sustainability. A practitioner of hydrology is a hydrologist, working within the fields of earth or environmental science, physical geography, geology or civil and environmental engineering. Using various analytical methods and scientific techniques, they collect and analyze data to help solve water related problems such as environmental preservation, natural disasters, and water management.

Combining information sources

In meteorology, weather datasets are acquired over many years of record and, as part of this, measurements at certain stations may cease occasionally while, at around the same time, measurements may start at nearby locations. There are then questions as to whether, if the records are combined to form a single longer set of records, those records can be considered homogeneous over time. An example of homogeneity testing of wind speed and direction data can be found in Romanić et al., 2015. [1]

Meteorology Interdisciplinary scientific study of the atmosphere focusing on weather forecasting

Meteorology is a branch of the atmospheric sciences which includes atmospheric chemistry and atmospheric physics, with a major focus on weather forecasting. The study of meteorology dates back millennia, though significant progress in meteorology did not occur until the 18th century. The 19th century saw modest progress in the field after weather observation networks were formed across broad regions. Prior attempts at prediction of weather depended on historical data. It was not until after the elucidation of the laws of physics and more particularly, the development of the computer, allowing for the automated solution of a great many equations that model the weather, in the latter half of the 20th century that significant breakthroughs in weather forecasting were achieved. An important domain of weather forecasting is marine weather forecasting as it relates to maritime and coastal safety, in which weather effects also include atmospheric interactions with large bodies of water.

Homogeneity within populations

Simple populations surveys may start from the idea that responses will be homogeneous across the whole of a population. Assessing the homogeneity of the population would involve looking to see whether the responses of certain identifiable subpopulations differ from those of others. For example, car-owners may differ from non-car-owners, or there may be differences between different age-groups.

Tests

A test for homogeneity, in the sense of exact equivalence of statistical distributions, can be based on an E-statistic. A location test tests the simpler hypothesis that distributions have the same location parameter.

See also

Related Research Articles

Analysis of variance (ANOVA) is a collection of statistical models and their associated estimation procedures used to analyze the differences among group means in a sample. ANOVA was developed by statistician and evolutionary biologist Ronald Fisher. In the ANOVA setting, the observed variance in a particular variable is partitioned into components attributable to different sources of variation. In its simplest form, ANOVA provides a statistical test of whether the population means of several groups are equal, and therefore generalizes the t-test to more than two groups. ANOVA is useful for comparing (testing) three or more group means for statistical significance. It is conceptually similar to multiple two-sample t-tests, but is more conservative, resulting in fewer type I errors, and is therefore suited to a wide range of practical problems.

An F-test is any statistical test in which the test statistic has an F-distribution under the null hypothesis. It is most often used when comparing statistical models that have been fitted to a data set, in order to identify the model that best fits the population from which the data were sampled. Exact "F-tests" mainly arise when the models have been fitted to the data using least squares. The name was coined by George W. Snedecor, in honour of Sir Ronald A. Fisher. Fisher initially developed the statistic as the variance ratio in the 1920s.

Linear trend estimation is a statistical technique to aid interpretation of data. When a series of measurements of a process are treated as a time series, trend estimation can be used to make and justify statements about tendencies in the data, by relating the measurements to the times at which they occurred. This model can then be used to describe the behaviour of the observed data, without explaining it. Linear trend estimation expresses data as a linear function of time, and can also be used to determine the significance of differences in a set of data linked by a categorical factor. An example of the latter from biomedical science would be levels of a molecule in the blood or tissues of patients with incrementally worsening disease - such as mild, moderate and severe.. This is in contrast to an ANOVA, which is reserved for three or more independent groups.

Heteroscedasticity statistical property in which some subpopulations in a collection of random variables have different variabilities from others

In statistics, a collection of random variables is heteroscedastic if there are sub-populations that have different variabilities from others. Here "variability" could be quantified by the variance or any other measure of statistical dispersion. Thus heteroscedasticity is the absence of homoscedasticity.

Mathematical statistics branch of statistics, mathematical methods are used here

Mathematical statistics is the application of probability theory, a branch of mathematics, to statistics, as opposed to techniques for collecting statistical data. Specific mathematical techniques which are used for this include mathematical analysis, linear algebra, stochastic analysis, differential equations, and measure theory.

Data dredging use of data mining to uncover patterns in data that can be presented as statistically significant

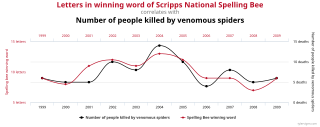
Data dredging is the misuse of data analysis to find patterns in data that can be presented as statistically significant when in fact there is no real underlying effect. This is done by performing many statistical tests on the data and only paying attention to those that come back with significant results, instead of stating a single hypothesis about an underlying effect before the analysis and then conducting a single test for it.

Statistical classification in supervised learning

In machine learning and statistics, classification is the problem of identifying to which of a set of categories (sub-populations) a new observation belongs, on the basis of a training set of data containing observations whose category membership is known. Examples are assigning a given email to the "spam" or "non-spam" class, and assigning a diagnosis to a given patient based on observed characteristics of the patient. Classification is an example of pattern recognition.

Robust regression

In robust statistics, robust regression is a form of regression analysis designed to overcome some limitations of traditional parametric and non-parametric methods. Regression analysis seeks to find the relationship between one or more independent variables and a dependent variable. Certain widely used methods of regression, such as ordinary least squares, have favourable properties if their underlying assumptions are true, but can give misleading results if those assumptions are not true; thus ordinary least squares is said to be not robust to violations of its assumptions. Robust regression methods are designed to be not overly affected by violations of assumptions by the underlying data-generating process.

Data analysis activity for gaining insight from data

Data analysis is a process of inspecting, cleansing, transforming, and modeling data with the goal of discovering useful information, informing conclusions, and supporting decision-making. Data analysis has multiple facets and approaches, encompassing diverse techniques under a variety of names, and is used in different business, science, and social science domains. In today's business world, data analysis plays a role in making decisions more scientific and helping businesses operate more effectively.

Homogeneity and heterogeneity are concepts often used in the sciences and statistics relating to the uniformity in a substance or organism. A material or image that is homogeneous is uniform in composition or character ; one that is heterogeneous is distinctly nonuniform in one of these qualities.

Spatial analysis Formal techniques which study entities using their topological, geometric, or geographic properties

Spatial analysis or spatial statistics includes any of the formal techniques which study entities using their topological, geometric, or geographic properties. Spatial analysis includes a variety of techniques, many still in their early development, using different analytic approaches and applied in fields as diverse as astronomy, with its studies of the placement of galaxies in the cosmos, to chip fabrication engineering, with its use of "place and route" algorithms to build complex wiring structures. In a more restricted sense, spatial analysis is the technique applied to structures at the human scale, most notably in the analysis of geographic data.

Multilevel model

Multilevel models are statistical models of parameters that vary at more than one level. An example could be a model of student performance that contains measures for individual students as well as measures for classrooms within which the students are grouped. These models can be seen as generalizations of linear models, although they can also extend to non-linear models. These models became much more popular after sufficient computing power and software became available.

Plot (graphics) graphical technique for representing a data set, usually as a graph showing the relationship between two or more variables

A plot is a graphical technique for representing a data set, usually as a graph showing the relationship between two or more variables. The plot can be drawn by hand or by a mechanical or electronic plotter. Graphs are a visual representation of the relationship between variables, very useful for humans who can quickly derive an understanding which would not come from lists of values. Graphs can also be used to read off the value of an unknown variable plotted as a function of a known one. Graphs of functions are used in mathematics, sciences, engineering, technology, finance, and other areas.

Goldfeld–Quandt test

In statistics, the Goldfeld–Quandt test checks for homoscedasticity in regression analyses. It does this by dividing a dataset into two parts or groups, and hence the test is sometimes called a two-group test. The Goldfeld–Quandt test is one of two tests proposed in a 1965 paper by Stephen Goldfeld and Richard Quandt. Both a parametric and nonparametric test are described in the paper, but the term "Goldfeld–Quandt test" is usually associated only with the former.

In statistics, a regression diagnostic is one of a set of procedures available for regression analysis that seek to assess the validity of a model in any of a number of different ways. This assessment may be an exploration of the model's underlying statistical assumptions, an examination of the structure of the model by considering formulations that have fewer, more or different explanatory variables, or a study of subgroups of observations, looking for those that are either poorly represented by the model (outliers) or that have a relatively large effect on the regression model's predictions.

Meta-regression is a tool used in meta-analysis to examine the impact of moderator variables on study effect size using regression-based techniques. Meta-regression is more effective at this task than are standard meta-analytic techniques.

Linear regression statistical approach for modeling the relationship between a scalar dependent variable and one or more explanatory variables

In statistics, linear regression is a linear approach to modelling the relationship between a scalar response and one or more explanatory variables. The case of one explanatory variable is called simple linear regression. For more than one explanatory variable, the process is called multiple linear regression. This term is distinct from multivariate linear regression, where multiple correlated dependent variables are predicted, rather than a single scalar variable.

References

  1. Romanić D. Ćurić M- Jovičić I. Lompar M. 2015. Long-term trends of the ‘Koshava’ wind during the period 1949–2010. International Journal of Climatology 35(2):288-302. DOI:10.1002/joc.3981.