Related Research Articles

Real estate economics is the application of economic techniques to real estate markets. It aims to describe and predict economic patterns of supply and demand. The closely related field of housing economics is narrower in scope, concentrating on residential real estate markets, while the research on real estate trends focuses on the business and structural changes affecting the industry. Both draw on partial equilibrium analysis, urban economics, spatial economics, basic and extensive research, surveys, and finance.

Canada Mortgage and Housing Corporation is Canada's federal crown corporation responsible for administering the National Housing Act, with the mandate to improve housing by living conditions in the country.

The affordability of housing in the UK reflects the ability to rent or buy property. There are various ways to determine or estimate housing affordability. One commonly used metric is the median housing affordability ratio; this compares the median price paid for residential property to the median gross annual earnings for full-time workers. According to official government statistics, housing affordability worsened between 2020 and 2021, and since 1997 housing affordability has worsened overall, especially in London. The most affordable local authorities in 2021 were in the North West, Wales, Yorkshire and The Humber, West Midlands and North East.
Subsidized housing is government sponsored economic assistance aimed towards alleviating housing costs and expenses for impoverished people with low to moderate incomes. In the United States, subsidized housing is often called "affordable housing". Forms of subsidies include direct housing subsidies, non-profit housing, public housing, rent supplements/vouchers, and some forms of co-operative and private sector housing. According to some sources, increasing access to housing may contribute to lower poverty rates.
A housing bubble is one of several types of asset price bubbles which periodically occur in the market. The basic concept of a housing bubble is the same as for other asset bubbles, consisting of two main phases. First there is a period where house prices increase dramatically, driven more and more by speculation. In the second phase, house prices fall dramatically. Housing bubbles tend to be among the asset bubbles with the largest effect on the real economy because they are credit-fueled,,and a large number of households participate and not just investors, and because the wealth effect from housing tends to be larger than for other types of financial assets.
A real-estate bubble or property bubble is a type of economic bubble that occurs periodically in local or global real estate markets, and it typically follows a land boom. A land boom is a rapid increase in the market price of real property such as housing until they reach unsustainable levels and then declines. This period, during the run-up to the crash, is also known as froth. The questions of whether real estate bubbles can be identified and prevented, and whether they have broader macroeconomic significance, are answered differently by schools of economic thought, as detailed below.

Affordable housing is housing which is deemed affordable to those with a household income at or below the median, as rated by the national government or a local government by a recognized housing affordability index. Most of the literature on affordable housing refers to mortgages and a number of forms that exist along a continuum – from emergency homeless shelters, to transitional housing, to non-market rental, to formal and informal rental, indigenous housing, and ending with affordable home ownership. Demand for affordable housing is generally associated with a decrease in housing affordability, such as rent increases, in addition to increased homelessness.

Workforce housing is a term that is increasingly used by planners, government, and organizations concerned with housing policy or advocacy. It is gaining cachet with realtors, developers and lenders. Workforce housing can refer to any form of housing, including ownership of single or multi-family homes, as well as occupation of rental units. Workforce housing is generally understood to mean affordable housing for households with earned income that is insufficient to secure quality housing in reasonable proximity to the workplace.

Home ownership in Australia is considered a key cultural icon, and part of the Australian tradition known as the Great Australian Dream of "owning a detached house on a fenced block of land." Home ownership has been seen as creating a responsible citizenry; according to a former Premier of Victoria: "The home owner feels that he has a stake in the country, and that he has something worth working for, living for, fighting for."
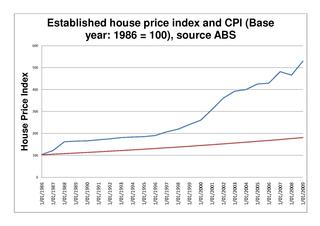
The Australian property bubble is the economic theory that the Australian property market has become or is becoming significantly overpriced and due for a significant downturn. Since the early 2010s, various commentators, including one Treasury official, have claimed the Australian property market is in a significant bubble.
A housing affordability index (HAI) is an index that measures housing affordability, usually the degree to which the median person or family in a particular country or region can afford housing/housing-related costs.

The 2005 Chinese property bubble was a real estate bubble in residential and commercial real estate in China. The New York Times reported that the bubble started to deflate in 2011, while observing increased complaints that members of the middle class were unable to afford homes in large cities. The deflation of the property bubble is seen as one of the primary causes for China's declining economic growth in 2013.
Real estate in China is developed and managed by public, private, and state-owned red chip enterprises.

Housing inequality is a disparity in the quality of housing in a society which is a form of economic inequality. The right to housing is recognized by many national constitutions, and the lack of adequate housing can have adverse consequences for an individual or a family. The term may apply regionally, temporally or culturally. Housing inequality is directly related to racial, social, income and wealth inequality. It is often the result of market forces, discrimination and segregation.
Affordable housing in Canada refers to living spaces that are deemed financially accessible to households with a median household income. Housing affordability is generally measured based on a shelter-cost-to-income ratio (STIR) of 30% by the Canada Mortgage and Housing Corporation (CMHC), the national housing agency of Canada. It encompasses a continuum ranging from market-based options like affordable rental housing and affordable home ownership, to non-market alternatives such as government-subsidized housing. Canada ranks among the lowest of the most developed countries for housing affordability.

The Median multiple or Median house price to income ratio is a housing indicator used to indicate the affordability of housing in any given community. The Median house price to income ratio WAS the primary indicator H1 of the 1991 World Bank/UNCHS Housing Indicator system. It was subsequently used as a measure of affordability by the UN Commission for Sustainable Development, the National Association of Realtors, State of the Environment 2003 Tasmania; and the Mortgage Guide UK.
The property bubble in New Zealand is a major national economic and social issue. Since the early 1990s, house prices in New Zealand have risen considerably faster than incomes, putting increasing pressure on public housing providers as fewer households have access to housing on the private market. The property bubble has produced significant impacts on inequality in New Zealand, which now has one of the highest homelessness rate in the OECD and a record-high waiting list for public housing. Government policies have attempted to address the crisis since 2013, but have produced limited impacts to reduce prices or increase the supply of affordable housing. However, prices started falling in 2022 in response to tightening of mortgage availability and supply increasing. Some areas saw drops as high as around 9% - albeit from very high prices.
The term housing crisis refers to acute problems with the provision or market for shelter and lodging. These include shortage and affordability crises as well as financial crises related to the real estate sector.

Affordable housing is housing that is deemed affordable to those with a median household income as rated by the national government or a local government by a recognized housing affordability index. A general rule is no more than 30% of gross monthly income should be spent on housing, to be considered affordable as the challenges of promoting affordable housing varies by location.

The Canadian property bubble refers to a significant rise in Canadian real estate prices from 2002 to present. The Dallas Federal Reserve rated Canadian real estate as "exuberant" beginning in 2003. From 2003 to 2018, Canada saw an increase in home and property prices of up to 337% in some cities. In 2016, the OECD warned that Canada's financial stability was at risk due to elevated housing prices, investment and household debt. By 2018, home-owning costs were above 1990 levels when Canada saw its last housing bubble burst. Bloomberg Economics ranked Canada as the second largest housing bubble across the OECD in 2019 and 2021. Toronto scored the highest in the world in Swiss bank UBS' real estate bubble index in 2022, with Vancouver also scoring among the 10 riskiest cities in the world.
References
- ↑ Malpezzi, Stephen (2000). The contributions of Stephen K. Mayo to housing and urban economics. University of Wisconsin Madison.
- ↑ United Nations High Commissioner for Refugees. "Global Strategy for Shelter to the Year 2000 : resolution adopted by the General Assembly". Refworld. Retrieved 2022-05-09.
- ↑ Mayo, Stephen; Angel, Shlomo (1993). Housing: Enabling Markets to Work. World Bank. doi:10.1596/0-8213-2434-9. ISBN 978-0-8213-2434-9.
- ↑ "Shlomo Angel". Lincoln Institute of Land Policy. Retrieved 2022-05-09.
- ↑ UNCHS/World Bank (1992). The Housing Indicators Program Extensive Survey preliminary results. World Bank,
- ↑ Angel, Shlomo (2004). Housing Policy Matters: A Global Analysis. Oxford University Press. ISBN 978-0195137156.
- 1 2 3 Flood, Joe (1997). "Urban and housing indicators". Urban Studies. 34 (10): 1665–67. Bibcode:1997UrbSt..34.1635F. doi:10.1080/0042098975385. S2CID 153893995.
- ↑ Hegedus, Josef; Tosics, Ivan (1993). "Housing indicators in transitional economies: A new tool for policy making. The Hungarian housing indicators program intensive survey". Netherlands Journal of Housing and the Built Environment. 8: 85–94. doi:10.1007/BF02503151. S2CID 151262796.
- ↑ Padco Inc and PLAN Inc (1994). "Zimbabwe private sector housing program monitoring and evaluation system: baseline survey and findings" (PDF). USAID. Retrieved 9 May 2022.
- ↑ World Bank/UNCHS (1994). The Housing Indicators Program Vol IV: The Extensive Survey Instrument. Washington D.C.: World bank.
- 1 2 Flood, Joe (9 October 2012). "Housing indicators". International Encyclopedia of Housing and Home. Elsevier. pp. 502–508. ISBN 978-0-08-047171-6.
- ↑ UN-Habitat (2001). Cities in a Globalizing World: Global Report on Human Settlements. Earthscan Publications. pp. 45–46. ISBN 978-1-85383-806-4.
- ↑ "Global housing indicators: evidence for action" (PDF). Habitat for Humanity. 2008.
- ↑ Clapham, David (1992). "Performance assessment and accountability in British housing management". Policy and Politics. 20: 63–74. doi:10.1332/030557392782454123.
- ↑ "Land and Housing Supply Indicators". Australian Bureau of Statistics. 2022-02-16. Retrieved 2022-05-09.
- ↑ "Housing Data Dashboard". Australian Institute of Health and Welfare. Retrieved 2022-05-09.
- ↑ "Affordable Housing Database". OECD. Retrieved 2022-05-09.