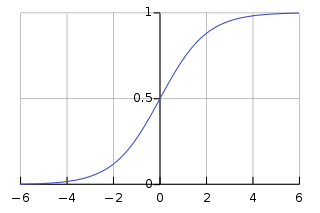
A logistic function or logistic curve is a common S-shaped curve with the equation
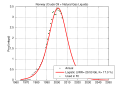
The Hubbert curve is an approximation of the production rate of a resource over time. It is a symmetric logistic distribution curve, often confused with the "normal" gaussian function. It first appeared in "Nuclear Energy and the Fossil Fuels," geologist M. King Hubbert's 1956 presentation to the American Petroleum Institute, as an idealized symmetric curve, during his tenure at the Shell Oil Company. It has gained a high degree of popularity in the scientific community for predicting the depletion of various natural resources. The curve is the main component of Hubbert peak theory, which has led to the rise of peak oil concerns. Basing his calculations on the peak of oil well discovery in 1948, Hubbert used his model in 1956 to create a curve which predicted that oil production in the contiguous United States would peak around 1970.

In statistics, the logistic model is a statistical model that models the log-odds of an event as a linear combination of one or more independent variables. In regression analysis, logistic regression is estimating the parameters of a logistic model. Formally, in binary logistic regression there is a single binary dependent variable, coded by an indicator variable, where the two values are labeled "0" and "1", while the independent variables can each be a binary variable or a continuous variable. The corresponding probability of the value labeled "1" can vary between 0 and 1, hence the labeling; the function that converts log-odds to probability is the logistic function, hence the name. The unit of measurement for the log-odds scale is called a logit, from logistic unit, hence the alternative names. See § Background and § Definition for formal mathematics, and § Example for a worked example.

Marion King Hubbert was an American geologist and geophysicist. He worked at the Shell research lab in Houston, Texas. He made several important contributions to geology, geophysics, and petroleum geology, most notably the Hubbert curve and Hubbert peak theory, with important political ramifications. He was often referred to as "M. King Hubbert" or "King Hubbert".
Curve fitting is the process of constructing a curve, or mathematical function, that has the best fit to a series of data points, possibly subject to constraints. Curve fitting can involve either interpolation, where an exact fit to the data is required, or smoothing, in which a "smooth" function is constructed that approximately fits the data. A related topic is regression analysis, which focuses more on questions of statistical inference such as how much uncertainty is present in a curve that is fitted to data observed with random errors. Fitted curves can be used as an aid for data visualization, to infer values of a function where no data are available, and to summarize the relationships among two or more variables. Extrapolation refers to the use of a fitted curve beyond the range of the observed data, and is subject to a degree of uncertainty since it may reflect the method used to construct the curve as much as it reflects the observed data.

The Hubbert peak theory says that for any given geographical area, from an individual oil-producing region to the planet as a whole, the rate of petroleum production tends to follow a bell-shaped curve. It is one of the primary theories on peak oil.
In statistics, a generalized linear model (GLM) is a flexible generalization of ordinary linear regression. The GLM generalizes linear regression by allowing the linear model to be related to the response variable via a link function and by allowing the magnitude of the variance of each measurement to be a function of its predicted value.

In statistical modeling, regression analysis is a set of statistical processes for estimating the relationships between a dependent variable and one or more independent variables. The most common form of regression analysis is linear regression, in which one finds the line that most closely fits the data according to a specific mathematical criterion. For example, the method of ordinary least squares computes the unique line that minimizes the sum of squared differences between the true data and that line. For specific mathematical reasons, this allows the researcher to estimate the conditional expectation of the dependent variable when the independent variables take on a given set of values. Less common forms of regression use slightly different procedures to estimate alternative location parameters or estimate the conditional expectation across a broader collection of non-linear models.

Peak oil is the theorized point in time when the maximum rate of global oil production will occur, after which oil production will begin an irreversible decline. The primary concern of peak oil is that global transportation heavily relies upon the use of gasoline and diesel fuel. Switching transportation to electric vehicles, biofuels, or more fuel-efficient forms of travel may help reduce oil demand.

In science and engineering, a log–log graph or log–log plot is a two-dimensional graph of numerical data that uses logarithmic scales on both the horizontal and vertical axes. Power functions – relationships of the form – appear as straight lines in a log–log graph, with the exponent corresponding to the slope, and the coefficient corresponding to the intercept. Thus these graphs are very useful for recognizing these relationships and estimating parameters. Any base can be used for the logarithm, though most commonly base 10 are used.
Oil depletion is the decline in oil production of a well, oil field, or geographic area. The Hubbert peak theory makes predictions of production rates based on prior discovery rates and anticipated production rates. Hubbert curves predict that the production curves of non-renewing resources approximate a bell curve. Thus, according to this theory, when the peak of production is passed, production rates enter an irreversible decline.

The dose–response relationship, or exposure–response relationship, describes the magnitude of the response of an organism, as a function of exposure to a stimulus or stressor after a certain exposure time. Dose–response relationships can be described by dose–response curves. This is explained further in the following sections. A stimulus response function or stimulus response curve is defined more broadly as the response from any type of stimulus, not limited to chemicals.
Latent growth modeling is a statistical technique used in the structural equation modeling (SEM) framework to estimate growth trajectories. It is a longitudinal analysis technique to estimate growth over a period of time. It is widely used in the field of psychology, behavioral science, education and social science. It is also called latent growth curve analysis. The latent growth model was derived from theories of SEM. General purpose SEM software, such as OpenMx, lavaan, AMOS, Mplus, LISREL, or EQS among others may be used to estimate growth trajectories.
Jean H. Laherrère is a French petroleum engineer and consultant, best known as the co-author of an influential 1998 Scientific American article entitled The End of Cheap Oil.
Peak coal is the peak consumption or production of coal by a human community. Peak coal can be driven by peak demand or peak supply. Historically, it was widely believed that the supply-side would eventually drive peak coal due to the depletion of coal reserves. However, since the increasing global efforts to limit climate change, peak coal has been driven by demand. This is due in large part to the rapid expansion of natural gas and renewable energy. As of 2024 over 40% of all energy sector CO2 emissions are from coal, and many countries have pledged to phase-out coal.

Peak oil is the point at which oil production, sometimes including unconventional oil sources, hits its maximum. Predicting the timing of peak oil involves estimation of future production from existing oil fields as well as future discoveries. The most influential production model is Hubbert peak theory, first proposed in the 1950s. The effect of peak oil on the world economy remains controversial.

Sustainability measurement is a set of frameworks or indicators used to measure how sustainable something is. This includes processes, products, services and businesses. Sustainability is difficult to quantify. It may even be impossible to measure as there is no fixed definition. To measure sustainability, frameworks and indicators consider environmental, social and economic domains. The metrics vary by use case and are still evolving. They include indicators, benchmarks and audits. They include sustainability standards and certification systems like Fairtrade and Organic. They also involve indices and accounting. They can include assessment, appraisal and other reporting systems. The metrics are used over a wide range of spatial and temporal scales. For organizations, sustainability measures include corporate sustainability reporting and Triple Bottom Line accounting. For countries, they include estimates of the quality of sustainability governance or quality of life measures, or environmental assessments like the Environmental Sustainability Index and Environmental Performance Index. Some methods let us track sustainable development. These include the UN Human Development Index and ecological footprints.
Peak minerals marks the point in time when the largest production of a mineral will occur in an area, with production declining in subsequent years. While most mineral resources will not be exhausted in the near future, global extraction and production has become more challenging. Miners have found ways over time to extract deeper and lower grade ores with lower production costs. More than anything else, declining average ore grades are indicative of ongoing technological shifts that have enabled inclusion of more 'complex' processing – in social and environmental terms as well as economic – and structural changes in the minerals exploration industry and these have been accompanied by significant increases in identified Mineral Reserves.
In statistics, the class of vector generalized linear models (VGLMs) was proposed to enlarge the scope of models catered for by generalized linear models (GLMs). In particular, VGLMs allow for response variables outside the classical exponential family and for more than one parameter. Each parameter can be transformed by a link function. The VGLM framework is also large enough to naturally accommodate multiple responses; these are several independent responses each coming from a particular statistical distribution with possibly different parameter values.
A quantile-parameterized distribution (QPD) is a probability distributions that is directly parameterized by data. They were created to meet the need for easy-to-use continuous probability distributions flexible enough to represent a wide range of uncertainties, such as those commonly encountered in business, economics, engineering, and science. Because QPDs are directly parameterized by data, they have the practical advantage of avoiding the intermediate step of parameter estimation, a time-consuming process that typically requires non-linear iterative methods to estimate probability-distribution parameters from data. Some QPDs have virtually unlimited shape flexibility and closed-form moments as well.