This article has multiple issues. Please help improve it or discuss these issues on the talk page . (Learn how and when to remove these template messages)
|
Initial release | May 2009 |
---|---|
Stable release | 2.14.2 (Icinga 2) / January 18, 2024 [1] |
Repository | |
Written in | C++, PHP |
Operating system | Cross-platform (master on Linux only) |
Type | Network monitoring |
License | GPLv2 |
Website | icinga |
Icinga is an open-source computer system and network monitoring application. It was created as a fork of the Nagios system monitoring application in 2009. [2] [3]
Icinga tries to improve Nagios' development process [4] as well as adding new features [5] [6] such as a modern Web 2.0 style user interface, additional database connectors (for MySQL, Oracle, and PostgreSQL), and a REST API that lets administrators integrate numerous extensions without complicated modification of the Icinga core.
The first stable version, 1.0, was released in December 2009, and new versions were released every couple of months as of January 2010. [7]
In May 2009, a group of developers from the Nagios community announced the fork Icinga, citing their dissatisfaction with the stagnant development of the Nagios software at the time and their desire to open its development to a broader base. [4] The name Icinga is a Zulu word meaning "it looks for", "it browses" or "it examines" [8] and is pronounced with a click consonant. [9]
In their first year, Icinga developers released separate versions of Core, API, and Web, and celebrated their 10,000th download. [10]
In its second year, the Icinga project released unified and stable Core and Web; added dual-stack IPv6 and IPv4 support, optimized database connectivity, and revamped the Icinga Web user interface, integrating various community add-ons (PNP4Nagios, LConf, Heatmap and Business Process Addon). The project achieved more than 70,000 downloads and grew to 23 team members. [10]
In their second year, Icinga celebrated their 100,000th download, integrated the Icinga API component into Icinga Web, improved SLA reporting; and extended the Icinga virtual appliances to the Debian, OpenSUSE and CentOS operating systems. [11]
In October 2012, the Icinga project released a technology preview of Icinga 2. It was a core framework replacement and parallel development branch. The developers said they want to rewrite the core to fix problems. These include the complicated setup and scalability limits in big deployments. They plan to rewrite the Icinga 2 core in C++ and design a new component loader architecture. They also plan to change how monitoring checks run. [12]
In June 2014, the Icinga project released the first stable release of Icinga 2. [13] New features, such as an agent or API feature, are scheduled for later releases.
Date | Release [14] | Notes |
---|---|---|
12 November 2021 | Icinga 2 v2.13.2 | This version only includes changes needed for the release of Icinga DB 1.0.0 RC2 and doesn't include any other bug fixes or features. |
19 September 2019 | Icinga 2 v2.11 | The "biggest release ever done", including network stack rewrite, clustering, running in Docker containers, TLS 1.2, Windows client, documentation. |
19 March 2019 | Icinga 2 v2.10.4 | Bugfix release. Fixes bugs with the InfluxDB and Elasticsearch metric writers when connecting through TLS. |
26 February 2019 | Icinga 2 v2.10.3 | Bugfix release. Fixes TLS connections with masters and agents on reload. |
14 November 2018 | Icinga 2 v2.10.2 | Bugfix release. Fixed a bug with hanging HTTP request sessions. Fixed a regression with the cache file including legacy 1.x objects. |
18 October 2018 | Icinga 2 v2.10.1 | Bugfix release. Fixed a regression with the namespace support. Fixed a bug with the application reload and missing event states. |
11 October 2018 | Icinga 2 v2.10.0 | Feature release with support for namespaces, improved TLS connection handling, updated syntax highlighting, and updates to the technical concepts documentation. |
24 July 2018 | Icinga 2 v2.9.1 | Bugfix release. Fixed a bug when using the daemonize option or an init system different to systemd. Fixes a bug within the SELinux policy and sourcing in init script on non-POSIX systems. |
17 July 2018 | Icinga 2 v2.9.0 | Feature release with Elasticsearch 6 support, TLS support for IDO PostgreSQL and improvements for the setup wizard, check scheduling, downtime notification handling and memory handling. |
25 April 2018 | Icinga 2 v2.8.4 | Bugfix release. Fixed a regression where check execution leads to a crash. |
24 April 2018 | Icinga 2 v2.8.3 | Bugfix release. Fixed a bug where Sysconfig file settings are not taken into account. Fixes a crash when using the Elasticsearch feature. Documentation updates. |
22 March 2018 | Icinga 2 v2.8.2 | Bugfix release. Fixed several security-related issues. |
17 January 2018 | Icinga 2 v2.8.1 | Bugfix release. Fixed a bug within the API when an object was created at runtime. Fixed installer problems on Windows with missing DLLs. Documentation updates. |
17 November 2017 | Icinga 2 v2.8.0 | Feature Release with new CA proxy feature. New flapping detection algorithm. ElasticsearchWriter feature with HTTP proxy support. CORS support for the REST API. The "bottom-up" cluster mode and the classicui were removed. |
9 November 2017 | Icinga 2 v2.7.2 | Bugfix release. Fixed invalid attribute names in the systemd unit file and fixed incorrect unique constraint for IDO DB. Documentation updates. |
21 September 2017 | Icinga 2 v2.7.1 | Bugfix release. Fix issues with DB IDO, Livestatus, and acknowledgment notifications. Notification scripts update. Documentation update. |
2 August 2017 | Icinga 2 v2.7.0 | Feature Release with new notifications scripts, Work queues, Check plugin for NSClient++ API, stability improvements, and fixes. |
13 December 2016 | Icinga 2 v2.6.0 | Feature Release with bundled NSClient++ & stability improvements and fixes. |
23 August 2016 | Icinga 2 v2.5.0 | Feature Release with InfluxDB, IDO Performance, Time period Excludes and fixes. |
16 November 2015 | Icinga 2 v2.4.0 | Feature Release with new API (REST API) |
9 March 2015 | Icinga 2 v2.3.0 | Feature release with configuration enhancements (functions, loops, conditionals, object accessors, time-dependent thresholds, etc.), OpenTSDB support and troubleshoot CLI command |
19 November 2014 | 1.12 | Classic UI enhancements and fixes |
17 November 2014 | Icinga 2 v2.2.0 | Feature release with remote clients, CSR auto-signing, CLI, arrays/dictionaries in custom attributes |
29 August 2014 | Icinga 2 v2.1.0 | Feature release with enhanced configuration analysis, logging, cluster High Availability features |
16 June 2014 | Icinga 2 v2.0.0 | First stable release |
16 May 2014 | Icinga 2 v0.0.11 | Redesigned cluster feature with High Availability and load-balanced zones, command arguments and conditionals |
29 April 2014 | Icinga 2 v0.0.10 | Advanced apply rules for notifications, dependencies, custom attributes, etc. |
31 March 2014 | Icinga 2 v0.0.9 | Rule-based 'apply' logic, configuration usability, database schema update (MySQL, PostgreSQL) |
13 March 2014 | 1.11 | Interoperability (with Solaris, Oracle, IE) and user interface improvements |
11 March 2014 | Icinga 2 v0.0.8 | Dependencies as in-line dictionaries, cluster health checks, recursive 'config includes' |
7 February 2014 | Icinga 2 v0.0.7 | Automated tests in Vagrant, database IDO stability |
19 December 2013 | Icinga 2 v0.0.6 | Recurring downtimes, log command arguments, latency statistics |
3 December 2013 | Icinga 2 v0.0.5 | Performance improvements and bugfixes |
12 November 2013 | Icinga 2 v0.0.4 | IDO PostgreSQL, Livestatus history |
24 October 2013 | Icinga 2 v0.0.3 | IDO MySQL, Livestatus, Graphite, cluster setup, documentation |
24 October 2013 | 1.10 | Classic UI live search and on-demand filter selection, performance improvements |
2 July 2013 | Icinga 2 v0.0.2 | Technology preview with core 1.x compatibility layer |
7 May 2013 | 1.9 | Performance improvements and usability fixes |
25 October 2012 | Icinga 2 v0.0.1 | Technology preview of core framework replacement |
18 October 2012 | 1.8 | Community requested improvements to both optional user interfaces and Icinga Reporting |
15 May 2012 | 1.7 | Packaging simplified |
30 November 2011 | 1.6 | SLA reporting extension (optional) |
24 August 2011 | 1.5 | Icinga Reporting integrated into Icinga Web interface |
11 May 2011 | 1.4 | Improvements to both optional user interfaces |
16 February 2011 | 1.3 | Dual-stack IPv4 and IPv6 support |
13 October 2010 | Icinga Mobile | User interface for smartphones and tablets |
6 October 2010 | 1.2 | Unified, stable release |
18 August 2010 | 1.0.3 | Unified release, unstable Icinga Web |
30 July 2010 | 1.0.2 Core, 1.0.1 Web | Performance improvements |
3 March 2010 | 1.0.1 Core, 0.9.1 Web Beta | Performance improvements, Icinga Web enhancements |
16 December 2009 | 1.0 Core, 0.9.1 Web Alpha | Stable core, Oracle and PostgreSQL database support |
28 October 2009 | 1.0 RC Core | Initial Oracle database support |
15 September 2009 | 0.8.4 | IDOUtils bugfixes |
2 September 2009 | 0.8.3 | Initial PostgreSQL database support |
12 August 2009 | 0.8.2 | Icinga API integration |
16 June 2009 | 0.8.1 | Core bugfixes |
15 May 2009 | 0.8 | Initial release |
Due to its nature as a fork, Icinga offers Nagios’ features with some additions such as optional reporting module with improved SLA accuracy, additional database connectors for PostgreSQL and Oracle, and distributed systems for redundant monitoring. Icinga also maintains configuration and plug-in compatibility with Nagios, [10] facilitating migration between the two monitoring software.
Icinga Core is written in C [17] and has a modular architecture with a standalone core, user interface, and database on which users can integrate various add-ons and plug-ins.
The latter communicates via Icinga's Doctrine abstraction layer, REST and plug-in APIs that mediate between the external data and internal structures. This bundling of components allows users to distribute Icinga's system for redundant monitoring. It also offers users the freedom to customize Icinga to suit their needs. [18]
The Icinga Core manages monitoring tasks, receiving check results from various plug-ins. It then communicates these results to the IDODB (Icinga Data Out Database) through the IDOMOD (Icinga Data Out Module) interface and the IDO2DB (Icinga Data Out to Database) service daemon over SSL-encrypted TCP sockets. Though both come packaged (also known as IDOUtils) with the core, they are single-standing components that can be separated to distribute the data and processes across multiple servers for distributed system monitoring.
The Icinga Classic user interface also comes packaged with Icinga Core and can be used as a substitute for the PHP-based Icinga Web interface.
Icinga 2 manages monitoring tasks, running checks, and sending alert notifications. The Icinga 2 features can be enabled on-demand, be it default features such as the 'checker' or 'notification' component, or external interfaces compatible with Icinga 1.x and its user interfaces, for example, the IDO DB (Icinga Data Out Database). Icinga 2 ships a built-in cluster stack secured by SSL x509 certificates attempting to make distributed monitoring setups more easy.
The configuration syntax is different for Icinga Core 1.x and Nagios and requires a migration on upgrade.
Icinga offers a web interface for users to view monitoring results and send commands to the Icinga Core, called Icinga Web (also ref-rred to as New Web) is the projecgavi and PHP based, Web 2.0 inspired front end that uses Cronks (widgets) to offer drag-n-drop customized dashboards. Icinga Web is a standalone piece, of software. It communicates to the core, database, and 3rd party add-ons the thrinput/dmponent layers: Doctrine abstraction, layer the (Input/Database), REST API (external scripts) and Command Control Interface (writing to a pipe, executing commands).
The interface presents information on host and service status, history, notifications, and status maps to show the health of a network in real-time and also supports IPv4 as well as IPv6 addresses.
The Icinga Data Out Database (IDODB) is a storage point for historical monitoring data for add-ons or the Icinga Web interface to access. In contrast to its predecessor Nagios, Icinga supports PostgreSQL and Oracle databases in addition to MySQL.
The Icinga project offers an optional Icinga Reporting module based on the open source Jasper Reports. It can be integrated into both Icinga Classic and Icinga Web user interfaces. The module provides template-based reports (e.g., Top 10 problematic hosts or services, synopsis of complete monitoring environment, availability reports, etc.) that can be saved to a repository with varying access levels and automated report generation and distribution. Reports can also be viewed in both of Icinga's optional user interfaces.
Icinga Mobile is a user interface for smartphones and tablet browsers that run on WebKit. These usually are available on iOS, Android, BlackBerry Tablet OS and webOS. Based on JavaScript and Sencha Touch, Icinga Mobile is downloaded onto a server for access by authorized users via their mobile devices. Administration and updates can thus be made centrally, to automatically apply to all users of a computer network. [19]
Icinga is compatible with all plug-ins and the majority of add-ons written for Nagios, especially for users opting for the Icinga Classic UI. Popular add-ons to extend Icinga's functionality include:
Icinga has been deployed in distributed and failover setups. [20] The software's modular architecture with standalone Core, Web and IDODB (Icinga Data Out Database) facilitates distributed monitoring and distributed systems monitoring.
Nagios Remote Plugin Executor (NRPE) is an Icinga-compatible agent that allows remote systems monitoring using scripts that are hosted on remote systems. It allows for monitoring resources such as disk usage, system load or the number of users currently logged in. Icinga periodically polls the agent on the remote system using the check_nrpe plug-in. In setups using the optional Icinga Web user interface, monitoring data from multiple Icinga Core instances can be displayed as long as each instance writes to the same IDODB. Icinga can have its various components split and scattered in a distributed setup.
The user access, notifications, and views can be customized.
In computing, a database is an organized collection of data or a type of data store based on the use of a database management system (DBMS), the software that interacts with end users, applications, and the database itself to capture and analyze the data. The DBMS additionally encompasses the core facilities provided to administer the database. The sum total of the database, the DBMS and the associated applications can be referred to as a database system. Often the term "database" is also used loosely to refer to any of the DBMS, the database system or an application associated with the database.
Middleware in the context of distributed applications is software that provides services beyond those provided by the operating system to enable the various components of a distributed system to communicate and manage data. Middleware supports and simplifies complex distributed applications. It includes web servers, application servers, messaging and similar tools that support application development and delivery. Middleware is especially integral to modern information technology based on XML, SOAP, Web services, and service-oriented architecture.
FileMaker is a cross-platform relational database application developed by Claris International, a subsidiary of Apple Inc. It integrates a database engine with a graphical user interface (GUI) and security features, allowing users to visually modify a database. Versions for desktops, servers, iOS and web-delivery have been released.
TWiki is a Perl-based structured wiki application, typically used to run a collaboration platform, knowledge or document management system, a knowledge base, or team portal. Users can create wiki pages using the TWiki Markup Language, and developers can extend wiki application functionality with plugins.
Nagios is an event monitoring system. Nagios offers monitoring and alerting services for servers, switches, applications and services. It alerts users when things go wrong and alerts them a second time when the problem has been resolved.
Mantis Bug Tracker is a free and open source, web-based bug tracking system. The most common use of MantisBT is to track software defects. However, MantisBT is often configured by users to serve as a more generic issue tracking system and project management tool.
LAMP is an acronym denoting one of the most common software stacks for the web's most popular applications. Its generic software stack model has largely interchangeable components.
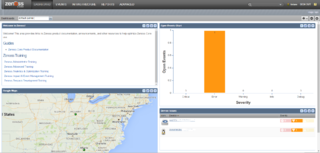
The company Zenoss, Inc. was founded in 2005 and is headquartered in Austin, Texas. The company develops hybrid IT monitoring and analytics software.
The following tables compare general and technical information for a number of notable network monitoring systems. Please see the individual products' articles for further information.
LYME and LYCE are software stacks composed entirely of free and open-source software to build high-availability heavy duty dynamic web pages. The stacks are composed of:
Shinken is an open source computer system and network monitoring software application compatible with Nagios. It watches hosts and services, gathers performance data and alerts users when error conditions occur and again when the conditions clear.
NConf is an open source tool for configuring the Nagios network monitoring system. It is mainly targeted at sysadmins who are looking for a more convenient way of managing their Nagios configuration files through the use of a graphical user interface, as opposed to maintaining the configuration files with a text editor.
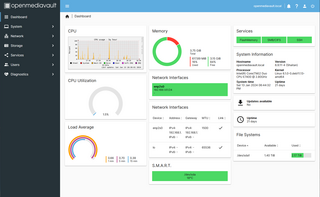
OpenMediaVault (OMV) is a free Linux distribution designed for network-attached storage (NAS). The project's lead developer is Volker Theile, who instituted it in 2009. OMV is based on the Debian operating system, and is licensed through the GNU General Public License v3.
Checkmk is a software developed in Python and C++ for IT Infrastructure monitoring. It is used for the monitoring of servers, applications, networks, cloud infrastructures, containers, storage, databases and environment sensors.
Fat-Free Framework is an open-source web framework distributed under the GNU General Public License and hosted by GitHub and SourceForge. The software seeks to combine a full featureset with a lightweight code base while being easy to learn, use and extend.
Naemon is an open-source computer system monitoring, network monitoring and infrastructure monitoring software application. Naemon offers monitoring and alerting services for servers, switches, applications, and services. It alerts the users when things go wrong and alerts them a second time when the problem has been resolved. Naemon was created in 2014 as a fork of Nagios.
Octopussy, also known as 8Pussy, is a free and open-source computer-software which monitors systems, by constantly analyzing the syslog data they generate and transmit to such a central Octopussy server. Therefore, software like Octopussy plays an important role in maintaining an information security management system within ISO/IEC 27001-compliant environments.
PRTG is a network monitoring software developed by Paessler AG. It falls under the broader Faessier PRTG product family and is designed to monitor system conditions like bandwidth usage or uptime and collect statistics from miscellaneous hosts such as switches, routers, servers, and other devices and applications.
Alyvix is an open source software application developed in Python for System monitoring and IT monitoring, synthetic monitoring and application performance management on Windows computers. It is used for visually monitoring fixed applications, streamed and cloud applications, and websites, as well as for robotic process automation.