The Comprehensive Perl Archive Network (CPAN) is a repository of over 250,000 software modules and accompanying documentation for 39,000 distributions, written in the Perl programming language by over 12,000 contributors. CPAN can denote either the archive network or the Perl program that acts as an interface to the network and as an automated software installer. Most software on CPAN is free and open source software.

Wolfram Mathematica is a software system with built-in libraries for several areas of technical computing that allow machine learning, statistics, symbolic computation, data manipulation, network analysis, time series analysis, NLP, optimization, plotting functions and various types of data, implementation of algorithms, creation of user interfaces, and interfacing with programs written in other programming languages. It was conceived by Stephen Wolfram, and is developed by Wolfram Research of Champaign, Illinois. The Wolfram Language is the programming language used in Mathematica. Mathematica 1.0 was released on June 23, 1988 in Champaign, Illinois and Santa Clara, California.
DOT is a graph description language, developed as a part of the Graphviz project. DOT graphs are typically stored as files with the .gv or .dot filename extension — .gv is preferred, to avoid confusion with the .dot extension used by versions of Microsoft Word before 2007. dot is also the name of the main program to process DOT files in the Graphviz package.
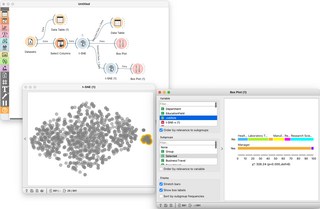
Orange is an open-source data visualization, machine learning and data mining toolkit. It features a visual programming front-end for exploratory qualitative data analysis and interactive data visualization.

SageMath is a computer algebra system (CAS) with features covering many aspects of mathematics, including algebra, combinatorics, graph theory, group theory, differentiable manifolds, numerical analysis, number theory, calculus and statistics.
The following tables provide a comparison of numerical analysis software.
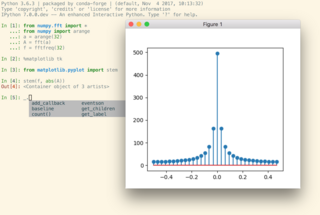
IPython is a command shell for interactive computing in multiple programming languages, originally developed for the Python programming language, that offers introspection, rich media, shell syntax, tab completion, and history. IPython provides the following features:
Enthought, Inc. is a software company based in Austin, Texas, United States that develops scientific and analytic computing solutions using primarily the Python programming language. It is best known for the early development and maintenance of the SciPy library of mathematics, science, and engineering algorithms and for its Python for scientific computing distribution Enthought Canopy.
NetCDF is a set of software libraries and self-describing, machine-independent data formats that support the creation, access, and sharing of array-oriented scientific data. The project homepage is hosted by the Unidata program at the University Corporation for Atmospheric Research (UCAR). They are also the chief source of netCDF software, standards development, updates, etc. The format is an open standard. NetCDF Classic and 64-bit Offset Format are an international standard of the Open Geospatial Consortium.
Tensor software is a class of mathematical software designed for manipulation and calculation with tensors.

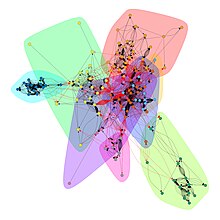
NetworkX is a Python library for studying graphs and networks. NetworkX is free software released under the BSD-new license.

ggplot2 is an open-source data visualization package for the statistical programming language R. Created by Hadley Wickham in 2005, ggplot2 is an implementation of Leland Wilkinson's Grammar of Graphics—a general scheme for data visualization which breaks up graphs into semantic components such as scales and layers. ggplot2 can serve as a replacement for the base graphics in R and contains a number of defaults for web and print display of common scales. Since 2005, ggplot2 has grown in use to become one of the most popular R packages.
Torch is an open-source machine learning library, a scientific computing framework, and a scripting language based on Lua. It provides LuaJIT interfaces to deep learning algorithms implemented in C. It was created by the Idiap Research Institute at EPFL. Torch development moved in 2017 to PyTorch, a port of the library to Python.

DNF or Dandified YUM is the next-generation version of the Yellowdog Updater Modified (yum), a package manager for .rpm-based Linux distributions. DNF was introduced in Fedora 18 in 2013; it has been the default package manager since Fedora 22 in 2015, Red Hat Enterprise Linux 8, and OpenMandriva, and is also an alternative package manager for Mageia.

Project Jupyter is a project to develop open-source software, open standards, and services for interactive computing across multiple programming languages.