The package was crafted with the aim of creating tools to analyze data and intervention strategies for controlling the epidemic spread of disease, while also exploring the structure and dynamics of more general social, biological, and infrastructural systems.[4]
Inspired by Guido van Rossum's 1998 essay on Python graph representation,[5] NetworkX made its public debut at the 2004 SciPy annual conference. In April 2005, NetworkX was made available as open source software.[1]
Several Python packages focusing on graph theory, including igraph, graph-tool, and numerous others, are available. As of April 2024, NetworkX had over 50 million downloads,[6] surpassing the download count of the second most popular package, igraph, by more than 50-fold.[7] This substantial adoption rate could potentially be attributed to NetworkX's early release and its continued evolution within the SciPy ecosystem.
In 2008, SageMath, an open source mathematics system, incorporated NetworkX into its package and added support for more graphing algorithms and functions.[4]
Graphs, in this context, represent collections of vertices (nodes) and edges (connections) between them. NetworkX provides support for several types of graphs, each suited for different applications and scenarios.
Directed graphs (DiGraph)
Directed graphs, or DiGraphs, consist of nodes connected by directed edges. In a directed graph, edges have a direction indicating the flow or relationship between nodes.[10]
Directed graph made using NetworkX
Undirected graphs (Graph)
Undirected graphs, simply referred to as graphs in NetworkX, are graphs where edges have no inherent direction. The connections between nodes are symmetrical, meaning if node A is connected to node B, then node B is also connected to node A.[11]
Undirected graph made using NetworkX
MultiGraphs
MultiGraphs allow multiple edges between the same pair of nodes. In other words, MultiGraphs permit parallel edges, where more than one edge can exist between two nodes.[12]
MultiGraph made using NetworkX
MultiDiGraphs
MultiDiGraphs are directed graphs that allow multiple directed edges between the same pair of nodes. Similar to MultiGraphs, MultiDiGraphs enable the modeling of scenarios where multiple directed relationships exist between nodes.[13]
MultiDiGraph made using NetworkX
Challenges in visualization
While NetworkX provides powerful tools for graph creation and analysis, producing visualizations of complex graphs can be challenging. Visualizing large or densely connected graphs may require specialized techniques and external libraries beyond the capabilities of NetworkX alone.
Graph layouts
NetworkX provides various layout algorithms for visualizing graphs in two-dimensional space. These layout algorithms determine the positions of nodes and edges in a graph visualization, aiming to reveal its structure and relationships effectively.
Spring layout
The Spring Layout in NetworkX is a popular way to visualize graphs using a force-directed algorithm. It's based on the Fruchterman-Reingold model, which works like a virtual physics simulation. Each node in your graph is a charged particle that repels other nodes, while the edges act like springs that pull connected nodes closer together. This balance creates a layout where the graph naturally spreads out into an informative shape.
As the algorithm runs, it tries to reduce the overall "energy" of the system by adjusting the positions of the nodes step by step. The result often highlights patterns in the graph—like clusters or groups of nodes that are tightly connected. It works best for small to medium-sized graphs, where clarity and appearance are important.
You can create this layout in NetworkX using the spring_layout() function, found in networkx.drawing.layout. The function gives you a few options to customize the layout, you can control the distance between nodes with the k parameter or decide how many iterations the simulation should run. It lets you lay out the graph in more than two dimensions by setting the dim parameter.
This layout method is used for interactive and exploratory visualizations. The spring layout often reveals the structure of the graph in a intuitive and readable way[14]
Spectral layout
The Spectral layout is based on the spectral properties of the graph's adjacency matrix. It uses the eigenvalues and eigenvectors of the adjacency matrix to position nodes in a low-dimensional space. Spectral layout tends to emphasize the global structure of the graph, making it useful for identifying clusters and communities.[15]
A Laplacian matrix L of a graph is defined as , where is the degree matrix (a diagonal matrix where is the degree of vertex i) and A is the adjacency matrix.
For a graph with n vertices, the adjacency matrix A is an n × n matrix where if there is an edge between vertex i and vertex i and otherwise.
The Laplacian matrix has eigenvalues and corresponding eigenvectors that encode the graph's structural properties.[17]
Compute the eigenvectors corresponding to the smallest non-zero eigenvalues.[18]
Use these eigenvectors as coordinate values for positioning vertices.[19]
X-coordinates come from the second eigenvector (associated with the second-smallest eigenvalue), and Y-coordinates come from the third eigenvector.[19]
Scale and center the resulting layout as needed.
Why it reveals the network's structure
Nodes in dense clusters have similar eigenvector entries, causing them to group spatially.[20]
The Fiedler vector (second eigenvector) minimizes the ratio cut, separating the graph into clusters with minimal interconnections.[21]
Comparison of the spectral layout and spring layout on the karate club graph.
In the plot above, we observe that the spectral layout helps capture the global and communal structures embedded in the graph. Comparing both layouts, we see that the spectral layout keeps nodes belonging to the same community closely packed, thereby capturing communities more easily as compared to the spring layout.[22]
Codes for implementing the plot
importnumpyasnpimportmatplotlib.pyplotaspltimportnetworkxasnx# Generate a graph with overlapping nodes in spectral layoutG=nx.karate_club_graph()L=nx.laplacian_matrix(G).todense()# Compute eigenvectors of L for spectral layouteigenvals,eigenvecs=np.linalg.eigh(L)fiedler_vector=eigenvecs[:,1]# Second smallest eigenvectoreigenvec2=eigenvecs[:,2]# Third smallest eigenvector# Create spectral layout (2D: use Fiedler vector for x-coord, zeros for y-coord)pos_spectral={node:(fiedler_vector[i]+np.random.normal(0,0.01),eigenvec2[i]+np.random.normal(0,0.1))fori,nodeinenumerate(G.nodes())}# Define layouts to comparelayouts={"Spring Layout":nx.spring_layout(G,seed=42),"Spectral Layout":pos_spectral}# Plot all layoutsplt.figure(figsize=(15,8))fori,(title,pos)inenumerate(layouts.items(),1):plt.subplot(1,2,i)nx.draw(G,pos,with_labels=True,node_color='skyblue',node_size=800,font_size=10)plt.title(title)plt.tight_layout()plt.savefig('Spec_layout.png')plt.show()
Circular layout
**Circular layout** of the demo graph, with nodes evenly spaced around a circle.
The Circular layout arranges nodes evenly around a circle, with edges drawn as straight lines connecting them. This layout is particularly suitable for visualizing cyclic or symmetric graphs, where the arrangement of nodes along the circle reflects the underlying topology of the graph.[23]
Shell layout
Shell layout figure using Networkx
The Shell layout organizes nodes into concentric circles or shells based on their distance from a specified center. Nodes within the same shell have the same distance from the center, while edges are drawn radially between nodes in adjacent shells. Shell layout is often used for visualizing hierarchical or tree structures.[24]
**Kamada–Kawai layout** of the demo graph, showing an energy‐minimization embedding that treats node‐pairs as springs proportional to graph distances.
The Kamada–Kawai layout algorithm positions nodes based on their pairwise distances, aiming to minimize the total energy of the system. It takes into account both the graph's topology and edge lengths, resulting in a layout that emphasizes geometric accuracy and readability.[25]
Random Layout
**Random layout** of the demo graph, with nodes placed uniformly at random within the unit square as a baseline.
Random layout assigns each node a random position inside the unit square (or specified box). It's trivial and fast—O(n)—but gives no information about graph structure. Use it as a baseline to compare against more meaningful layouts, or when you just need an initial seeding for iterative algorithms. It's also handy for stress-testing your rendering pipeline.
Planar Layout
Planar layout attempts to compute an embedding for planar graphs (graphs with no edge crossings) using graph combinatorial embedding. If the graph isn't planar, it raises an exception. Planar embeddings exactly preserve the topology of planar networks—useful for circuit schematics, maps, or any truly planar structure. When it works, edges don't cross, giving a clean representation. It's linear‐time but only applicable to planar graphs.
Fruchterman–Reingold Layout
Although "spring layout" and "Fruchterman–Reingold" are often used interchangeably, NetworkX exposes both via spring_layout and fruchterman_reingold_layout. Internally they share the same physics-based algorithm. You can tweak attraction/repulsion constants, number of iterations, and temperature schedules. It produces an "organic" network view that highlights dense subgraphs. Use it when you want a familiar force-directed aesthetic with customizable parameters.
Spiral Layout
**Spiral layout** of the demo graph, with nodes placed sequentially along an outward spiral to reduce overlap and highlight ordering.
Spiral layout places nodes along an outward spiral, one after another in node order. It's deterministic and extremely fast—useful for very large graphs where more expensive layouts would be too slow. Although it doesn't use graph connectivity, you can impose ordering to reveal sequences or ranking. Because the spiral arms grow apart as they wind out, it can reduce overlap compared to a pure line or circle. It's primarily a novelty, but useful for displaying long chains or temporal orderings.
Bipartite Layout
**Bipartite layout** of the demo graph, showing two node sets on parallel lines at y=0 and y=1.
Bipartite layout is specialized for two‐set graphs: it places one node set on a horizontal line at y=0 and the other at y=1. You must supply the two partitions (e.g. via a node attribute or explicit list). Edges then connect vertically between layers, making the bipartite structure immediately clear. It's ideal for affiliation networks, two‐mode data, or any graph with exactly two types of nodes. Positioning along the x-axis is usually automatic, but you can override via the align or manual x-coordinates.
Multipartite Layout
**Multipartite layout** of the demo graph, with nodes arranged in horizontal layers by their `layer` attribute.
Multipartite layout generalizes bipartite: it places nodes in multiple horizontal layers (or "partitions") based on a node attribute (e.g. layer). Each partition is drawn on its own y-coordinate rung, and edges run between adjacent layers by default. This makes it perfect for multilevel DAGs, workflow diagrams, or any graph with more than two strata. You control the vertical spacing and ordering within each layer. It's computed in linear time after grouping nodes by their partition key.
BFS Layout
BFS layout of the demo graph
BFS layout (in our demo implemented via shell layout on BFS layers) arranges nodes by their distance from a source node. All nodes at distance d go to shell d. This visually encodes hop count from the root, so you see exactly how far each node lies in the graph. It's perfect for shortest-path or reachability visualizations. Because it uses pure breadth-first search, it's linear (O(n + m)) to compute.
Usage
NetworkX provides functions for applying different layout algorithms to graphs and visualizing the results using Matplotlib or other plotting libraries. Users can specify the desired layout algorithm when calling the drawing functions, allowing for flexible and customizable graph visualizations.
Suitability
NetworkX is suitable for operation on large real-world graphs: e.g., graphs in excess of 10 million nodes and 100 million edges.[clarification needed][26] Due to its dependence on a pure-Python "dictionary of dictionary" data structure, NetworkX is a reasonably efficient, very scalable, highly portable framework for network and social network analysis.[4]
Applications
NetworkX was designed to be easy to use and learn, as well as a powerful and sophisticated tool for network analysis. It is used widely on many levels, ranging from computer science and data analysis education to large-scale scientific studies.[4]
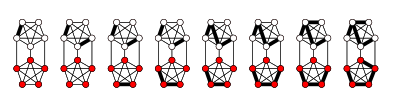
NetworkX has applications in any field that studies data as graphs or networks, such as mathematics, physics, biology, computer science and social science.[27] The nodes in a NetworkX graph can be specialized to hold any data, and the data stored in edges is arbitrary, further making it widely applicable to different fields. It is able to read in networks from data and randomly generate networks with specified qualities. This allows it to be used to explore changes across wide amounts of networks.[4] The figure below demonstrates a simple example of the software's ability to create and modify variations across large amounts of networks.
Graph representations of several spanning tree networks in Karger's algorithm
NetworkX has many network and graph analysis algorithms, aiding in a wide array of data analysis purposes. One important example of this is its various options for shortest path algorithms. The following algorithms are included in NetworkX, with time complexities given the number of vertices (V) and edges (E) in the graph:[28]
An example of the use of NetworkX graph algorithms can be seen in a 2018 study, in which it was used to analyze the resilience of livestock production networks to the spread of epidemics. The study used a computer model to predict and study trends in epidemics throughout American hog production networks, taking into account all livestock industry roles. In the study, NetworkX was used to find information on degree, shortest paths, clustering, and k-cores as the model introduced infections and simulated their spread. This was then used to determine which networks are most susceptible to epidemics.[29]
In addition to network creation and analysis, NetworkX also has many visualization capabilities. It provides hooks into Matplotlib and GraphViz for 2D visuals, and VTK and UbiGraph for 3D visuals.[4] This makes the package useful in easily demonstrating and reporting network analysis and data, and allows for the simplification of networks for visual processing.
Comparison with Matlab
MATLAB allows the user to graph networks. Matlab is widely used to graph networks by mathematicians, physicists, biologists, and computer scientists. Matlab graphs can be more useful than Python-Networkx graphs under many circumstances.
A Matlab networkA networkx network
Dealing with large data
The main issue with Networkx is memory usage when dealing with large graphs. Networkx stores graph data in Python objects which makes it incapable of handling tens of millions of objects without consuming the computer memory. This causes an out-of-memory errors when working with large graphs.[30] On the other hand, Matlab works differently. Matlab processes large sets of data more efficiently by integrating them with the existing infrastructure. The user can scale up and run their Matlab code interactively using parallel processing as well as in deployed production mode. The user can also run their Matlab code with a large set of data on different cloud data such as Databricks, Domino Data Lab, and Google® BigQuery.[31]
Cost
Python is an open-source programming language. It can be downloaded and used completely with no charge. Also, Many widely used Python libraries and packages (including NetworkX) are completely free.[32] While, MATLAB has 6 pricing edition(s), from $49 to $2,150.[33] Matlab pricing varies depending on the type of the license. For example, High school and college students can get a Matlab license with a lower cost than individuals and business owners.
Getting access to Networkx through Matlab
MATLAB provides interoperability with other languages such as Python. Matlab provides access to many programming languages including C/C++, Java, and Python. Networkx can be called from Matlab which gives the user the advantage of using it within Matlab workflow.[34] This allows the user to call Python-Networkx codes in Matlab.
Applications to pure mathematics
Networks are useful tools to visualize, which helps with analyzing or making good predictions, which helps researchers generalize ideas. It gives the clear picture when dealing with a finite set. It can be used in different fields of mathematics like Set Theory, Abstract Algebra, and Number Theory.
The ordered relation a<b if and only a divides b on the set of integers 1-100
Graph equivalence relations
An Equivalence relation on a finite set with reasonable size can be graphed with Networkx. This is a helpful way to visualize it as it clearly shows the different equivalence classes.
The equivalence relation a~b if and only if a-b is divisible by 3 on the set containing the integers 1-100
This page is based on this Wikipedia article Text is available under the CC BY-SA 4.0 license; additional terms may apply. Images, videos and audio are available under their respective licenses.