
In classical mathematics, analytic geometry, also known as coordinate geometry or Cartesian geometry, is the study of geometry using a coordinate system. This contrasts with synthetic geometry.

Analog television is the original television technology that uses analog signals to transmit video and audio. In an analog television broadcast, the brightness, colors and sound are represented by amplitude, phase and frequency of an analog signal.

A Cartesian coordinate system in a plane is a coordinate system that specifies each point uniquely by a pair of numerical coordinates, which are the signed distances to the point from two fixed perpendicular oriented lines, measured in the same unit of length. Each reference line is called a coordinate axis or just axis of the system, and the point where they meet is its origin, at ordered pair (0, 0). The coordinates can also be defined as the positions of the perpendicular projections of the point onto the two axes, expressed as signed distances from the origin.
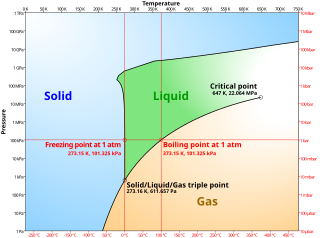
A phase diagram in physical chemistry, engineering, mineralogy, and materials science is a type of chart used to show conditions at which thermodynamically distinct phases occur and coexist at equilibrium.

A logarithmic scale is a way of displaying numerical data over a very wide range of values in a compact way—typically the largest numbers in the data are hundreds or even thousands of times larger than the smallest numbers. Such a scale is nonlinear: the numbers 10 and 20, and 60 and 70, are not the same distance apart on a log scale. Rather, the numbers 10 and 100, and 60 and 600 are equally spaced. Thus moving a unit of distance along the scale means the number has been multiplied by 10. Often exponential growth curves are displayed on a log scale, otherwise they would increase too quickly to fit within a small graph. Another way to think about it is that the number of digits of the data grows at a constant rate. For example, the numbers 10, 100, 1000, and 10000 are equally spaced on a log scale, because their numbers of digits is going up by 1 each time: 2, 3, 4, and 5 digits. In this way, adding two digits multiplies the quantity measured on the log scale by a factor of 100.

A chart is a graphical representation for data visualization, in which "the data is represented by symbols, such as bars in a bar chart, lines in a line chart, or slices in a pie chart". A chart can represent tabular numeric data, functions or some kinds of quality structure and provides different info.

A bar chart or bar graph is a chart or graph that presents categorical data with rectangular bars with heights or lengths proportional to the values that they represent. The bars can be plotted vertically or horizontally. A vertical bar chart is sometimes called a column chart.

A scatter plot is a type of plot or mathematical diagram using Cartesian coordinates to display values for typically two variables for a set of data. If the points are coded (color/shape/size), one additional variable can be displayed. The data are displayed as a collection of points, each having the value of one variable determining the position on the horizontal axis and the value of the other variable determining the position on the vertical axis.

Infographics are graphic visual representations of information, data, or knowledge intended to present information quickly and clearly. They can improve cognition by utilizing graphics to enhance the human visual system's ability to see patterns and trends. Similar pursuits are information visualization, data visualization, statistical graphics, information design, or information architecture. Infographics have evolved in recent years to be for mass communication, and thus are designed with fewer assumptions about the readers' knowledge base than other types of visualizations. Isotypes are an early example of infographics conveying information quickly and easily to the masses.
Many letters of the Latin alphabet, both capital and small, are used in mathematics, science, and engineering to denote by convention specific or abstracted constants, variables of a certain type, units, multipliers, or physical entities. Certain letters, when combined with special formatting, take on special meaning.

An image histogram is a type of histogram that acts as a graphical representation of the tonal distribution in a digital image. It plots the number of pixels for each tonal value. By looking at the histogram for a specific image a viewer will be able to judge the entire tonal distribution at a glance.

Page orientation is the way in which a rectangular page is oriented for normal viewing. The two most common types of orientation are portrait and landscape. The term "portrait orientation" comes from visual art terminology and describes the dimensions used to capture a person's face and upper body in a picture; in such images, the height of the display area is greater than the width. The term "landscape orientation" also reflects visual art terminology, where pictures with more width than height are needed to fully capture the horizon within an artist's view.

A raster scan, or raster scanning, is the rectangular pattern of image capture and reconstruction in television. By analogy, the term is used for raster graphics, the pattern of image storage and transmission used in most computer bitmap image systems. The word raster comes from the Latin word rastrum, which is derived from radere ; see also rastrum, an instrument for drawing musical staff lines. The pattern left by the lines of a rake, when drawn straight, resembles the parallel lines of a raster: this line-by-line scanning is what creates a raster. It is a systematic process of covering the area progressively, one line at a time. Although often a great deal faster, it is similar in the most general sense to how one's gaze travels when one reads lines of text. The data to be drawn is stored in an area of memory called the refresh buffer or frame buffer. This memory area holds the values for each pixel on the screen. These values are retrieved from the refresh buffer and painted onto the screen one row at a time.

A spacetime diagram is a graphical illustration of the properties of space and time in the special theory of relativity. Spacetime diagrams allow a qualitative understanding of the corresponding phenomena like time dilation and length contraction without mathematical equations.

An oscilloscope, previously called an oscillograph, and informally known as a scope or o-scope, CRO, or DSO, is a type of electronic test instrument that graphically displays varying signal voltages, usually as a calibrated two-dimensional plot of one or more signals as a function of time. The displayed waveform can then be analyzed for properties such as amplitude, frequency, rise time, time interval, distortion, and others. Originally, calculation of these values required manually measuring the waveform against the scales built into the screen of the instrument. Modern digital instruments may calculate and display these properties directly.

The social science of economics makes extensive use of graphs to better illustrate the economic principles and trends it is attempting to explain. Those graphs have specific qualities that are not often found in other sciences.

A plot is a graphical technique for representing a data set, usually as a graph showing the relationship between two or more variables. The plot can be drawn by hand or by a computer. In the past, sometimes mechanical or electronic plotters were used. Graphs are a visual representation of the relationship between variables, which are very useful for humans who can then quickly derive an understanding which may not have come from lists of values. Given a scale or ruler, graphs can also be used to read off the value of an unknown variable plotted as a function of a known one, but this can also be done with data presented in tabular form. Graphs of functions are used in mathematics, sciences, engineering, technology, finance, and other areas.
The following comparison of Adobe Flex charts provides charts classification, compares Flex chart products for different chart type availability and for different visual features like 3D versions of charts.
The history of the oscilloscope reaches back to the first recordings of waveforms with a galvanometer coupled to a mechanical drawing system in the second decade of the 19th century. The modern day digital oscilloscope is a consequence of multiple generations of development of the oscillograph, cathode-ray tubes, analog oscilloscopes, and digital electronics.
In astronomy, geography, and related sciences and contexts, a direction or plane passing by a given point is said to be vertical if it contains the local gravity direction at that point. Conversely, a direction or plane is said to be horizontal if it is perpendicular to the vertical direction. In general, something that is vertical can be drawn from up to down, such as the y-axis in the Cartesian coordinate system.

