The Beer-Lambert law is commonly applied to chemical analysis measurements to determine the concentration of chemical species that absorb light. It is often referred to as Beer's law. In physics, the Bouguer–Lambert law is an empirical law which relates the extinction or attenuation of light to the properties of the material through which the light is travelling. It had its first use in astronomical extinction. The fundamental law of extinction is sometimes called the Beer-Bouguer-Lambert law or the Bouguer-Beer-Lambert law or merely the extinction law. The extinction law is also used in understanding attenuation in physical optics, for photons, neutrons, or rarefied gases. In mathematical physics, this law arises as a solution of the BGK equation.

In physics, optical depth or optical thickness is the natural logarithm of the ratio of incident to transmitted radiant power through a material. Thus, the larger the optical depth, the smaller the amount of transmitted radiant power through the material. Spectral optical depth or spectral optical thickness is the natural logarithm of the ratio of incident to transmitted spectral radiant power through a material. Optical depth is dimensionless, and in particular is not a length, though it is a monotonically increasing function of optical path length, and approaches zero as the path length approaches zero. The use of the term "optical density" for optical depth is discouraged.
In astronomy, air mass or airmass is a measure of the amount of air along the line of sight when observing a star or other celestial source from below Earth's atmosphere. It is formulated as the integral of air density along the light ray.

The Upper Atmosphere Research Satellite (UARS) was a NASA-operated orbital observatory whose mission was to study the Earth's atmosphere, particularly the protective ozone layer. The 5,900-kilogram (13,000 lb) satellite was deployed from Space Shuttle Discovery during the STS-48 mission on 15 September 1991. It entered Earth orbit at an operational altitude of 600 kilometers (370 mi), with an orbital inclination of 57 degrees.
Variational Bayesian methods are a family of techniques for approximating intractable integrals arising in Bayesian inference and machine learning. They are typically used in complex statistical models consisting of observed variables as well as unknown parameters and latent variables, with various sorts of relationships among the three types of random variables, as might be described by a graphical model. As typical in Bayesian inference, the parameters and latent variables are grouped together as "unobserved variables". Variational Bayesian methods are primarily used for two purposes:
- To provide an analytical approximation to the posterior probability of the unobserved variables, in order to do statistical inference over these variables.
- To derive a lower bound for the marginal likelihood of the observed data. This is typically used for performing model selection, the general idea being that a higher marginal likelihood for a given model indicates a better fit of the data by that model and hence a greater probability that the model in question was the one that generated the data.

Forrest M. Mims III is an American amateur scientist, magazine columnist, and author of Getting Started in Electronics and Engineer's Mini-Notebook series of instructional books that were originally sold in Radio Shack electronics stores and are still in print. Mims graduated from Texas A&M University in 1966 with a major in government and minors in English and history. He became a commissioned officer in the United States Air Force, served in Vietnam as an Air Force intelligence officer (1967), and a Development Engineer at the Air Force Weapons Laboratory (1968–70).

Solar irradiance is the power per unit area received from the Sun in the form of electromagnetic radiation in the wavelength range of the measuring instrument. Solar irradiance is measured in watts per square metre (W/m2) in SI units.
The Solar Radiation and Climate Experiment (SORCE) was a NASA-sponsored satellite mission that measured incoming X-ray, ultraviolet, visible, near-infrared, and total solar radiation. These measurements specifically addressed long-term climate change, natural variability, atmospheric ozone, and UV-B radiation, enhancing climate prediction. These measurements are critical to studies of the Sun, its effect on the Earth's system, and its influence on humankind. SORCE was launched on 25 January 2003 on a Pegasus XL launch vehicle to provide NASA's Earth Science Enterprise (ESE) with precise measurements of solar radiation.

In ultrafast optics, spectral phase interferometry for direct electric-field reconstruction (SPIDER) is an ultrashort pulse measurement technique originally developed by Chris Iaconis and Ian Walmsley.
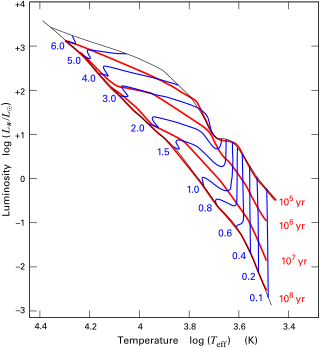
The Hayashi track is a luminosity–temperature relationship obeyed by infant stars of less than 3 M☉ in the pre-main-sequence phase of stellar evolution. It is named after Japanese astrophysicist Chushiro Hayashi. On the Hertzsprung–Russell diagram, which plots luminosity against temperature, the track is a nearly vertical curve. After a protostar ends its phase of rapid contraction and becomes a T Tauri star, it is extremely luminous. The star continues to contract, but much more slowly. While slowly contracting, the star follows the Hayashi track downwards, becoming several times less luminous but staying at roughly the same surface temperature, until either a radiative zone develops, at which point the star starts following the Henyey track, or nuclear fusion begins, marking its entry onto the main sequence.
The Angstrom exponent or Ångström exponent or absorption Ångström exponent is a parameter that describes how the optical thickness of an aerosol typically depends on the wavelength of the light.

A Sun photometer is a type of photometer conceived in such a way that it points at the Sun. Recent sun photometers are automated instruments incorporating a Sun-tracking unit, an appropriate optical system, a spectrally filtering device, a photodetector, and a data acquisition system. The measured quantity is called direct-sun radiance.
The air mass coefficient defines the direct optical path length through the Earth's atmosphere, expressed as a ratio relative to the path length vertically upwards, i.e. at the zenith. The air mass coefficient can be used to help characterize the solar spectrum after solar radiation has traveled through the atmosphere.
Multiangle light scattering (MALS) describes a technique for measuring the light scattered by a sample into a plurality of angles. It is used for determining both the absolute molar mass and the average size of molecules in solution, by detecting how they scatter light. A collimated beam from a laser source is most often used, in which case the technique can be referred to as multiangle laser light scattering (MALLS). The insertion of the word laser was intended to reassure those used to making light scattering measurements with conventional light sources, such as Hg-arc lamps that low-angle measurements could now be made. Until the advent of lasers and their associated fine beams of narrow width, the width of conventional light beams used to make such measurements prevented data collection at smaller scattering angles. In recent years, since all commercial light scattering instrumentation use laser sources, this need to mention the light source has been dropped and the term MALS is used throughout.
The grey atmosphere is a useful set of approximations made for radiative transfer applications in studies of stellar atmospheres based on the simplified notion that the absorption coefficient of matter within a star's atmosphere is constant—that is, unchanging—for all frequencies of the star's incident radiation.

Microwave Sounding Unit temperature measurements refers to temperature measurement using the Microwave Sounding Unit instrument and is one of several methods of measuring Earth atmospheric temperature from satellites. Microwave measurements have been obtained from the troposphere since 1979, when they were included within NOAA weather satellites, starting with TIROS-N. By comparison, the usable balloon (radiosonde) record begins in 1958 but has less geographic coverage and is less uniform.

The Simple Model of the Atmospheric Radiative Transfer of Sunshine (SMARTS) is a computer program designed to evaluate the surface solar irradiance components in the shortwave spectrum under cloudless conditions. The program, written in FORTRAN, relies on simplifications of the equation of radiative transfer to allow extremely fast calculations of the surface irradiance. The irradiance components can be incident on a horizontal, a fixed-tilt or a 2-axis tracking surface. SMARTS can be used for example to evaluate the energy production of solar panels under variable atmospheric conditions. Many other applications are possible.

In atmospheric chemistry, differential optical absorption spectroscopy (DOAS) is used to measure concentrations of trace gases. When combined with basic optical spectrometers such as prisms or diffraction gratings and automated, ground-based observation platforms, it presents a cheap and powerful means for the measurement of trace gas species such as ozone and nitrogen dioxide. Typical setups allow for detection limits corresponding to optical depths of 0.0001 along lightpaths of up to typically 15 km and thus allow for the detection also of weak absorbers, such as water vapour, Nitrous acid, Formaldehyde, Tetraoxygen, Iodine oxide, Bromine oxide and Chlorine oxide.

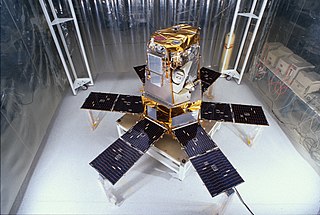
Student Nitric Oxide Explorer, was a NASA small scientific satellite which studied the concentration of nitric oxide in the thermosphere. It was launched in 1998 as part of NASA's Explorer program. The satellite was the first of three missions developed within the Student Explorer Demonstration Initiative (STEDI) program funded by the NASA and managed by the Universities Space Research Association (USRA). STEDI was a pilot program to demonstrate that high-quality space science can be carried out with small, low-cost free-flying satellites on a time scale of two years from go-ahead to launch. The satellite was developed by the University of Colorado Boulder's Laboratory for Atmospheric and Space Physics (LASP) and had met its goals by the time its mission ended with reentry in December 2003.
In the study of heat transfer, Schwarzschild's equation is used to calculate radiative transfer through a medium in local thermodynamic equilibrium that both absorbs and emits radiation.


