Related Research Articles

Scientific visualization is an interdisciplinary branch of science concerned with the visualization of scientific phenomena. It is also considered a subset of computer graphics, a branch of computer science. The purpose of scientific visualization is to graphically illustrate scientific data to enable scientists to understand, illustrate, and glean insight from their data. Research into how people read and misread various types of visualizations is helping to determine what types and features of visualizations are most understandable and effective in conveying information.
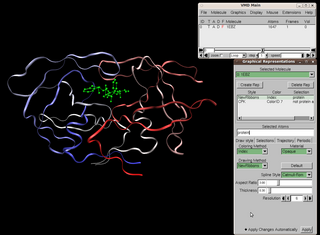
Visual Molecular Dynamics (VMD) is a molecular modelling and visualization computer program. VMD is developed mainly as a tool to view and analyze the results of molecular dynamics simulations. It also includes tools for working with volumetric data, sequence data, and arbitrary graphics objects. Molecular scenes can be exported to external rendering tools such as POV-Ray, RenderMan, Tachyon, Virtual Reality Modeling Language (VRML), and many others. Users can run their own Tcl and Python scripts within VMD as it includes embedded Tcl and Python interpreters. VMD runs on Unix, Apple Mac macOS, and Microsoft Windows. VMD is available to non-commercial users under a distribution-specific license which permits both use of the program and modification of its source code, at no charge.

In scientific visualization and computer graphics, volume rendering is a set of techniques used to display a 2D projection of a 3D discretely sampled data set, typically a 3D scalar field.
RasMol is a computer program written for molecular graphics visualization intended and used mainly to depict and explore biological macromolecule structures, such as those found in the Protein Data Bank. It was originally developed by Roger Sayle in the early 1990s.
Bitplane is a provider of software for 3D and 4D image analysis for the life sciences. Founded in December 1992, Bitplane operates out of three offices in Zürich, Switzerland, Belfast, United Kingdom, and South Windsor, Connecticut, United States.
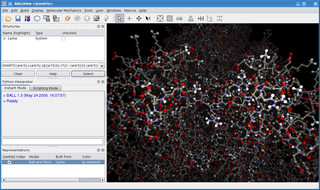
BALL is a C++ class framework and set of algorithms and data structures for molecular modelling and computational structural bioinformatics, a Python interface to this library, and a graphical user interface to BALL, the molecule viewer BALLView.
MeshLab is a 3D mesh processing software system that is oriented to the management and processing of unstructured large meshes and provides a set of tools for editing, cleaning, healing, inspecting, rendering, and converting these kinds of meshes. MeshLab is free and open-source software, subject to the requirements of the GNU General Public License (GPL), version 2 or later, and is used as both a complete package and a library powering other software. It is well known in the more technical fields of 3D development and data handling.
Gwyddion is a multiplatform modular free software for visualization and analysis of data from scanning probe microscopy (SPM) techniques. The project is led by its main developers David Nečas (Yeti) and Petr Klapetek who work together with several various developers across the world. The software is made available as free software under the terms of the GNU General Public License. The name “Gwyddion” is that of a prominent god of Welsh Mythology, see Gwydion

QuteMol is an open-source, interactive, molecular visualization system. QuteMol utilizes the current capabilities of modern GPUs through OpenGL shaders to offer an array of innovative visual effects. QuteMol visualization techniques are aimed at improving clarity and an easier understanding of the 3D shape and structure of large molecules or complex proteins.

The Max Planck Institute for Medical Research in Heidelberg, Germany, is a facility of the Max Planck Society for basic medical research. Since its foundation, six Nobel Prize laureates worked at the Institute: Otto Fritz Meyerhof (Physiology), Richard Kuhn (Chemistry), Walther Bothe (Physics), André Michel Lwoff, Rudolf Mößbauer (Physics), Bert Sakmann and Stefan W. Hell (Chemistry).
Sirius is a molecular modelling and analysis system developed at San Diego Supercomputer Center. Sirius is designed to support advanced user requirements that go beyond simple display of small molecules and proteins. Sirius supports high quality interactive 3D graphics, structure building, displaying protein or DNA primary sequences, access to remote data sources, and visualizing molecular dynamics trajectories. It can be used for scientific visualization and analysis, and chemistry and biology instruction.

Molekel is a free software multiplatform molecular visualization program. It was originally developed at the University of Geneva by Peter F. Flükiger in the 1990s for Silicon Graphics Computers. In 1998, Stefan Portmann took over responsibility and released Version 3.0. Version 4.0 was a nearly platform independent version. Further developments lead to version 4.3, before Stefan Portmann moved on and ceased to develop the codes. In 2006, the Swiss National Supercomputing Centre (CSCS) restarted the project and version 5.0 was released on 21 December 2006.

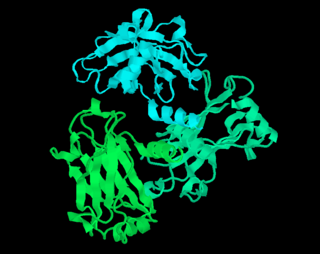
Ribbon diagrams, also known as Richardson diagrams, are 3D schematic representations of protein structure and are one of the most common methods of protein depiction used today. The ribbon shows the overall path and organization of the protein backbone in 3D, and serves as a visual framework on which to hang details of the full atomic structure, such as the balls for the oxygen atoms bound to the active site of myoglobin in the adjacent image. Ribbon diagrams are generated by interpolating a smooth curve through the polypeptide backbone. α-helices are shown as coiled ribbons or thick tubes, β-strands as arrows, and non-repetitive coils or loops as lines or thin tubes. The direction of the polypeptide chain is shown locally by the arrows, and may be indicated overall by a colour ramp along the length of the ribbon.
This is a list of computer programs that are predominantly used for molecular mechanics calculations.
Materials Studio is software for simulating and modeling materials. It is developed and distributed by BIOVIA, a firm specializing in research software for computational chemistry, bioinformatics, cheminformatics, molecular dynamics simulation, and quantum mechanics.
Biology data visualization is a branch of bioinformatics concerned with the application of computer graphics, scientific visualization, and information visualization to different areas of the life sciences. This includes visualization of sequences, genomes, alignments, phylogenies, macromolecular structures, systems biology, microscopy, and magnetic resonance imaging data. Software tools used for visualizing biological data range from simple, standalone programs to complex, integrated systems.

Amira is a software platform for 3D and 4D data visualization, processing, and analysis. It is being actively developed by Thermo Fisher Scientific in collaboration with the Zuse Institute Berlin (ZIB), and commercially distributed by Thermo Fisher Scientific.
References
- ↑ "Amira® - Request Trial License Customers". www.amiravis.com. Archived from the original on 30 August 2009. Retrieved 13 January 2022.