A work-breakdown structure (WBS) in project management and systems engineering is a deliverable-oriented breakdown of a project into smaller components. A work breakdown structure is a key project management element that organizes the team's work into manageable sections. The Project Management Body of Knowledge defines the work-breakdown structure as a "hierarchical decomposition of the total scope of work to be carried out by the project team to accomplish the project objectives and create the required deliverables."
Critical chain project management (CCPM) is a method of planning and managing projects that emphasizes the resources required to execute project tasks. It was developed by Eliyahu M. Goldratt. It differs from more traditional methods that derive from critical path and PERT algorithms, which emphasize task order and rigid scheduling. A critical chain project network strives to keep resources levelled, and requires that they be flexible in start times.

The critical path method (CPM), or critical path analysis (CPA), is an algorithm for scheduling a set of project activities. A critical path is determined by identifying the longest stretch of dependent activities and measuring the time required to complete them from start to finish. It is commonly used in conjunction with the program evaluation and review technique (PERT).
Project management software (PMS) can help plan, organize, and manage resource tools and develop resource estimates. Depending on the sophistication of the software, it can manage estimation and planning, scheduling, cost control and budget management, resource allocation, collaboration software, communication, decision-making, quality management, time management and documentation or administration systems. Numerous PC and browser-based project management software and contract management software products and services are available.
The program evaluation and review technique (PERT) is a statistical tool used in project management, which was designed to analyze and represent the tasks involved in completing a given project.

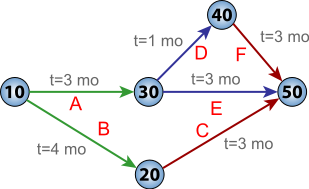
A project network diagram is a graph that displays the order in which a project’s activities are to be completed. Derived from the work breakdown structure, the terminal elements of a project are organized sequentially based on the relationship among them. It is typically drawn from left to right to reflect project chronology.
The term conceptual model refers to any model that is formed after a conceptualization or generalization process. Conceptual models are often abstractions of things in the real world, whether physical or social. Semantic studies are relevant to various stages of concept formation. Semantics is fundamentally a study of concepts, the meaning that thinking beings give to various elements of their experience.
Graphical Evaluation and Review Technique (GERT) is a network analysis technique used in project management that allows probabilistic treatment both network logic and estimation of activity duration. The technique was first described in 1966 by Dr. Alan B. Pritsker of Purdue University and WW Happ.
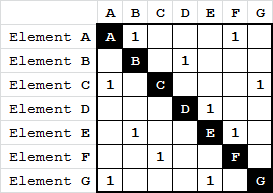
The design structure matrix (DSM; also referred to as dependency structure matrix, dependency structure method, dependency source matrix, problem solving matrix (PSM), incidence matrix, N2 matrix, interaction matrix, dependency map or design precedence matrix) is a simple, compact and visual representation of a system or project in the form of a square matrix.
The following outline is provided as an overview of and topical guide to business management:

Event chain methodology is a network analysis technique that is focused on identifying and managing events and relationship between them that affect project schedules. It is an uncertainty modeling schedule technique. Event chain methodology is an extension of quantitative project risk analysis with Monte Carlo simulations. It is the next advance beyond critical path method and critical chain project management. Event chain methodology tries to mitigate the effect of motivational and cognitive biases in estimating and scheduling. It improves accuracy of risk assessment and helps to generate more realistic risk adjusted project schedules.
Event chain diagrams are visualizations that show the relationships between events and tasks and how the events affect each other.
Project engineering includes all parts of the design of manufacturing or processing facilities, either new or modifications to and expansions of existing facilities. A "project" consists of a coordinated series of activities or tasks performed by engineers, designers, drafters and others from one or more engineering disciplines or departments. Project tasks consist of such things as performing calculations, writing specifications, preparing bids, reviewing equipment proposals and evaluating or selecting equipment and preparing various lists, such as equipment and materials lists, and creating drawings such as electrical, piping and instrumentation diagrams, physical layouts and other drawings used in design and construction. A small project may be under the direction of a project engineer. Large projects are typically under the direction of a project manager or management team. Some facilities have in house staff to handle small projects, while some major companies have a department that does internal project engineering. Large projects are typically contracted out to engineering companies. Staffing at engineering companies varies according to the work load and duration of employment may only last until an individual's tasks are completed.

A plot is a graphical technique for representing a data set, usually as a graph showing the relationship between two or more variables. The plot can be drawn by hand or by a computer. In the past, sometimes mechanical or electronic plotters were used. Graphs are a visual representation of the relationship between variables, which are very useful for humans who can then quickly derive an understanding which may not have come from lists of values. Given a scale or ruler, graphs can also be used to read off the value of an unknown variable plotted as a function of a known one, but this can also be done with data presented in tabular form. Graphs of functions are used in mathematics, sciences, engineering, technology, finance, and other areas.
A glossary of terms relating to project management and consulting.
The following outline is provided as an overview of and topical guide to project management:

In probability theory and statistics, the beta rectangular distribution is a probability distribution that is a finite mixture distribution of the beta distribution and the continuous uniform distribution. The support is of the distribution is indicated by the parameters a and b, which are the minimum and maximum values respectively. The distribution provides an alternative to the beta distribution such that it allows more density to be placed at the extremes of the bounded interval of support. Thus it is a bounded distribution that allows for outliers to have a greater chance of occurring than does the beta distribution.
Project production management (PPM) is the application of operations management to the delivery of capital projects. The PPM framework is based on a project as a production system view, in which a project transforms inputs into outputs.
Willard R. Fazar was an American economist, Head of the Program Evaluation Branch at Special Projects Office, U.S. Navy, and author. He is known as one of co-inventors, and key-developers of PERT."
In network theory, link prediction is the problem of predicting the existence of a link between two entities in a network. Examples of link prediction include predicting friendship links among users in a social network, predicting co-authorship links in a citation network, and predicting interactions between genes and proteins in a biological network. Link prediction can also have a temporal aspect, where, given a snapshot of the set of links at time , the goal is to predict the links at time . Link prediction is widely applicable. In e-commerce, link prediction is often a subtask for recommending items to users. In the curation of citation databases, it can be used for record deduplication. In bioinformatics, it has been used to predict protein-protein interactions (PPI). It is also used to identify hidden groups of terrorists and criminals in security related applications.