Luminosity function

Last updated
Photopic (black) and scotopic (green) luminosity functions. The photopic includes the CIE 1931 standard (solid), the Judd-Vos 1978 modified data (dashed), and the Sharpe, Stockman, Jagla & Jagle 2005 data (dotted). The horizontal axis is wavelength in nm. Luminosity.svg
Photopic (black) and scotopic (green) luminosity functions. The photopic includes the CIE 1931 standard (solid), the Judd–Vos 1978 modified data (dashed), and the Sharpe, Stockman, Jagla & Jägle 2005 data (dotted). The horizontal axis is wavelength in nm.
Srgbspectrum.png

A luminosity function or luminous efficiency function describes the average spectral sensitivity of human visual perception of brightness. It is based on subjective judgements of which of a pair of different-colored lights is brighter, to describe relative sensitivity to light of different wavelengths. It should not be considered perfectly accurate, but it is a good representation of visual sensitivity of the human eye and it is valuable as a baseline for experimental purposes. Different luminosity functions apply under different lighting condition, varying from photopic in brightly lit conditions through mesotopic to scotopic under low lighting conditions. Without qualification, the luminosity function generally refers to the photopic luminosity function.

Contents

The CIE photopic luminosity function y(λ) or V(λ) is a standard function established by the Commission Internationale de l'Éclairage (CIE) and may be used to convert radiant energy into luminous (i.e., visible) energy. It also forms the central color matching function in the CIE 1931 color space.

Details

There are two luminosity functions in common use. For everyday light levels, the photopic luminosity function best approximates the response of the human eye. For low light levels, the response of the human eye changes, and the scotopic curve applies. The photopic curve is the CIE standard curve used in the CIE 1931 color space.

The luminous flux (or visible power) in a light source is defined by the photopic luminosity function. The following equation calculates the total luminous flux in a source of light:

where

Formally, the integral is the inner product of the luminosity function with the spectral power distribution. [1] In practice, the integral is replaced by a sum over discrete wavelengths for which tabulated values of the luminosity function are available. The CIE distributes standard tables with luminosity function values at 5 nm intervals from 380 nm to 780 nm. [cie 1]

The standard luminosity function is normalized to a peak value of unity at 555 nm (see luminous coefficient). The value of the constant in front of the integral is usually rounded off to 683 lm/W. The small excess fractional value comes from the slight mismatch between the definition of the lumen and the peak of the luminosity function. The lumen is defined to be unity for a radiant energy of 1/683 W at a frequency of 540 THz, which corresponds to a standard air wavelength of 555.016 nm rather than 555 nm, which is the peak of the luminosity curve. The value of y(λ) is 0.999997 at 555.016 nm, so that a value of 683/0.999997 = 683.002 is the multiplicative constant. [2]

The number 683 is connected to the modern (1979) definition of the candela, the unit of luminous intensity. [cie 2] This arbitrary number made the new definition give numbers equivalent to those from the old definition of the candela.

Improvements to the standard

The CIE 1924 photopic V(λ) luminosity function, [cie 3] which is included in the CIE 1931 color-matching functions as the y(λ) function, has long been acknowledged to underestimate the contribution of the blue end of the spectrum to perceived luminance. There have been numerous attempts to improve the standard function, to make it more representative of human vision. Judd in 1951, [3] improved by Vos in 1978, [4] resulted in a function known as CIE VM(λ). [5] More recently, Sharpe, Stockman, Jagla & Jägle (2005) developed a function consistent with the Stockman & Sharpe cone fundamentals; [6] their curves are plotted in the figure above.

ISO Standard

The ISO standard is ISO 11664-1:2007, soon to be replaced by ISO/CIE FDIS 11664-1. The standard provides an incremental table by nm of each value in the visible range. [7] [8]

Scotopic luminosity

For very low levels of intensity (scotopic vision), the sensitivity of the eye is mediated by rods, not cones, and shifts toward the violet, peaking around 507 nm for young eyes; the sensitivity is equivalent to 1699 lm/W [9] or 1700 lm/W [10] at this peak.

The standard scotopic luminosity function or V(λ) was adopted by the CIE in 1951, based on measurements by Wald (1945) and by Crawford (1949). [11]

Color blindness

Protanopic (green) and deuteranopic (red) luminosity functions. For comparison, the standard photopic curve is shown in yellow. LuminosityCurve2.svg
Protanopic (green) and deuteranopic (red) luminosity functions. For comparison, the standard photopic curve is shown in yellow.

Color blindness changes the sensitivity of the eye as a function of wavelength. For people with protanopia, the peak of the eye's response is shifted toward the short-wave part of the spectrum (approximately 540 nm), while for people suffering deuteranopia, there is a slight shift in the peak of the spectrum, to about 560 nm. [12] People with protanopia have essentially no sensitivity to light of wavelengths more than 670 nm.

Most non-primate mammals have the same luminosity function as people with protanopia. Their insensitivity to long-wavelength red light makes it possible to use such illumination while studying the nocturnal life of animals. [13]

For older people with normal color vision, the crystalline lens may become slightly yellow due to cataracts, which moves the maximum of sensitivity to the red part of the spectrum and narrows the range of perceived wavelengths.[ citation needed ]

See also

Related Research Articles

Candela SI unit of luminous intensity

The candela is the base unit of luminous intensity in the International System of Units (SI); that is, luminous power per unit solid angle emitted by a point light source in a particular direction. Luminous intensity is analogous to radiant intensity, but instead of simply adding up the contributions of every wavelength of light in the source's spectrum, the contribution of each wavelength is weighted by the standard luminosity function. A common wax candle emits light with a luminous intensity of roughly one candela. If emission in some directions is blocked by an opaque barrier, the emission would still be approximately one candela in the directions that are not obscured.

Wiens displacement law

Wien's displacement law states that the black-body radiation curve for different temperatures will peak at different wavelengths that are inversely proportional to the temperature. The shift of that peak is a direct consequence of the Planck radiation law, which describes the spectral brightness of black-body radiation as a function of wavelength at any given temperature. However, it had been discovered by Wilhelm Wien several years before Max Planck developed that more general equation, and describes the entire shift of the spectrum of black-body radiation toward shorter wavelengths as temperature increases.

International Commission on Illumination International authority on light, illumination, color, and color spaces

The International Commission on Illumination is the international authority on light, illumination, colour, and colour spaces. It was established in 1913 as a successor to the Commission Internationale de Photométrie, which was founded in 1900, and is today based in Vienna, Austria. The President from 2019 is Dr Peter Blattner from Switzerland.

Luminous intensity Visible light per unit solid angle

luminous intensity is a measure of the wavelength-weighted power emitted by a light source in a particular direction per unit solid angle, based on the luminosity function, a standardized model of the sensitivity of the human eye. The SI unit of luminous intensity is the candela (cd), an SI base unit.

Photometry (optics)

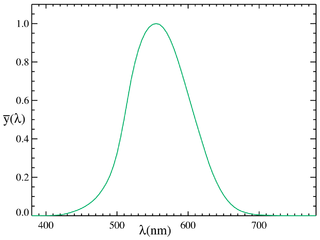
Photometry is the science of the measurement of light, in terms of its perceived brightness to the human eye. It is distinct from radiometry, which is the science of measurement of radiant energy in terms of absolute power. In modern photometry, the radiant power at each wavelength is weighted by a luminosity function that models human brightness sensitivity. Typically, this weighting function is the photopic sensitivity function, although the scotopic function or other functions may also be applied in the same way.

Luminous flux Physical quantity

In photometry, luminous flux or luminous power is the measure of the perceived power of light. It differs from radiant flux, the measure of the total power of electromagnetic radiation, in that luminous flux is adjusted to reflect the varying sensitivity of the human eye to different wavelengths of light.

The lumen is the SI derived unit of luminous flux, a measure of the total quantity of visible light emitted by a source per unit of time. Luminous flux differs from power in that radiant flux includes all electromagnetic waves emitted, while luminous flux is weighted according to a model of the human eye's sensitivity to various wavelengths. Lumens are related to lux in that one lux is one lumen per square metre.

Spectral power distribution

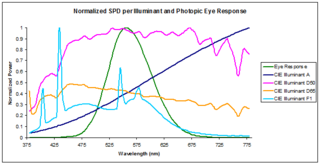
In radiometry, photometry, and color science, a spectral power distribution (SPD) measurement describes the power per unit area per unit wavelength of an illumination. More generally, the term spectral power distribution can refer to the concentration, as a function of wavelength, of any radiometric or photometric quantity.

Purkinje effect Tendency for the peak luminance sensitivity of the human eye to shift toward the blue end of the color spectrum at low illumination levels

The Purkinje effect is the tendency for the peak luminance sensitivity of the eye to shift toward the blue end of the color spectrum at low illumination levels as part of dark adaptation. In consequence, reds will appear darker relative to other colors as light levels decrease. The effect is named after the Czech anatomist Jan Evangelista Purkyně. While the effect is often described from the perspective of the human eye, it is well established in a number of animals under the same name to describe the general shifting of spectral sensitivity due to pooling of rod and cone output signals as a part of dark/light adaptation.

Photosynthetically active radiation

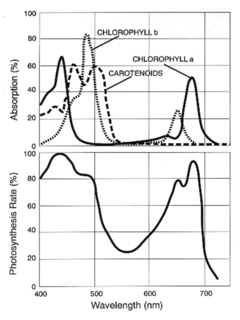
Photosynthetically active radiation, often abbreviated PAR, designates the spectral range of solar radiation from 400 to 700 nanometers that photosynthetic organisms are able to use in the process of photosynthesis. This spectral region corresponds more or less with the range of light visible to the human eye. Photons at shorter wavelengths tend to be so energetic that they can be damaging to cells and tissues, but are mostly filtered out by the ozone layer in the stratosphere. Photons at longer wavelengths do not carry enough energy to allow photosynthesis to take place.

Luminous efficacy is a measure of how well a light source produces visible light. It is the ratio of luminous flux to power, measured in lumens per watt in the International System of Units (SI). Depending on context, the power can be either the radiant flux of the source's output, or it can be the total power consumed by the source. Which sense of the term is intended must usually be inferred from the context, and is sometimes unclear. The former sense is sometimes called luminous efficacy of radiation, and the latter luminous efficacy of a source or overall luminous efficacy.

Photopic vision

Photopic vision is the vision of the eye under well-lit conditions (luminance level 10 to 108cd/m2). In humans and many other animals, photopic vision allows color perception, mediated by cone cells, and a significantly higher visual acuity and temporal resolution than available with scotopic vision.

Scotopic vision

Scotopic vision is the vision of the eye under low-light levels. The term comes from Greek skotos, meaning "darkness", and -opia, meaning "a condition of sight". In the human eye, cone cells are nonfunctional in low visible light. Scotopic vision is produced exclusively through rod cells, which are most sensitive to wavelengths of around 498 nm (green–blue) and are insensitive to wavelengths longer than about 640 nm. This condition is called the Purkinje effect.

The CIE 1931 color spaces are the first defined quantitative links between distributions of wavelengths in the electromagnetic visible spectrum, and physiologically perceived colors in human color vision. The mathematical relationships that define these color spaces are essential tools for color management, important when dealing with color inks, illuminated displays, and recording devices such as digital cameras. The system was designed in 1931 by the "Commission Internationale de l'éclairage", known in English as the International Commission on Illumination.

In photometry, luminous energy is the perceived energy of light. This is sometimes called the quantity of light. Luminous energy is not the same as radiant energy, the corresponding objective physical quantity. This is because the human eye can only see light in the visible spectrum and has different sensitivities to light of different wavelengths within the spectrum. When adapted for bright conditions, the eye is most sensitive to light at a wavelength of 555 nm. Light with a given amount of radiant energy will have more luminous energy if the wavelength is 555 nm than if the wavelength is longer or shorter. Light whose wavelength is well outside the visible spectrum has a luminous energy of zero, regardless of the amount of radiant energy present.

Illuminant D65 Standard illuminant defined by the International Commission on Illumination

CIE Standard Illuminant D65 (sometimes written D65) is a commonly used standard illuminant defined by the International Commission on Illumination (CIE). It is part of the D series of illuminants that try to portray standard illumination conditions at open-air in different parts of the world.

Mesopic vision is a combination of photopic vision and scotopic vision in low but not quite dark lighting situations. Mesopic light levels range from luminances of approximately 0.01 cd/m2 to 3 cd/m2. Most nighttime outdoor and street lighting scenarios are in the mesopic range.

Standard illuminant Theoretical source of visible light

A standard illuminant is a theoretical source of visible light with a profile which is published. Standard illuminants provide a basis for comparing images or colors recorded under different lighting.

Grassmann's laws describe empirical results about how the perception of mixtures of colored lights composed of different spectral power distributions can be algebraically related to one another in a color matching context. Discovered by Hermann Grassmann these "laws" are actually principles used to predict color match responses to a good approximation under photopic and mesopic vision. A number of studies have examined how and why they provide poor predictions under specific conditions.

Spectral sensitivity Relative efficiency of detection of a signal as a function of its frequency or wavelength

Spectral sensitivity is the relative efficiency of detection, of light or other signal, as a function of the frequency or wavelength of the signal.

References

  1. Charles A. Poynton (2003). Digital Video and HDTV: Algorithms and Interfaces. Morgan Kaufmann. ISBN   1-55860-792-7.
  2. Wyszecki, Günter & Stiles, W.S. (2000). Color Science - Concepts and Methods, Quantitative Data and Formulae (2nd ed.). Wiley-Interscience. ISBN   0-471-39918-3.
  3. Judd, Deane B. & Wyszecki, Günter (1975). Color in Business, Science and Industry (3rd ed.). John Wiley. ISBN   0-471-45212-2.
  4. Vos, J. J. (1978). "Colorimetric and photometric properties of a 2° fundamental observer". Color Research and Application. 3 (3): 125–128. doi:10.1002/col.5080030309.
  5. Stiles, W. S.; Burch, J. M. (1955). "Interim report to the Commission Internationale de l'Eclairage Zurich 1955, on the National Physical Laboratory's investigation of colour-matching". Optica Acta. 2 (4): 168–181. Bibcode:1955AcOpt...2..168S. doi:10.1080/713821039.
  6. Sharpe, L. T.; Stockman, A.; Jagla, W.; Jägle, H. (2005). "A luminous efficiency function, V*(λ), for daylight adaptation" (PDF). Journal of Vision. 5 (11): 948–968. doi:10.1167/5.11.3. Archived from the original (PDF) on April 26, 2012.
  7. "Colorimetry -- Part 1: CIE standard colorimetric observers" . Retrieved December 9, 2018.
  8. "Kay & Laby;tables of physical & chemical constants;General physics;SubSection: 2.5.3 Photometry". National Physical Laboratory; UK. Retrieved December 9, 2018.
  9. Kohei Narisada; Duco Schreuder (2004). Light Pollution Handbook. Springer. ISBN   1-4020-2665-X.
  10. Casimer DeCusatis (1998). Handbook of Applied Photometry. Springer. ISBN   1-56396-416-3.
  11. 1 2 Judd, Deane B. (1979). Contributions to Color Science. Washington D.C. 20234: NBS. p. 316.CS1 maint: location (link)
  12. I. S. McLennan & J. Taylor-Jeffs (2004). "The use of sodium lamps to brightly illuminate mouse houses during their dark phases" (PDF). Laboratory Animals. 38: 384–392. doi:10.1258/0023677041958927. PMID   15479553.[ permanent dead link ]

CIE documents

  1. "CIE Selected Colorimetric Tables". Archived from the original on 2017-01-31.
  2. 16th Conférence générale des poids et mesures Resolution 3, CR, 100 (1979), and Metrologia, 16, 56 (1980).
  3. CIE (1926). Commission internationale de l'Eclairage proceedings, 1924. Cambridge University Press, Cambridge.

Curve data