In mathematics, the binary logarithm is the power to which the number 2 must be raised to obtain the value n. That is, for any real number x,

A DNA microarray is a collection of microscopic DNA spots attached to a solid surface. Scientists use DNA microarrays to measure the expression levels of large numbers of genes simultaneously or to genotype multiple regions of a genome. Each DNA spot contains picomoles of a specific DNA sequence, known as probes. These can be a short section of a gene or other DNA element that are used to hybridize a cDNA or cRNA sample under high-stringency conditions. Probe-target hybridization is usually detected and quantified by detection of fluorophore-, silver-, or chemiluminescence-labeled targets to determine relative abundance of nucleic acid sequences in the target. The original nucleic acid arrays were macro arrays approximately 9 cm × 12 cm and the first computerized image based analysis was published in 1981. It was invented by Patrick O. Brown. An example of its application is in SNPs arrays for polymorphisms in cardiovascular diseases, cancer, pathogens and GWAS analysis. It is also used for the identification of structural variations and the measurement of gene expression.
Comparative genomic hybridization(CGH) is a molecular cytogenetic method for analysing copy number variations (CNVs) relative to ploidy level in the DNA of a test sample compared to a reference sample, without the need for culturing cells. The aim of this technique is to quickly and efficiently compare two genomic DNA samples arising from two sources, which are most often closely related, because it is suspected that they contain differences in terms of either gains or losses of either whole chromosomes or subchromosomal regions (a portion of a whole chromosome). This technique was originally developed for the evaluation of the differences between the chromosomal complements of solid tumor and normal tissue, and has an improved resolution of 5–10 megabases compared to the more traditional cytogenetic analysis techniques of giemsa banding and fluorescence in situ hybridization (FISH) which are limited by the resolution of the microscope utilized.
The transcriptome is the set of all RNA transcripts, including coding and non-coding, in an individual or a population of cells. The term can also sometimes be used to refer to all RNAs, or just mRNA, depending on the particular experiment. The term transcriptome is a portmanteau of the words transcript and genome; it is associated with the process of transcript production during the biological process of transcription.
Bioconductor is a free, open source and open development software project for the analysis and comprehension of genomic data generated by wet lab experiments in molecular biology.

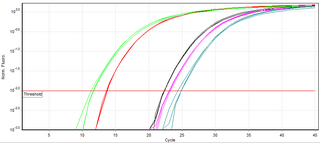
A real-time polymerase chain reaction is a laboratory technique of molecular biology based on the polymerase chain reaction (PCR). It monitors the amplification of a targeted DNA molecule during the PCR, not at its end, as in conventional PCR. Real-time PCR can be used quantitatively and semi-quantitatively.

Microarray analysis techniques are used in interpreting the data generated from experiments on DNA, RNA, and protein microarrays, which allow researchers to investigate the expression state of a large number of genes - in many cases, an organism's entire genome - in a single experiment. Such experiments can generate very large amounts of data, allowing researchers to assess the overall state of a cell or organism. Data in such large quantities is difficult - if not impossible - to analyze without the help of computer programs.

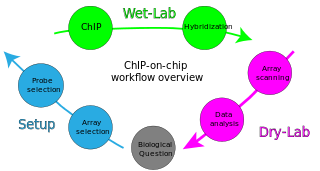
ChIP-on-chip is a technology that combines chromatin immunoprecipitation ('ChIP') with DNA microarray ("chip"). Like regular ChIP, ChIP-on-chip is used to investigate interactions between proteins and DNA in vivo. Specifically, it allows the identification of the cistrome, the sum of binding sites, for DNA-binding proteins on a genome-wide basis. Whole-genome analysis can be performed to determine the locations of binding sites for almost any protein of interest. As the name of the technique suggests, such proteins are generally those operating in the context of chromatin. The most prominent representatives of this class are transcription factors, replication-related proteins, like origin recognition complex protein (ORC), histones, their variants, and histone modifications.
lumi is a free, open source and open development software project for the analysis and comprehension of Illumina expression and methylation microarray data. The project was started in the summer of 2006 and set out to provide algorithms and data management tools of Illumina in the framework of Bioconductor. It is based on the statistical R programming language.

Sal-like protein 2 is a protein that in humans is encoded by the SALL2 gene.
The Illumina Methylation Assay using the Infinium I platform uses 'BeadChip' technology to generate a comprehensive genome-wide profiling of human DNA methylation. Similar to bisulfite sequencing and pyrosequencing, this method quantifies methylation levels at various loci within the genome. This assay is used for methylation probes on the Illumina Infinium HumanMethylation27 BeadChip. Probes on the 27k array target regions of the human genome to measure methylation levels at 27,578 CpG dinucleotides in 14,495 genes. The Infinium HumanMethylation450 BeadChip array targets > 450,000 methylation sites. In 2016, the Infinium MethylationEPIC BeadChip was released, which interrogates over 850,000 methylation sites across the human genome.

RNA-Seq is a sequencing technique that uses next-generation sequencing (NGS) to reveal the presence and quantity of RNA in a biological sample, representing an aggregated snapshot of the cells' dynamic pool of RNAs, also known as transcriptome.
Fold change is a measure describing how much a quantity changes between an original and a subsequent measurement. It is defined as the ratio between the two quantities; for quantities A and B the fold change of B with respect to A is B/A. In other words, a change from 30 to 60 is defined as a fold-change of 2. This is also referred to as a "one fold increase". Similarly, a change from 30 to 15 is referred to as a "0.5-fold decrease". Fold change is often used when analysing multiple measurements of a biological system taken at different times as the change described by the ratio between the time points is easier to interpret than the difference.

In statistics, a volcano plot is a type of scatter-plot that is used to quickly identify changes in large data sets composed of replicate data. It plots significance versus fold-change on the y and x axes, respectively. These plots are increasingly common in omic experiments such as genomics, proteomics, and metabolomics where one often has a list of many thousands of replicate data points between two conditions and one wishes to quickly identify the most meaningful changes. A volcano plot combines a measure of statistical significance from a statistical test with the magnitude of the change, enabling quick visual identification of those data-points that display large magnitude changes that are also statistically significant.
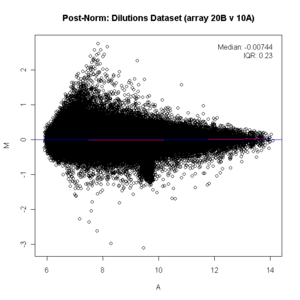
The ratio average (RA) plot is an integer-based version of an MA plot for visualizing two-condition count data. Its distinctive arrow-like shape derives from the way it includes condition-unique (0,n) or (n,0) points into the plot via an epsilon factor.
The phenotype microarray approach is a technology for high-throughput phenotyping of cells. A phenotype microarray system enables one to monitor simultaneously the phenotypic reaction of cells to environmental challenges or exogenous compounds in a high-throughput manner. The phenotypic reactions are recorded as either end-point measurements or respiration kinetics similar to growth curves.

Alicia Yinema Kate Nungarai Oshlack is an Australian bioinformatician and is Co-Head of Computational Biology at the Peter MacCallum Cancer Centre in Melbourne, Victoria, Australia. She is best known for her work developing methods for the analysis of transcriptome data as a measure of gene expression. She has characterized the role of gene expression in human evolution by comparisons of humans, chimpanzees, orangutans, and rhesus macaques, and works collaboratively in data analysis to improve the use of clinical sequencing of RNA samples by RNAseq for human disease diagnosis.
Transcriptomics technologies are the techniques used to study an organism's transcriptome, the sum of all of its RNA transcripts. The information content of an organism is recorded in the DNA of its genome and expressed through transcription. Here, mRNA serves as a transient intermediary molecule in the information network, whilst non-coding RNAs perform additional diverse functions. A transcriptome captures a snapshot in time of the total transcripts present in a cell. Transcriptomics technologies provide a broad account of which cellular processes are active and which are dormant. A major challenge in molecular biology is to understand how a single genome gives rise to a variety of cells. Another is how gene expression is regulated.

Rafael Irizarry is a professor of biostatistics at the Harvard T.H. Chan School of Public Health and professor of biostatistics and computational biology at the Dana–Farber Cancer Institute. Irizarry is known as one of the founders of the Bioconductor project.
Jean Yee Hwa Yang is an Australian statistician known for her work on variance reduction for microarrays, and for inferring proteins from mass spectrometry data. Yang is a Professor in the School of Mathematics and Statistics at the University of Sydney.


