Related Research Articles

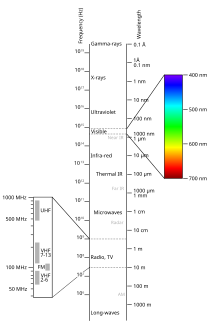
Infrared (IR), sometimes called infrared light, is electromagnetic radiation (EMR) with wavelengths longer than those of visible light. It is therefore invisible to the human eye. IR is generally understood to encompass wavelengths from around 1 millimeter (300 GHz) to the nominal red edge of the visible spectrum, around 700 nanometers (430 THz). Longer IR wavelengths (30μm-100μm) are sometimes included as part of the terahertz radiation range. Almost all black-body radiation from objects near room temperature is at infrared wavelengths. As a form of electromagnetic radiation, IR propagates energy and momentum, with properties corresponding to both those of a wave and of a particle, the photon.

Forward-looking infrared (FLIR) cameras, typically used on military and civilian aircraft, use a thermographic camera that senses infrared radiation.
Remote sensing is the acquisition of information about an object or phenomenon without making physical contact with the object, in contrast to in situ or on-site observation. The term is applied especially to acquiring information about the Earth and other planets. Remote sensing is used in numerous fields, including geography, land surveying and most Earth science disciplines ; it also has military, intelligence, commercial, economic, planning, and humanitarian applications, among others.

A thermographic camera is a device that creates an image using infrared (IR) radiation, similar to a normal camera that forms an image using visible light. Instead of the 400–700 nanometre (nm) range of the visible light camera, infrared cameras are sensitive to wavelengths from about 1,000 nm to about 14,000 nm (14 μm). The practice of capturing and analyzing the data they provide is called thermography.
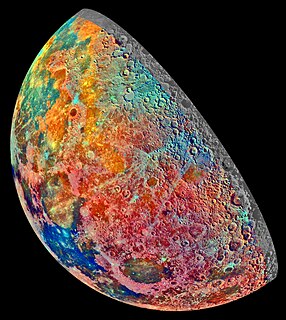
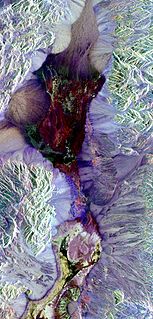
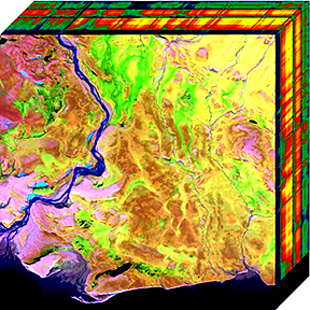
False color refers to a group of color rendering methods used to display images in color which were recorded in the visible or non-visible parts of the electromagnetic spectrum. A false-color image is an image that depicts an object in colors that differ from those a photograph would show. In this image, colors have been assigned to three different wavelengths that our eyes cannot normally see.

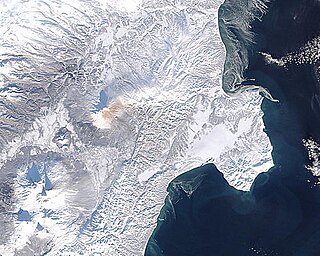
Satellite images are images of Earth collected by imaging satellites operated by governments and businesses around the world. Satellite imaging companies sell images by licensing them to governments and businesses such as Apple Maps and Google Maps.
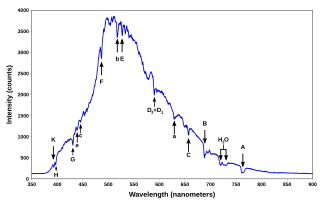
Spectral signature is the variation of reflectance or emittance of a material with respect to wavelengths. The spectral signature of stars indicates the composition of the stellar atmosphere. The spectral signature of an object is a function of the incidental EM wavelength and material interaction with that section of the electromagnetic spectrum.
Spectral imaging is imaging that uses multiple bands across the electromagnetic spectrum. While an ordinary camera captures light across three wavelength bands in the visible spectrum, red, green, and blue (RGB), spectral imaging encompasses a wide variety of techniques that go beyond RGB. Spectral imaging may use the infrared, the visible spectrum, the ultraviolet, x-rays, or some combination of the above. It may include the acquisition of image data in visible and non-visible bands simultaneously, illumination from outside the visible range, or the use of optical filters to capture a specific spectral range. It is also possible to capture hundreds of wavelength bands for each pixel in an image.
In imaging spectroscopy each pixel of an image acquires many bands of light intensity data from the spectrum, instead of just the three bands of the RGB color model. More precisely, it is the simultaneous acquisition of spatially coregistered images in many spectrally contiguous bands.

The normalized difference vegetation index (NDVI) is a simple graphical indicator that can be used to analyze remote sensing measurements, often from a space platform, assessing whether or not the target being observed contains live green vegetation.
Hyperspectral imaging, like other spectral imaging, collects and processes information from across the electromagnetic spectrum. The goal of hyperspectral imaging is to obtain the spectrum for each pixel in the image of a scene, with the purpose of finding objects, identifying materials, or detecting processes. There are three general branches of spectral imagers. There are push broom scanners and the related whisk broom scanners, which read images over time, band sequential scanners, which acquire images of an area at different wavelengths, and snapshot hyperspectral imaging, which uses a staring array to generate an image in an instant.
Chemical imaging is the analytical capability to create a visual image of components distribution from simultaneous measurement of spectra and spatial, time information. Hyperspectral imaging measures contiguous spectral bands, as opposed to multispectral imaging which measures spaced spectral bands.
The image fusion process is defined as gathering all the important information from multiple images, and their inclusion into fewer images, usually a single one. This single image is more informative and accurate than any single source image, and it consists of all the necessary information. The purpose of image fusion is not only to reduce the amount of data but also to construct images that are more appropriate and understandable for the human and machine perception. In computer vision, multisensor image fusion is the process of combining relevant information from two or more images into a single image. The resulting image will be more informative than any of the input images.

Airborne Real-time Cueing Hyperspectral Enhanced Reconnaissance, also known by the acronym ARCHER, is an aerial imaging system that produces ground images far more detailed than plain sight or ordinary aerial photography can. It is the most sophisticated unclassified hyperspectral imaging system available, according to U.S. Government officials. ARCHER can automatically scan detailed imaging for a given signature of the object being sought, for abnormalities in the surrounding area, or for changes from previous recorded spectral signatures.
Electro-optical MASINT is a subdiscipline of Measurement and Signature Intelligence, (MASINT) and refers to intelligence gathering activities which bring together disparate elements that do not fit within the definitions of Signals Intelligence (SIGINT), Imagery Intelligence (IMINT), or Human Intelligence (HUMINT).

The Operational Land Imager (OLI) is a remote sensing instrument aboard Landsat 8, built by Ball Aerospace & Technologies. Landsat 8 is the successor to Landsat 7 and was launched on February 11, 2013.
Multispectral remote sensing is the collection and analysis of reflected, emitted, or back-scattered energy from an object or an area of interest in multiple bands of regions of the electromagnetic spectrum. Subcategories of multispectral remote sensing include hyperspectral, in which hundreds of bands are collected and analyzed, and ultraspectral remote sensing where many hundreds of bands are used. The main purpose of multispectral imaging is the potential to classify the image using multispectral classification. This is a much faster method of image analysis than is possible by human interpretation.
A Vegetation Index (VI) is a spectral transformation of two or more bands designed to enhance the contribution of vegetation properties and allow reliable spatial and temporal inter-comparisons of terrestrial photosynthetic activity and canopy structural variations.

Remote sensing in geology is remote sensing used in the geological sciences as a data acquisition method complementary to field observation, because it allows mapping of geological characteristics of regions without physical contact with the areas being explored. About one-fourth of the Earth's total surface area is exposed land where information is ready to be extracted from detailed earth observation via remote sensing. Remote sensing is conducted via detection of electromagnetic radiation by sensors. The radiation can be naturally sourced, or produced by machines and reflected off of the Earth surface. The electromagnetic radiation acts as an information carrier for two main variables. First, the intensities of reflectance at different wavelengths are detected, and plotted on a spectral reflectance curve. This spectral fingerprint is governed by the physio-chemical properties of the surface of the target object and therefore helps mineral identification and hence geological mapping, for example by hyperspectral imaging. Second, the two-way travel time of radiation from and back to the sensor can calculate the distance in active remote sensing systems, for example, Interferometric synthetic-aperture radar. This helps geomorphological studies of ground motion, and thus can illuminate deformations associated with landslides, earthquakes, etc.
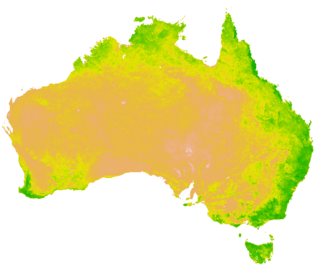
Land cover maps are tools that provide vital information on the Earth's land use and cover patterns. They aide policy development, urban planning, forest and agricultural monitoring etc.
References
- ↑ R.A. Schowengerdt. Remote sensing: Models and methods for image processing, Academic Press, 3rd ed., (2007)
- ↑ "13. Multispectral Image Processing | The Nature of Geographic Information". www.e-education.psu.edu. Retrieved 2019-11-14.
- 1 2 Baronti, A. Casini, F. Lotti, and S. Porcinai, Multispectral imaging system for the mapping of pigments in works of art by use of principal-component analysis, Applied Optics Vol. 37, Issue 8, pp. 1299–1309 (1998)
- 1 2 Weiskott, Eric. "Multispectral Imaging and Medieval Manuscripts." In The Routledge research companion to digital medieval literature. Boyle, Jennifer E., and Helen J. Burgess. London: Routledge. Pp. 186–96.
- ↑ Hagen, Nathan; Kudenov, Michael W. (2013). "Review of snapshot spectral imaging technologies". Optical Engineering. 52 (9): 090901. Bibcode:2013OptEn..52i0901H. doi: 10.1117/1.OE.52.9.090901 .
- 1 2 3 4 5 Goldberg, A.; Stann, B.; Gupta, N. (July 2003). "Multispectral, Hyperspectral, and Three-Dimensional Imaging Research at the U.S. Army Research Laboratory" (PDF). Proceedings of the International Conference on International Fusion [6th]. 1: 499–506.
- 1 2 "Primer on IR theory". Opto Engineering. Retrieved 2018-08-15.
- 1 2 3 Makki, Ihab; Younes, Rafic; Francis, Clovis; Bianchi, Tiziano; Zucchetti, Massimo (2017-02-01). "A survey of landmine detection using hyperspectral imaging". ISPRS Journal of Photogrammetry and Remote Sensing. 124: 40–53. Bibcode:2017JPRS..124...40M. doi:10.1016/j.isprsjprs.2016.12.009. ISSN 0924-2716.
- ↑ Li, Ning; Zhao, Yongqiang; Pan, Quan; Kong, Seong G. (2018-06-25). "Removal of reflections in LWIR image with polarization characteristics". Optics Express. 26 (13): 16488–16504. Bibcode:2018OExpr..2616488L. doi: 10.1364/OE.26.016488 . ISSN 1094-4087. PMID 30119479.
- ↑ Nguyen, Chuong; Havlicek, Joseph; Fan, Guoliang; Caulfield, John; Pattichis, Marios (November 2014). "Robust dual-band MWIR/LWIR infrared target tracking". 2014 48th Asilomar Conference on Signals, Systems and Computers: 78–83. doi:10.1109/ACSSC.2014.7094401. ISBN 978-1-4799-8297-4. S2CID 9071883.
- ↑ "3.1.1. Multispectral and panchromatic images". STARS project. Retrieved 14 May 2018.
- ↑ https://doi.org/10.1175/1520-0450(2001)040<2115:REFACO>2.0.CO;2
- ↑ Coffey, Valerie C. (1 April 2012). "Multispectral Imaging Moves into the Mainstream". Optics and Photonics News. 23 (4): 18. doi:10.1364/OPN.23.4.000018 . Retrieved 14 May 2018.
- ↑ "What are the band designations for the Landsat satellites?". U.S. Geological Survey. Archived from the original on January 22, 2017. Retrieved April 25, 2018.
- ↑ Grolier, Maurice J.; Tibbitts Jr., G. Chase; Ibrahim, Mohammed Mukred (1984). A qualitative appraisal of the hydrology of the Yemen Arab Republic from Landsat images Water Supply Paper 1757-P By. U.S. G.P.O. p. 19. Retrieved 14 May 2018.
- 1 2 Tatem, Andrew J.; Goetz, Scott J.; Hay, Simon I. (2008). "Fifty Years of Earth-observation Satellites". American Scientist. 96 (5): 390–398. doi:10.1511/2008.74.390. PMC 2690060 . PMID 19498953.
- ↑ "Multispectral vs Hyperspectral Imagery Explained". GIS Geography. 2014-07-23. Retrieved Feb 16, 2018.
- ↑ Multispectral imaging at ColourLex
- ↑ "Multi-spectral imaging of the Archimedes Palimpsest". The Archimedes Palimpsest Project. Retrieved 17 September 2015.
- ↑ Avril, Tom (May 14, 2018). "Scans reveal secrets of medieval 'Harry Potter' book and medical texts at Penn". The Philadelphia Inquirer. Retrieved 14 May 2018.
- ↑ Ran, Lingyan; Zhang, Yanning; Wei, Wei; Zhang, Qilin (2017-10-23). "A Hyperspectral Image Classification Framework with Spatial Pixel Pair Features". Sensors. 17 (10): 2421. doi:10.3390/s17102421. PMC 5677443 . PMID 29065535.
- ↑ Biehl, Larry; Landgrebe, David (2002-12-01). "MultiSpec: a tool for multispectral—hyperspectral image data analysis". Computers & Geosciences. 28 (10): 1153–1159. Bibcode:2002CG.....28.1153B. doi:10.1016/S0098-3004(02)00033-X . Retrieved 2017-04-28.
- ↑ Jordan, Johannes; Angelopoulou, Elli (2010). Gerbil - A Novel Software Framework for Visualization and Analysis in the Multispectral Domain. Vision. Vol. Modeling. doi:10.2312/PE/VMV/VMV10/259-266. ISBN 9783905673791.