In the theory of cluster analysis, the nearest-neighbor chain algorithm is an algorithm that can speed up several methods for agglomerative hierarchical clustering. These are methods that take a collection of points as input, and create a hierarchy of clusters of points by repeatedly merging pairs of smaller clusters to form larger clusters. The clustering methods that the nearest-neighbor chain algorithm can be used for include Ward's method, complete-linkage clustering, and single-linkage clustering; these all work by repeatedly merging the closest two clusters but use different definitions of the distance between clusters. The cluster distances for which the nearest-neighbor chain algorithm works are called reducible and are characterized by a simple inequality among certain cluster distances.
The main idea of the algorithm is to find pairs of clusters to merge by following paths in the nearest neighbor graph of the clusters. Every such path will eventually terminate at a pair of clusters that are nearest neighbors of each other, and the algorithm chooses that pair of clusters as the pair to merge. In order to save work by re-using as much as possible of each path, the algorithm uses a stack data structure to keep track of each path that it follows. By following paths in this way, the nearest-neighbor chain algorithm merges its clusters in a different order than methods that always find and merge the closest pair of clusters. However, despite that difference, it always generates the same hierarchy of clusters.
The nearest-neighbor chain algorithm constructs a clustering in time proportional to the square of the number of points to be clustered. This is also proportional to the size of its input, when the input is provided in the form of an explicit distance matrix. The algorithm uses an amount of memory proportional to the number of points, when it is used for clustering methods such as Ward's method that allow constant-time calculation of the distance between clusters. However, for some other clustering methods it uses a larger amount of memory in an auxiliary data structure with which it keeps track of the distances between pairs of clusters.
Background
A hierarchical clustering of six points. The points to be clustered are at the top of the diagram, and the nodes below them represent clusters.
Many problems in data analysis concern clustering, grouping data items into clusters of closely related items. Hierarchical clustering is a version of cluster analysis in which the clusters form a hierarchy or tree-like structure rather than a strict partition of the data items. In some cases, this type of clustering may be performed as a way of performing cluster analysis at multiple different scales simultaneously. In others, the data to be analyzed naturally has an unknown tree structure and the goal is to recover that structure by performing the analysis. Both of these kinds of analysis can be seen, for instance, in the application of hierarchical clustering to biological taxonomy. In this application, different living things are grouped into clusters at different scales or levels of similarity (species, genus, family, etc). This analysis simultaneously gives a multi-scale grouping of the organisms of the present age, and aims to accurately reconstruct the branching process or evolutionary tree that in past ages produced these organisms.[1]
The input to a clustering problem consists of a set of points.[2] A cluster is any proper subset of the points, and a hierarchical clustering is a maximal family of clusters with the property that any two clusters in the family are either nested or disjoint. Alternatively, a hierarchical clustering may be represented as a binary tree with the points at its leaves; the clusters of the clustering are the sets of points in subtrees descending from each node of the tree.[3]
In agglomerative clustering methods, the input also includes a distance function defined on the points, or a numerical measure of their dissimilarity. The distance or dissimilarity should be symmetric: the distance between two points does not depend on which of them is considered first. However, unlike the distances in a metric space, it is not required to satisfy the triangle inequality.[2] Next, the dissimilarity function is extended from pairs of points to pairs of clusters. Different clustering methods perform this extension in different ways. For instance, in the single-linkage clustering method, the distance between two clusters is defined to be the minimum distance between any two points from each cluster. Given this distance between clusters, a hierarchical clustering may be defined by a greedy algorithm that initially places each point in its own single-point cluster and then repeatedly forms a new cluster by merging the closest pair of clusters.[2]
The bottleneck of this greedy algorithm is the subproblem of finding which two clusters to merge in each step. Known methods for repeatedly finding the closest pair of clusters in a dynamic set of clusters either require superlinear space to maintain a data structure that can find closest pairs quickly, or they take greater than linear time to find each closest pair.[4][5] The nearest-neighbor chain algorithm uses a smaller amount of time and space than the greedy algorithm by merging pairs of clusters in a different order. In this way, it avoids the problem of repeatedly finding closest pairs. Nevertheless, for many types of clustering problem, it can be guaranteed to come up with the same hierarchical clustering as the greedy algorithm despite the different merge order.[2]
The algorithm
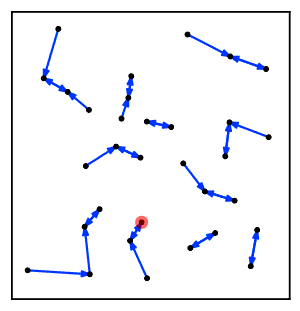
Animation of the algorithm using Ward's distance. Black dots are points, grey regions are larger clusters, blue arrows point to nearest neighbors, and the red bar indicates the current chain. For visual simplicity, when a merge leaves the chain empty, it continues with the recently merged cluster.
Intuitively, the nearest neighbor chain algorithm repeatedly follows a chain of clusters A → B → C → ... where each cluster is the nearest neighbor of the previous one, until reaching a pair of clusters that are mutual nearest neighbors.[2]
In more detail, the algorithm performs the following steps:[2][6]
Initialize the set of active clusters to consist of n one-point clusters, one for each input point.
Let S be a stack data structure, initially empty, the elements of which will be active clusters.
While there is more than one cluster in the set of clusters:
If S is empty, choose an active cluster arbitrarily and push it onto S.
Let C be the active cluster on the top of S. Compute the distances from C to all other clusters, and let D be the nearest other cluster.
If D is already in S, it must be the immediate predecessor of C. Pop both clusters from S and merge them.
Otherwise, if D is not already in S, push it onto S.
When it is possible for one cluster to have multiple equal nearest neighbors, then the algorithm requires a consistent tie-breaking rule. For instance, one may assign arbitrary index numbers to all of the clusters, and then select (among the equal nearest neighbors) the one with the smallest index number. This rule prevents certain kinds of inconsistent behavior in the algorithm; for instance, without such a rule, the neighboring cluster D might occur earlier in the stack than as the predecessor of C.[7]
Time and space analysis
Each iteration of the loop performs a single search for the nearest neighbor of a cluster, and either adds one cluster to the stack or removes two clusters from it. Every cluster is only ever added once to the stack, because when it is removed again it is immediately made inactive and merged. There are a total of 2n− 2 clusters that ever get added to the stack: n single-point clusters in the initial set, and n− 2 internal nodes other than the root in the binary tree representing the clustering. Therefore, the algorithm performs 2n− 2 pushing iterations and n− 1 popping iterations.[2]
Each of these iterations may spend time scanning as many as n− 1 inter-cluster distances to find the nearest neighbor. The total number of distance calculations it makes is therefore less than 3n2. For the same reason, the total time used by the algorithm outside of these distance calculations is O(n2).[2]
Since the only data structure is the set of active clusters and the stack containing a subset of the active clusters, the space required is linear in the number of input points.[2]
Correctness
For the algorithm to be correct, it must be the case that popping and merging the top two clusters from the algorithm's stack preserves the property that the remaining clusters on the stack form a chain of nearest neighbors. Additionally, it should be the case that all of the clusters produced during the algorithm are the same as the clusters produced by a greedy algorithm that always merges the closest two clusters, even though the greedy algorithm will in general perform its merges in a different order than the nearest-neighbor chain algorithm. Both of these properties depend on the specific choice of how to measure the distance between clusters.[2]
The correctness of this algorithm relies on a property of its distance function called reducibility. This property was identified by Bruynooghe (1977) in connection with an earlier clustering method that used mutual nearest neighbor pairs but not chains of nearest neighbors.[8] A distance function d on clusters is defined to be reducible if, for every three clusters A, B and C in the greedy hierarchical clustering such that A and B are mutual nearest neighbors, the following inequality holds:[2]
d(A ∪ B, C) ≥ min(d(A,C), d(B,C)).
If a distance function has the reducibility property, then merging two clusters C and D can only cause the nearest neighbor of E to change if that nearest neighbor was one of C and D. This has two important consequences for the nearest neighbor chain algorithm. First, it can be shown using this property that, at each step of the algorithm, the clusters on the stack S form a valid chain of nearest neighbors, because whenever a nearest neighbor becomes invalidated it is immediately removed from the stack.[2]
Second, and even more importantly, it follows from this property that, if two clusters C and D both belong to the greedy hierarchical clustering, and are mutual nearest neighbors at any point in time, then they will be merged by the greedy clustering, for they must remain mutual nearest neighbors until they are merged. It follows that each mutual nearest neighbor pair found by the nearest neighbor chain algorithm is also a pair of clusters found by the greedy algorithm, and therefore that the nearest neighbor chain algorithm computes exactly the same clustering (although in a different order) as the greedy algorithm.[2]
Application to specific clustering distances
Ward's method
Ward's method is an agglomerative clustering method in which the dissimilarity between two clusters A and B is measured by the amount by which merging the two clusters into a single larger cluster would increase the average squared distance of a point to its cluster centroid.[9] That is,
Expressed in terms of the centroid and cardinality of the two clusters, it has the simpler formula
allowing it to be computed in constant time per distance calculation. Although highly sensitive to outliers, Ward's method is the most popular variation of agglomerative clustering both because of the round shape of the clusters it typically forms and because of its principled definition as the clustering that at each step has the smallest variance within its clusters.[10] Alternatively, this distance can be seen as the difference in k-means cost between the new cluster and the two old clusters.
Ward's distance is also reducible, as can be seen more easily from a different formula for calculating the distance of a merged cluster from the distances of the clusters it was merged from:[9][11]
Distance update formulas such as this one are called formulas "of Lance–Williams type" after the work of Lance & Williams (1967). If is the smallest of the three distances on the right hand side (as would necessarily be true if and are mutual nearest-neighbors) then the negative contribution from its term is cancelled by the coefficient of one of the two other terms, leaving a positive value added to the weighted average of the other two distances. Therefore, the combined distance is always at least as large as the minimum of and , meeting the definition of reducibility.
Because Ward's distance is reducible, the nearest-neighbor chain algorithm using Ward's distance calculates exactly the same clustering as the standard greedy algorithm. For n points in a Euclidean space of constant dimension, it takes time O(n2) and space O(n).[6]
Complete linkage and average distance
Complete-linkage or furthest-neighbor clustering is a form of agglomerative clustering that defines the dissimilarity between clusters to be the maximum distance between any two points from the two clusters. Similarly, average-distance clustering uses the average pairwise distance as the dissimilarity. Like Ward's distance, these two forms of clustering obey a formula of Lance–Williams type. In complete linkage, the distance is the maximum of the two distances and . Therefore, it is at least equal to the minimum of these two distances, the requirement for being reducible. For average distance, is just a weighted average of the distances and . Again, this is at least as large as the minimum of the two distances. Thus, in both of these cases, the distance is reducible.[9][11]
Unlike Ward's method, these two forms of clustering do not have a constant-time method for computing distances between pairs of clusters. Instead it is possible to maintain an array of distances between all pairs of clusters. Whenever two clusters are merged, the formula can be used to compute the distance between the merged cluster and all other clusters. Maintaining this array over the course of the clustering algorithm takes time and space O(n2). The nearest-neighbor chain algorithm may be used in conjunction with this array of distances to find the same clustering as the greedy algorithm for these cases. Its total time and space, using this array, is also O(n2).[12]
The same O(n2) time and space bounds can also be achieved in a different way, by a technique that overlays a quadtree-based priority queue data structure on top of the distance matrix and uses it to perform the standard greedy clustering algorithm. This quadtree method is more general, as it works even for clustering methods that are not reducible.[4] However, the nearest-neighbor chain algorithm matches its time and space bounds while using simpler data structures.[12]
Single linkage
In single-linkage or nearest-neighbor clustering, the oldest form of agglomerative hierarchical clustering,[11] the dissimilarity between clusters is measured as the minimum distance between any two points from the two clusters. With this dissimilarity,
meeting as an equality rather than an inequality the requirement of reducibility. (Single-linkage also obeys a Lance–Williams formula,[9][11] but with a negative coefficient from which it is more difficult to prove reducibility.)
As with complete linkage and average distance, the difficulty of calculating cluster distances causes the nearest-neighbor chain algorithm to take time and space O(n2) to compute the single-linkage clustering. However, the single-linkage clustering can be found more efficiently by an alternative algorithm that computes the minimum spanning tree of the input distances using Prim's algorithm, and then sorts the minimum spanning tree edges and uses this sorted list to guide the merger of pairs of clusters. Within Prim's algorithm, each successive minimum spanning tree edge can be found by a sequential search through an unsorted list of the smallest edges connecting the partially constructed tree to each additional vertex. This choice saves the time that the algorithm would otherwise spend adjusting the weights of vertices in its priority queue. Using Prim's algorithm in this way would take time O(n2) and space O(n), matching the best bounds that could be achieved with the nearest-neighbor chain algorithm for distances with constant-time calculations.[13]
Centroid distance
Another distance measure commonly used in agglomerative clustering is the distance between the centroids of pairs of clusters, also known as the weighted group method.[9][11] It can be calculated easily in constant time per distance calculation. However, it is not reducible. For instance, if the input forms the set of three points of an equilateral triangle, merging two of these points into a larger cluster causes the inter-cluster distance to decrease, a violation of reducibility. Therefore, the nearest-neighbor chain algorithm will not necessarily find the same clustering as the greedy algorithm. Nevertheless, Murtagh (1983) writes that the nearest-neighbor chain algorithm provides "a good heuristic" for the centroid method.[2] A different algorithm by Day & Edelsbrunner (1984) can be used to find the greedy clustering in O(n2) time for this distance measure.[5]
Distances sensitive to merge order
The above presentation explicitly disallowed distances sensitive to merge order. Indeed, allowing such distances can cause problems. In particular, there exist order-sensitive cluster distances which satisfy reducibility, but for which the above algorithm will return a hierarchy with suboptimal costs. Therefore, when cluster distances are defined by a recursive formula (as some of the ones discussed above are), care must be taken that they do not use the hierarchy in a way which is sensitive to merge order.[14]
History
The nearest-neighbor chain algorithm was developed and implemented in 1982 by Jean-Paul Benzécri[15] and J. Juan.[16] They based this algorithm on earlier methods that constructed hierarchical clusterings using mutual nearest neighbor pairs without taking advantage of nearest neighbor chains.[8][17]
References
↑ Gordon, Allan D. (1996), "Hierarchical clustering", in Arabie, P.; Hubert, L. J.; De Soete, G. (eds.), Clustering and Classification, River Edge, NJ: World Scientific, pp.65–121, ISBN9789814504539 .
↑ For this tie-breaking rule, and an example of how tie-breaking is needed to prevent cycles in the nearest neighbor graph, see Sedgewick, Robert (2004), "Figure20.7", Algorithms in Java, Part 5: Graph Algorithms (3rded.), Addison-Wesley, p.244, ISBN0-201-36121-3 .
↑ Tuffery, Stéphane (2011), "9.10 Agglomerative hierarchical clustering", Data Mining and Statistics for Decision Making, Wiley Series in Computational Statistics, pp.253–261, ISBN978-0-470-68829-8 .
↑ Gower, J. C.; Ross, G. J. S. (1969), "Minimum spanning trees and single linkage cluster analysis", Journal of the Royal Statistical Society, Series C, 18 (1): 54–64, JSTOR2346439, MR0242315 .
This page is based on this Wikipedia article Text is available under the CC BY-SA 4.0 license; additional terms may apply. Images, videos and audio are available under their respective licenses.