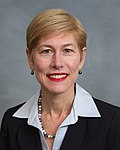
North Carolina's 38th State House of Representatives district | |||
---|---|---|---|
![]() | |||
Representative |
| ||
Demographics | 31% White 40% Black 20% Hispanic 3% Asian 5% Multiracial | ||
Population (2020) | 93,830 |
North Carolina's 38th House district is one of 120 districts in the North Carolina House of Representatives. It has been represented by Democrat Abe Jones since 2021. [1]
Since 2003, the district has included part of Wake County. The district overlaps with the 14th and 15th Senate districts.
Representative | Party | Dates | Notes | Counties |
---|---|---|---|---|
![]() Harold Brubaker ( Asheboro ) | Republican | January 1, 1983 – January 1, 2003 | Redistricted from the 24th district. Redistricted to the 78th district. | 1983–1993 Part of Randolph County. [2] |
1993–2003 Parts of Randolph and Guilford counties. [3] | ||||
![]() Deborah Ross ( Raleigh ) | Democratic | January 1, 2003 – January 1, 2013 | Redistricted to the 34th district. | 2003–Present Part of Wake County. [4] [5] [6] [7] [8] [9] [10] |
![]() Yvonne Lewis Holley ( Raleigh ) | Democratic | January 1, 2013 – January 1, 2021 | Retired to run for Lieutenant Governor. | |
![]() Abe Jones ( Raleigh ) | Democratic | January 1, 2021 – Present |
Party | Candidate | Votes | % | |
---|---|---|---|---|
Democratic | Abe Jones (incumbent) | 32,854 | 100% | |
Total votes | 32,854 | 100% | ||
Democratic hold |
Party | Candidate | Votes | % | |
---|---|---|---|---|
Democratic | Abe Jones (incumbent) | 24,036 | 87.45% | |
Libertarian | Christopher Mizelle | 3,450 | 12.55% | |
Total votes | 27,486 | 100% | ||
Democratic hold |
Party | Candidate | Votes | % | |
---|---|---|---|---|
Democratic | Abe Jones | 8,718 | 57.24% | |
Democratic | Quanta Monique Edwards | 6,512 | 42.76% | |
Total votes | 15,230 | 100% |
Party | Candidate | Votes | % | |
---|---|---|---|---|
Democratic | Abe Jones | 33,058 | 77.71% | |
Republican | Kenneth Bagnal | 7,535 | 17.71% | |
Libertarian | Richard Haygood | 1,949 | 4.58% | |
Total votes | 42,542 | 100% | ||
Democratic hold |
Party | Candidate | Votes | % | |
---|---|---|---|---|
Democratic | Yvonne Lewis Holley (incumbent) | 23,985 | 81.90% | |
Republican | Ken Bagnal | 4,532 | 15.48% | |
Libertarian | Bobby Yates Emory | 768 | 2.62% | |
Total votes | 29,285 | 100% | ||
Democratic hold |
Party | Candidate | Votes | % | |
---|---|---|---|---|
Democratic | Yvonne Lewis Holley (incumbent) | 28,990 | 84.80% | |
Libertarian | Olen Watson III | 5,196 | 15.20% | |
Total votes | 34,186 | 100% | ||
Democratic hold |
Party | Candidate | Votes | % | |
---|---|---|---|---|
Democratic | Yvonne Lewis Holley (incumbent) | 17,883 | 79.90% | |
Republican | Joe Thompson | 4,498 | 20.10% | |
Total votes | 22,381 | 100% | ||
Democratic hold |
Party | Candidate | Votes | % | |
---|---|---|---|---|
Democratic | Yvonne Lewis Holley | 6,328 | 60.81% | |
Democratic | Abeni El-Amin | 2,663 | 25.59% | |
Democratic | Lee Sartain | 1,415 | 13.60% | |
Total votes | 10,406 | 100% |
Party | Candidate | Votes | % | ||
---|---|---|---|---|---|
Democratic | Yvonne Lewis Holley | 29,665 | 87.68% | ||
Unaffiliated | Shane Murphy | 4,169 | 12.32% | ||
Total votes | 33,834 | 100% | |||
Democratic win (new seat) |
Party | Candidate | Votes | % | |
---|---|---|---|---|
Democratic | Deborah Ross (incumbent) | 14,093 | 65.63% | |
Republican | Madison E. Shook | 7,382 | 34.37% | |
Total votes | 21,475 | 100% | ||
Democratic hold |
Party | Candidate | Votes | % | |
---|---|---|---|---|
Democratic | Deborah Ross (incumbent) | 26,754 | 84.88% | |
Libertarian | Susan J. Hogarth | 4,764 | 15.12% | |
Total votes | 31,518 | 100% | ||
Democratic hold |
Party | Candidate | Votes | % | |
---|---|---|---|---|
Democratic | Deborah Ross (incumbent) | 2,197 | 95.44% | |
Democratic | Demian Dellinger | 105 | 4.56% | |
Total votes | 2,302 | 100% |
Party | Candidate | Votes | % | |
---|---|---|---|---|
Democratic | Deborah Ross (incumbent) | 11,819 | 100% | |
Total votes | 11,819 | 100% | ||
Democratic hold |
Party | Candidate | Votes | % | |
---|---|---|---|---|
Democratic | Deborah Ross (incumbent) | 20,121 | 66.51% | |
Republican | Phil Jeffreys | 10,131 | 33.49% | |
Total votes | 30,252 | 100% | ||
Democratic hold |
Party | Candidate | Votes | % | |
---|---|---|---|---|
Democratic | Deborah Ross | 2,926 | 46.64% | |
Democratic | Alexander Killens | 2,108 | 33.60% | |
Democratic | Gene Jordan | 1,239 | 19.75% | |
Total votes | 6,273 | 100% |
Party | Candidate | Votes | % | |
---|---|---|---|---|
Democratic | Deborah Ross | 12,566 | 89.68% | |
Libertarian | Casey Gardner | 1,446 | 10.32% | |
Total votes | 14,012 | 100% | ||
Democratic hold |
Party | Candidate | Votes | % | |
---|---|---|---|---|
Republican | Harold Brubaker (incumbent) | 17,781 | 69.61% | |
Democratic | Tommy Lawrence | 7,763 | 30.39% | |
Total votes | 25,544 | 100% | ||
Republican hold |