North Carolina's 9th State House of Representatives district | |||
---|---|---|---|
![]() | |||
Representative |
| ||
Demographics | 54% White 33% Black 7% Hispanic 2% Asian 3% Multiracial | ||
Population (2020) | 80,242 |
North Carolina's 9th House district is one of 120 districts in the North Carolina House of Representatives. It has been represented by Republican Timothy Reeder since 2023. [1]
Since 2003, the district has included part of Pitt County. The district overlaps with the 5th Senate district.
Representative | Party | Dates | Notes | Representative | Party | Dates | Notes | Counties |
---|---|---|---|---|---|---|---|---|
Nancy Winbon Chase ( Eureka ) | Democratic | January 1, 1973 – January 1, 1979 | Redistricted from the 10th district. | William Powell Kemp Jr. ( Goldsboro ) | Democratic | January 1, 1973 – January 1, 1975 | Redistricted from the 10th district. | 1973–1983 All of Wayne County. [2] |
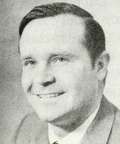
![]() Henson Barnes ( Goldsboro ) | Democratic | January 1, 1975 – January 1, 1977 | Retired to run for the State Senate. | |||||
Richard Ralph Grady ( Seven Springs ) | Democratic | January 1, 1977 – January 1, 1983 | Redistricted to the 11th district. | |||||
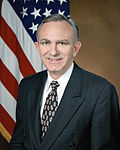
Martin Lancaster ( Goldsboro ) | Democratic | January 1, 1979 – January 1, 1983 | Redistricted to the 11th district. | |||||
Ed Warren ( Greenville ) | Democratic | January 1, 1983 – January 1, 1991 | Redistricted from the 8th district. Retired to run for the state senate. | Sam Bundy ( Farmville ) | Democratic | January 1, 1983 – January 19, 1993 | Redistricted from the 8th district. Died. | 1983–1993 All of Greene County. Part of Pitt County. [3] |
Vacant | January 19, 1983 – January 31, 1993 | |||||||
![]() Walter B. Jones Jr. ( Farmville ) | Democratic | January 31, 1983 – January 1, 1993 | Appointed to finish Bundy's term. Redistricted to the single-member district and retired to run for Congress. | |||||
Charles McLawhorn ( Winterville ) | Democratic | January 1, 1991 – January 1, 1993 | Redistricted to the single-member district. |
Representative | Party | Dates | Notes | Counties |
---|---|---|---|---|
Charles McLawhorn ( Winterville ) | Democratic | January 1, 1993 – January 1, 1995 | Redistricted from the multi-member district. Lost re-election. | 1993–2003 Parts of Greene and Pitt counties. [4] |
Henry Aldridge ( Greenville ) | Republican | January 1, 1995 – January 1, 1999 | Lost re-election. | |
Marian McLawhorn ( Grifton ) | Democratic | January 1, 1999 – January 1, 2013 | Lost re-election. | |
2003–Present Parts of Pitt County. [5] [6] [7] [8] [9] [10] [11] | ||||
Brian Brown ( Greenville ) | Republican | January 1, 2013 – October 6, 2015 | Resigned. | |
Vacant | October 6, 2015 – October 19, 2015 | |||
![]() Greg Murphy ( Greenville ) | Republican | October 19, 2015 – September 17, 2019 | Appointed to finish Brown's term. Resigned to assume seat in Congress. | |
Vacant | September 17, 2019 – October 1, 2019 | |||
Perrin Jones ( Greenville ) | Republican | October 1, 2019 – January 1, 2021 | Appointed to finish Murphy's term. Lost re-election. | |
![]() Brian Farkas ( Greenville ) | Democratic | January 1, 2021 – January 1, 2023 | Lost re-election. | |
![]() Timothy Reeder ( Ayden ) | Republican | January 1, 2023 – Present |
Party | Candidate | Votes | % | |
---|---|---|---|---|
Democratic | Claire Kempner | 3,624 | 70.95% | |
Democratic | Lenton Brown | 1,484 | 29.05% | |
Total votes | 5,108 | 100% |
Party | Candidate | Votes | % | |
---|---|---|---|---|
Republican | Timothy Reeder (incumbent) | 6,919 | 78.70% | |
Republican | Tony Moore | 1,873 | 21.30% | |
Total votes | 8,792 | 100% |
Party | Candidate | Votes | % | |
---|---|---|---|---|
Republican | Timothy Reeder (incumbent) | 26,888 | 55.95% | |
Democratic | Claire Kempner | 21,173 | 44.05% | |
Total votes | 48,061 | 100% | ||
Republican hold |
Party | Candidate | Votes | % | |
---|---|---|---|---|
Republican | Timothy Reeder | 3,318 | 57.93% | |
Republican | Tony Moore | 2,410 | 42.07% | |
Total votes | 5,728 | 100% |
Party | Candidate | Votes | % | |
---|---|---|---|---|
Republican | Timothy Reeder | 15,212 | 50.59% | |
Democratic | Brian Farkas (incumbent) | 14,858 | 49.41% | |
Total votes | 30,070 | 100% | ||
Republican gain from Democratic |
Party | Candidate | Votes | % | |
---|---|---|---|---|
Democratic | Brian Farkas | 5,466 | 62.34% | |
Democratic | Jake Hochard | 3,302 | 37.66% | |
Total votes | 8,768 | 100% |
Party | Candidate | Votes | % | |
---|---|---|---|---|
Democratic | Brian Farkas | 19,198 | 51.16% | |
Republican | Perrin Jones (incumbent) | 18,329 | 48.84% | |
Total votes | 37,527 | 100% | ||
Democratic gain from Republican |
Party | Candidate | Votes | % | |
---|---|---|---|---|
Republican | Greg Murphy (incumbent) | 17,234 | 59.96% | |
Democratic | Kris Rixon | 11,510 | 40.04% | |
Total votes | 28,744 | 100% | ||
Republican hold |
Party | Candidate | Votes | % | |
---|---|---|---|---|
Democratic | Brian Farkas | 5,394 | 61.63% | |
Democratic | Walter E. Gaskins | 3,358 | 38.37% | |
Total votes | 8,752 | 100% |
Party | Candidate | Votes | % | |
---|---|---|---|---|
Republican | Greg Murphy (incumbent) | 22,869 | 57.35% | |
Democratic | Brian Farkas | 17,007 | 42.65% | |
Total votes | 39,876 | 100% | ||
Republican hold |
Party | Candidate | Votes | % | |
---|---|---|---|---|
Republican | Brian Brown (incumbent) | 3,134 | 71.68% | |
Republican | Ashley Bleau | 1,238 | 28.32% | |
Total votes | 4,372 | 100% |
Party | Candidate | Votes | % | |
---|---|---|---|---|
Republican | Brian Brown (incumbent) | 13,474 | 60.07% | |
Democratic | Uriah Ward | 8,957 | 39.93% | |
Total votes | 22,431 | 100% | ||
Republican hold |
Party | Candidate | Votes | % | |
---|---|---|---|---|
Republican | Brian Brown | 3,702 | 60.43% | |
Republican | Jack Wall | 2,424 | 39.57% | |
Total votes | 6,126 | 100% |
Party | Candidate | Votes | % | |
---|---|---|---|---|
Republican | Brian Brown | 19,780 | 51.48% | |
Democratic | Marian McLawhorn (incumbent) | 18,644 | 48.52% | |
Total votes | 38,424 | 100% | ||
Republican gain from Democratic |
Party | Candidate | Votes | % | |
---|---|---|---|---|
Democratic | Marian McLawhorn (incumbent) | 11,808 | 50.75% | |
Republican | Stan Larson | 11,460 | 49.25% | |
Total votes | 23,268 | 100% | ||
Democratic hold |
Party | Candidate | Votes | % | |
---|---|---|---|---|
Democratic | Marian McLawhorn (incumbent) | 24,916 | 62.27% | |
Republican | Ginny Cooper | 15,094 | 37.73% | |
Total votes | 40,010 | 100% | ||
Democratic hold |
Party | Candidate | Votes | % | |
---|---|---|---|---|
Democratic | Marian McLawhorn (incumbent) | 8,424 | 56.75% | |
Republican | Tony Moore | 6,419 | 43.25% | |
Total votes | 14,843 | 100% | ||
Democratic hold |
Party | Candidate | Votes | % | |
---|---|---|---|---|
Democratic | Marian McLawhorn (incumbent) | 18,775 | 100% | |
Total votes | 18,775 | 100% | ||
Democratic hold |
Party | Candidate | Votes | % | |
---|---|---|---|---|
Democratic | Marian McLawhorn (incumbent) | 10,957 | 64.94% | |
Republican | Judy Eagle | 5,715 | 33.87% | |
Libertarian | Deb Seksay | 201 | 1.19% | |
Total votes | 16,873 | 100% | ||
Democratic hold |
Party | Candidate | Votes | % | |
---|---|---|---|---|
Democratic | Marian McLawhorn (incumbent) | 5,870 | 84.24% | |
Democratic | Robert Wheeler Jr. | 1,098 | 15.76% | |
Total votes | 6,968 | 100% |
Party | Candidate | Votes | % | |
---|---|---|---|---|
Democratic | Marian McLawhorn (incumbent) | 14,167 | 54.81% | |
Republican | Wayne Holloman | 11,683 | 45.20% | |
Total votes | 25,850 | 100% | ||
Democratic hold |