![]() | |
Type of site | Crowd-sourced online database of cost of living, real property prices, and quality of life statistics |
---|---|
Available in | Multilingual |
Founded | April 2009 |
Country of origin | Serbia |
Owner | NUMBEO DOO Beograd-Palilula |
Founder(s) | Mladen Adamović |
URL | www |
Registration | Optional |
Launched | April 2009 |
Numbeo is a Serbian crowd-sourced online database of perceived consumer prices, real property prices, and quality of life metrics. The website was founded in April 2009 by former Google employee Mladen Adamović, [1] [2] to enable users to share and compare information about the cost of living between countries and cities. [3] Since 2012, the website has been operated by NUMBEO DOO Beograd-Palilula, a Serbian private limited company run by Adamović. [4] [2] [5] According to Adamović, the website earns money through advertising and the sale of subscriptions to its API. [6]
Numbeo's crowd-sourced data can be inserted or altered by anyone accessing the website, and is not peer-reviewed. [7] [8] [9] Data is also manually gathered by the operator, from sources such as company and governmental websites, [10] [11] [12] which is done in half-year intervals; [13] it is then combined with user-generated data by giving it extra weight in the final score calculation, according to the company. [14] As of 2017, it was the largest database of user generated data about cities in the world. [15] As of 2020, this possibly applied to (user generated) data on housing prices as well. [16] The quality of life index is a combination of eight sub-indexes: purchasing power, safety, healthcare, cost of living, property price to income ratio, traffic commute time, pollution, and climate. [17] [18]
The website's "Crime Index", intended to serve as an overall crime level estimate, is compiled from answers to user surveys, which have been processed by a Java-programmed backend to produce country- or city-level ratings on a 100-point scale, with higher values indicating worse crime. There is also a "Safety Index", with higher scores indicating a safer city. [19] Numbeo's data points on crime have been criticized by academics [20] and by the media as unreliable and, at times, misleading.
Gross domestic product (GDP) is a monetary measure of the market value of all the final goods and services produced in a specific time period by a country or countries. GDP is most often used by the government of a single country to measure its economic health. Due to its complex and subjective nature, this measure is often revised before being considered a reliable indicator.
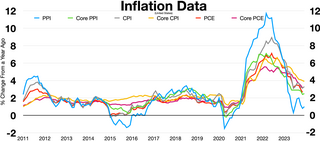
In economics, inflation is a general increase in the prices of goods and services in an economy. This is usually measured using the consumer price index (CPI). When the general price level rises, each unit of currency buys fewer goods and services; consequently, inflation corresponds to a reduction in the purchasing power of money. The opposite of CPI inflation is deflation, a decrease in the general price level of goods and services. The common measure of inflation is the inflation rate, the annualized percentage change in a general price index. As prices faced by households do not all increase at the same rate, the consumer price index (CPI) is often used for this purpose.
Purchasing power parity (PPP) is a measure of the price of specific goods in different countries and is used to compare the absolute purchasing power of the countries' currencies. PPP is effectively the ratio of the price of a basket of goods at one location divided by the price of the basket of goods at a different location. The PPP inflation and exchange rate may differ from the market exchange rate because of tariffs, and other transaction costs.
A consumer price index (CPI) is a price index, the price of a weighted average market basket of consumer goods and services purchased by households. Changes in measured CPI track changes in prices over time. The CPI is calculated by using a representative basket of goods and services. The basket is updated periodically to reflect changes in consumer spending habits. The prices of the goods and services in the basket are collected monthly from a sample of retail and service establishments. The prices are then adjusted for changes in quality or features. Changes in the CPI can be used to track inflation over time and to compare inflation rates between different countries. The CPI is not a perfect measure of inflation or the cost of living, but it is a useful tool for tracking these economic indicators.
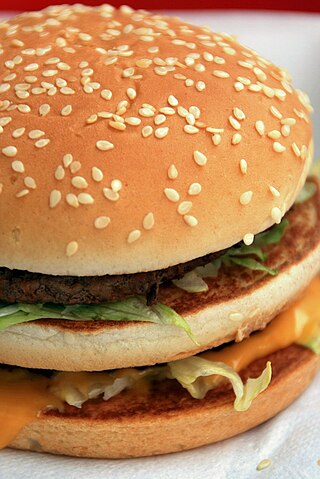
The Big Mac Index is a price index published since 1986 by The Economist as an informal way of measuring the purchasing power parity (PPP) between two currencies and providing a test of the extent to which market exchange rates result in goods costing the same in different countries. It "seeks to make exchange-rate theory a bit more digestible." The index compares the relative price worldwide to purchase the Big Mac, a hamburger sold at McDonald's restaurants.
A cost-of-living index is a theoretical price index that measures relative cost of living over time or regions. It is an index that measures differences in the price of goods and services, and allows for substitutions with other items as prices vary.
City quality of life indices are lists of cities that are ranked according to a defined measure of living conditions. In addition to considering the provision of clean water, clean air, adequate food and shelter, many indexes also measure more subjective elements including a city's capacity to generate a sense of community and offer hospitable settings for all, especially young people, to develop social skills, a sense of autonomy and identity.
Crime in St. Louis includes an overview of crime both in the city of St. Louis and in the Greater St. Louis metropolitan area. Crime in the city increased from the 1960s through the early 1990s as measured by the index crime rate, followed by a decline in crime rates through 2014. Despite decreasing crime, rates of violent crime and property crime in both the city and the metropolitan area remain higher than the national metropolitan area average. In addition, the city of St. Louis consistently has been ranked among the most dangerous cities in the United States. As of April 2017, St. Louis has the highest murder rate in America. At the end of 2017, St. Louis metropolitan had 205 murders, 159 of which were within the city limits. In 2018, the new Chief of Police, John Hayden said two-thirds (67%) of all the murders and one-half of all the assaults are concentrated in a triangular area in the north part of the city.
The United States Consumer Price Index (CPI) is a set of various consumer price indices published monthly by the U.S. Bureau of Labor Statistics (BLS). The most commonly used are the CPI-U and the CPI-W, though many alternative versions exist. The CPI-U is the most popular measure of consumer inflation in the United States.
Official statistics are statistics published by government agencies or other public bodies such as international organizations as a public good. They provide quantitative or qualitative information on all major areas of citizens' lives, such as economic and social development, living conditions, health, education, and the environment.
Different methods of electricity generation can incur a variety of different costs, which can be divided into three general categories: 1) wholesale costs, or all costs paid by utilities associated with acquiring and distributing electricity to consumers, 2) retail costs paid by consumers, and 3) external costs, or externalities, imposed on society.
Canada ranks among the highest in international measurements of government transparency, civil liberties, quality of life, economic freedom, education levels, gender equality, public services, public security and environmental sustainability. It ranks among the lowest of the most developed countries for housing affordability, healthcare services and foreign direct investment.
The OECD Better Life Index, created in May 2011 by the Organisation for Economic Co-operation and Development, is an initiative pioneering the development of economic indicators which better capture multiple dimensions of economic and social progress.
Food prices refer to the average price level for food across countries, regions and on a global scale. Food prices affect producers and consumers of food. Price levels depend on the food production process, including food marketing and food distribution. Fluctuation in food prices is determined by a number of compounding factors. Geopolitical events, global demand, exchange rates, government policy, diseases and crop yield, energy costs, availability of natural resources for agriculture, food speculation, changes in the use of soil and weather events directly affect food prices. To a certain extent, adverse price trends can be counteracted by food politics.
According to the Worldwide Cost of Living 2020 report issued by the Economist Intelligence Unit (EIU), Singapore, Hong Kong, and Osaka share the title of costliest city in the world. The list was prepared based on their Worldwide Cost of Living (WCOL) Index scores. The Worldwide Cost of Living survey was done in order to compare the cost of living indices in cities all over the world.
Brave Search is a search engine developed by Brave Software, Inc., which is set as the default search engine for Brave web browser users in certain countries.
AreaVibes is a data analytics and real estate company based in Toronto, which provides clients with demographic data and analysis focused on real estate in American and Canadian cities.
Serbian-run website Numbeo lists the inner-city apartment prices in Harare at $1,000 a square metre. The numbers are based on user contributed figures and should be taken with a hefty pinch of salt.
Numbeo also uses links to government websites, supermarket and restaurant sites with prices and other relevant sources, together with publicly available links to pricing for taxi and bus services.
Numbeo gathers statistics from a range of sources, such as websites of supermarkets, taxi company websites, governmental institutions, newspaper articles and other surveys.
Numbeo says it manually collects data from "authoritative sources".
Numbeo's data collection process involves a combination of user-generated input and manually gathered information from reputable sources such as supermarket and taxi company websites, and governmental institutions. The manually collected data from each source are entered twice yearly and given a weight that is three times higher than user-generated input to improve the reliability of the data.