Panadura Polling Division

Last updated
Panadura
Panadura Polling Division Sri Lanka.svg
Coordinates: 6°42′23″N79°55′28″E / 6.706438°N 79.924384°E / 6.706438; 79.924384
Country Sri Lanka
Province Western Province, Sri Lanka
Electoral District Kalutara Electoral District
Area
  Total48.85 km2 (18.86 sq mi)
Population
 (2012) [1]
  Total182,285
  Density3,732/km2 (9,670/sq mi)
ISO 3166 code EC-03A

The Panadura Polling Division is a Polling Division in the Kalutara Electoral District, in the Western Province, Sri Lanka.

Contents

Presidential Election Results

Summary

The winner of Panadura has matched the final country result 7 out of 8 times. Hence, Panadura is a Strong Bellwether for Presidential Elections.

Year Panadura Kalutara Electoral District MAE [2]  % Sri Lanka MAE [3]  %
2019 SLPP SLPP 1.28% SLPP 5.50%
2015 NDF UPFA 3.54% NDF 1.34%
2010 UPFA UPFA 1.99% UPFA 2.89%
2005 UPFA UPFA 2.03% UPFA 7.15%
1999 PA PA 3.93% PA 5.64%
1994 PA PA 5.69% PA 4.74%
1988 SLFP SLFP 3.70% UNP 7.70%
1982 UNP UNP 0.80% UNP 4.09%
Matches/Mean MAE 7/8 6/8 2.87% 8/8 4.88%

2019 Sri Lankan Presidential Election

Party Panadura [4] Kalutara Electoral District Sri Lanka
Votes % Votes % Votes %
SLPP 57,447 58.01% 482,920 59.49% 6,924,255 52.25%
NDF 35,761 36.11% 284,213 35.01% 5,564,239 41.99%
NMPP 3,904 3.94% 27,681 3.41% 418,553 3.16%
Other Parties (with < 1%) 1,916 1.93% 16,949 2.09% 345,452 2.61%
Valid Votes 99,028 99.17% 811,763 99.16% 13,252,499 98.99%
Rejected Votes 827 0.83% 6,847 0.84% 135,452 1.01%
Total Polled 99,855 84.11% 818,610 85.71% 13,387,951 83.71%
Registered Electors 118,719 955,080 15,992,568

2015 Sri Lankan Presidential Election

Party Panadura [5] Kalutara Electoral District Sri Lanka
Votes % Votes % Votes %
NDF 46,820 50.15% 349,404 46.46% 6,217,162 51.28%
UPFA 45,908 49.18% 395,890 52.65% 5,768,090 47.58%
Other Parties (with < 1%) 627 0.67% 6,690 0.89% 138,200 1.14%
Valid Votes 93,355 98.78% 751,984 98.90% 12,123,452 98.85%
Rejected Votes 1,152 1.22% 8,381 1.10% 140,925 1.15%
Total Polled 94,507 82.30% 760,365 82.08% 12,264,377 78.69%
Registered Electors 114,828 926,346 15,585,942

2010 Sri Lankan Presidential Election

Party Panadura [6] Kalutara Electoral District Sri Lanka
Votes % Votes % Votes %
UPFA 50,772 61.21% 412,562 63.06% 6,015,934 57.88%
NDF 31,319 37.76% 231,807 35.43% 4,173,185 40.15%
Other Parties (with < 1%) 856 1.03% 9,880 1.51% 204,494 1.97%
Valid Votes 82,947 99.34% 654,249 99.31% 10,393,613 99.03%
Rejected Votes 553 0.66% 4,541 0.69% 101,838 0.97%
Total Polled 83,500 79.10% 658,790 79.05% 10,495,451 66.70%
Registered Electors 105,569 833,360 15,734,587

2005 Sri Lankan Presidential Election

Party Panadura [7] Kalutara Electoral District Sri Lanka
Votes % Votes % Votes %
UPFA 46,097 57.68% 341,693 55.48% 4,887,152 50.29%
UNP 33,034 41.33% 266,043 43.20% 4,706,366 48.43%
Other Parties (with < 1%) 790 0.99% 8,124 1.32% 123,521 1.27%
Valid Votes 79,921 99.06% 615,860 98.95% 9,717,039 98.88%
Rejected Votes 762 0.94% 6,517 1.05% 109,869 1.12%
Total Polled 80,683 79.63% 622,377 79.67% 9,826,908 69.51%
Registered Electors 101,328 781,175 14,136,979

1999 Sri Lankan Presidential Election

Party Panadura [8] Kalutara Electoral District Sri Lanka
Votes % Votes % Votes %
PA 39,081 56.58% 281,217 52.88% 4,312,157 51.12%
UNP 24,976 36.16% 217,423 40.88% 3,602,748 42.71%
JVP 3,647 5.28% 23,770 4.47% 343,927 4.08%
Other Parties (with < 1%) 1,369 1.98% 9,399 1.77% 176,679 2.09%
Valid Votes 69,073 97.17% 531,809 97.83% 8,435,754 97.69%
Rejected Votes 2,014 2.83% 11,796 2.17% 199,536 2.31%
Total Polled 71,087 77.46% 543,605 78.23% 8,635,290 72.17%
Registered Electors 91,768 694,860 11,965,536

1994 Sri Lankan Presidential Election

Party Panadura [9] Kalutara Electoral District Sri Lanka
Votes % Votes % Votes %
PA 42,951 67.27% 295,686 61.47% 4,709,205 62.28%
UNP 20,032 31.37% 178,466 37.10% 2,715,283 35.91%
Other Parties (with < 1%) 865 1.35% 6,867 1.43% 137,040 1.81%
Valid Votes 63,848 98.58% 481,019 98.50% 7,561,526 98.03%
Rejected Votes 922 1.42% 7,309 1.50% 151,706 1.97%
Total Polled 64,770 72.33% 488,328 73.97% 7,713,232 69.12%
Registered Electors 89,554 660,191 11,158,880

1988 Sri Lankan Presidential Election

Party Panadura [10] Kalutara Electoral District Sri Lanka
Votes % Votes % Votes %
SLFP 28,366 51.94% 179,761 49.57% 2,289,857 44.95%
UNP 22,701 41.57% 169,510 46.74% 2,569,199 50.43%
SLMP 3,548 6.50% 13,375 3.69% 235,701 4.63%
Valid Votes 54,615 98.56% 362,646 98.23% 5,094,754 98.24%
Rejected Votes 799 1.44% 6,537 1.77% 91,499 1.76%
Total Polled 55,414 70.74% 369,183 64.20% 5,186,256 55.87%
Registered Electors 78,330 575,008 9,283,143

1982 Sri Lankan Presidential Election

Party Panadura [11] Kalutara Electoral District Sri Lanka
Votes % Votes % Votes %
UNP 26,648 48.88% 211,592 50.15% 3,450,815 52.93%
SLFP 23,861 43.77% 185,874 44.06% 2,546,348 39.05%
JVP 2,011 3.69% 14,499 3.44% 273,428 4.19%
LSSP 1,776 3.26% 8,613 2.04% 58,531 0.90%
Other Parties (with < 1%) 216 0.40% 1,314 0.31% 190,929 2.93%
Valid Votes 54,512 98.77% 421,892 98.76% 6,520,156 98.78%
Rejected Votes 677 1.23% 5,290 1.24% 80,470 1.22%
Total Polled 55,189 81.70% 427,182 83.97% 6,600,626 80.15%
Registered Electors 67,549 508,744 8,235,358

Parliamentary Election Results

Summary

The winner of Panadura has matched the final country result 5 out of 7 times. Hence, Panadura is a Weak Bellwether for Parliamentary Elections.

Year Panadura Kalutara Electoral District MAE [12]  % Sri Lanka MAE [13]  %
2015 UPFA UPFA 1.17% UNP 2.33%
2010 UPFA UPFA 2.94% UPFA 1.06%
2004 UPFA UPFA 4.90% UPFA 3.89%
2001 UNP UNP 1.49% UNP 2.25%
2000 PA PA 3.52% PA 2.89%
1994 PA PA 4.97% PA 7.25%
1989 SLFP UNP 7.26% UNP 10.15%
Matches/Mean MAE 5/7 6/7 3.75% 7/7 4.26%

2015 Sri Lankan Parliamentary Election

Party Panadura [14] Kalutara Electoral District Sri Lanka
Votes % Votes % Votes %
UPFA 40,809 46.63% 338,801 48.58% 4,732,664 42.48%
UNP 39,190 44.78% 310,234 44.48% 5,098,916 45.77%
JVP 6,253 7.14% 38,475 5.52% 544,154 4.88%
Other Parties (with < 1%) 1,271 1.45% 9,951 1.43% 85,579 0.77%
Valid Votes 87,523 97.49% 697,461 97.00% 11,140,333 95.35%
Rejected Votes 2,232 2.49% 21,366 2.97% 516,926 4.42%
Total Polled 89,773 78.18% 719,001 80.13% 11,684,111 77.66%
Registered Electors 114,828 897,349 15,044,490

2010 Sri Lankan Parliamentary Election

Party Panadura [15] Kalutara Electoral District Sri Lanka
Votes % Votes % Votes %
UPFA 37,818 59.64% 313,836 63.74% 4,846,388 60.38%
UNP 18,022 28.42% 139,596 28.35% 2,357,057 29.37%
DNA 7,340 11.57% 36,722 7.46% 441,251 5.50%
Other Parties (with < 1%) 234 0.37% 2,246 0.46% 34,923 0.44%
Valid Votes 63,414 91.48% 492,400 90.41% 8,026,322 96.03%
Rejected Votes 5,851 8.44% 51,751 9.50% 581,465 6.96%
Total Polled 69,320 65.66% 544,606 65.21% 8,358,246 59.29%
Registered Electors 105,569 835,186 14,097,690

2004 Sri Lankan Parliamentary Election

Party Panadura [16] Kalutara Electoral District Sri Lanka
Votes % Votes % Votes %
UPFA 35,687 48.03% 291,208 51.72% 4,223,126 45.70%
UNP 24,020 32.32% 212,721 37.78% 3,486,792 37.73%
JHU 14,274 19.21% 56,615 10.06% 552,723 5.98%
Other Parties (with < 1%) 328 0.44% 2,475 0.44% 49,030 0.53%
Valid Votes 74,309 95.82% 563,019 94.82% 9,241,931 94.52%
Rejected Votes 3,240 4.18% 30,741 5.18% 534,452 5.47%
Total Polled 77,549 77.75% 593,760 79.58% 9,777,821 75.74%
Registered Electors 99,741 746,138 12,909,631

2001 Sri Lankan Parliamentary Election

Party Panadura [17] Kalutara Electoral District Sri Lanka
Votes % Votes % Votes %
UNP 32,013 43.88% 254,339 45.94% 4,086,026 45.62%
PA 29,288 40.14% 226,468 40.91% 3,330,815 37.19%
JVP 9,435 12.93% 60,451 10.92% 815,353 9.10%
SU 1,367 1.87% 5,103 0.92% 50,665 0.57%
Other Parties (with < 1%) 857 1.17% 7,258 1.31% 86,426 0.97%
Valid Votes 72,960 95.23% 553,619 94.44% 8,955,844 94.77%
Rejected Votes 3,655 4.77% 32,617 5.56% 494,009 5.23%
Total Polled 76,615 79.40% 586,236 81.68% 9,449,878 76.03%
Registered Electors 96,487 717,764 12,428,762

2000 Sri Lankan Parliamentary Election

Party Panadura [18] Kalutara Electoral District Sri Lanka
Votes % Votes % Votes %
PA 30,848 43.08% 255,175 46.86% 3,899,329 45.33%
UNP 25,994 36.30% 217,215 39.89% 3,451,765 40.12%
JVP 7,047 9.84% 38,373 7.05% 518,725 6.03%
SU 4,035 5.63% 15,619 2.87% 127,859 1.49%
NUA 2,857 3.99% 11,943 2.19% 185,593 2.16%
Other Parties (with < 1%) 832 1.16% 6,193 1.14% 136,137 1.58%
Valid Votes 71,613 N/A 544,518 N/A 8,602,617 N/A

1994 Sri Lankan Parliamentary Election

Party Panadura [19] Kalutara Electoral District Sri Lanka
Votes % Votes % Votes %
PA 39,309 58.52% 271,754 53.77% 3,887,805 48.94%
UNP 25,692 38.25% 221,115 43.75% 3,498,370 44.04%
MEP 1,163 1.73% 5,914 1.17% 68,538 0.86%
SLPF 970 1.44% 6,238 1.23% 90,078 1.13%
Other Parties (with < 1%) 41 0.06% 339 0.07% 813 0.01%
Valid Votes 67,175 96.22% 505,360 95.21% 7,943,688 95.20%
Rejected Votes 2,642 3.78% 25,397 4.79% 400,395 4.80%
Total Polled 69,817 77.96% 530,757 80.20% 8,344,095 74.75%
Registered Electors 89,554 661,793 11,163,064

1989 Sri Lankan Parliamentary Election

Party Panadura [20] Kalutara Electoral District Sri Lanka
Votes % Votes % Votes %
SLFP 23,778 47.08% 131,510 40.94% 1,785,369 31.90%
UNP 20,473 40.53% 160,069 49.84% 2,838,005 50.71%
USA 3,025 5.99% 12,342 3.84% 141,983 2.54%
SLMC 2,428 4.81% 12,971 4.04% 202,016 3.61%
MEP 641 1.27% 2,690 0.84% 90,480 1.62%
Other Parties (with < 1%) 165 0.33% 1,611 0.50% 67,723 1.21%
Valid Votes 50,510 95.90% 321,193 94.10% 5,596,468 93.87%
Rejected Votes 2,162 4.10% 20,139 5.90% 365,563 6.13%
Total Polled 52,672 68.55% 341,332 59.86% 5,962,031 63.60%
Registered Electors 76,836 570,193 9,374,164

Demographics

Ethnicity

The Panadura Polling Division has a Sinhalese majority (84.6%) and a significant Moor population (14.1%) . In comparison, the Kalutara Electoral District (which contains the Panadura Polling Division) has a Sinhalese majority (86.8%) [1]

Ethnicity in Panadura [1]

   Sinhalese (84.6%)
   Moor (14.1%)
  Other (1.3%)

Religion

The Panadura Polling Division has a Buddhist majority (78.6%) and a significant Muslim population (14.4%) . In comparison, the Kalutara Electoral District (which contains the Panadura Polling Division) has a Buddhist majority (83.4%) [1]

Religion in Panadura [1]

   Buddhist (78.6%)
   Muslim (14.4%)
   Roman Catholic (5.1%)
   Other Christian (1.3%)
  Other (0.6%)

Related Research Articles

<span class="mw-page-title-main">Colombo Central Polling Division</span> Polling Division in Sri Lanka

The Colombo Central Polling Division is a Polling Division in the Colombo Electoral District, in the Western Province, Sri Lanka.

<span class="mw-page-title-main">Borella Polling Division</span> Polling Division in Sri Lanka

The Borella Polling Division is a Polling Division in the Colombo Electoral District, in the Western Province, Sri Lanka.

<span class="mw-page-title-main">Agalawatta Polling Division</span> Polling Division in Sri Lanka

The Agalawatta Polling Division is a Polling Division in the Kalutara Electoral District, in the Western Province, Sri Lanka.

<span class="mw-page-title-main">Panduwasnuwara Polling Division</span> Polling Division in Sri Lanka

The Panduwasnuwara Polling Division is a polling division in the Kurunegala Electoral District, in the North Western Province, Sri Lanka.

<span class="mw-page-title-main">Bandaragama Polling Division</span> Polling Division in Sri Lanka

The Bandaragama Polling Division is a Polling Division in the Kalutara Electoral District, in the Western Province, Sri Lanka.

The Galigamuwa Polling Division is a Polling Division in the Kegalle Electoral District, in the Sabaragamuwa Province, Sri Lanka.

<span class="mw-page-title-main">Beruwala polling division</span> Polling Division in Sri Lanka

The Beruwala polling division is a polling division in the Kalutara electoral district, in the Western Province, Sri Lanka.

The Kegalle Polling Division is a Polling Division in the Kegalle Electoral District, in the Sabaragamuwa Province, Sri Lanka.

<span class="mw-page-title-main">Kalutara Polling Division</span> Polling Division in Sri Lanka

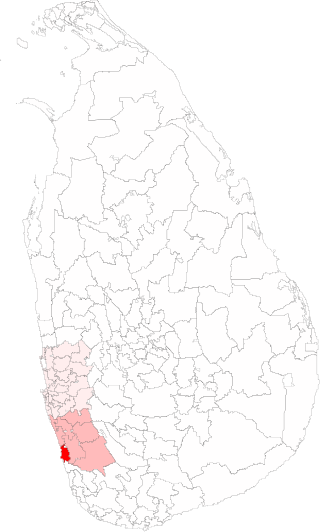
The Kalutara Polling Division is a Polling Division in the Kalutara Electoral District, in the Western Province, Sri Lanka.

<span class="mw-page-title-main">Horana Polling Division</span> Polling Division in Sri Lanka

The Horana Polling Division is a Polling Division in the Kalutara Electoral District, in the Western Province, Sri Lanka.

<span class="mw-page-title-main">Dompe Polling Division</span> Polling Division in Sri Lanka

The Dompe Polling Division is a Polling Division in the Gampaha Electoral District, in the Western Province, Sri Lanka.

The Aranayaka Polling Division is a Polling Division in the Kegalle Electoral District, in the Sabaragamuwa Province, Sri Lanka.

<span class="mw-page-title-main">Kotte Polling Division</span> Polling Division in Sri Lanka

The Kotte Polling Division is a Polling Division in the Colombo Electoral District, in the Western Province, Sri Lanka.

<span class="mw-page-title-main">Avissawella Polling Division</span> Polling Division in Sri Lanka

The Avissawella Polling Division is a Polling Division in the Colombo Electoral District, in the Western Province, Sri Lanka.

<span class="mw-page-title-main">Attanagalla Polling Division</span> Polling Division in Sri Lanka

The Attanagalla Polling Division is a Polling Division in the Gampaha Electoral District, in the Western Province, Sri Lanka.

<span class="mw-page-title-main">Bulathsinhala Polling Division</span> Polling Division in Sri Lanka

The Bulathsinhala Polling Division is a Polling Division in the Kalutara Electoral District, in the Western Province, Sri Lanka.

<span class="mw-page-title-main">Mathugama Polling Division</span> Polling Division in Sri Lanka

The Mathugama Polling Division is a Polling Division in the Kalutara Electoral District, in the Western Province, Sri Lanka.

<span class="mw-page-title-main">Galle Polling Division</span> Polling Division in Sri Lanka

The Galle Polling Division is a Polling Division in the Galle Electoral District, in the Southern Province, Sri Lanka.

The Dedigama Polling Division is a Polling Division in the Kegalle Electoral District, in the Sabaragamuwa Province, Sri Lanka.

The Deraniyagala Polling Division is a Polling Division in the Kegalle Electoral District, in the Sabaragamuwa Province, Sri Lanka.

References

  1. 1 2 3 4 5 "Census of Population and Housing 2012". statistics.gov.lk. Department of Census and Statistics, Sri Lanka. 2012.
  2. The mean absolute error, between the percentages of votes each party got in Panadura and the Kalutara Electoral District. It is a measure of the difference in voting behaviour between the two regions.
  3. The mean absolute error, between the percentages of votes each party got in Panadura and the country. It is a measure of the difference in voting behaviour between the two regions.
  4. "2019 Sri Lankan presidential election Results". elections.gov.lk. Election Commission of Sri Lanka. 2019. Archived from the original on 2019-12-19. Retrieved 2020-06-10.
  5. "2015 Sri Lankan presidential election Results". elections.gov.lk. Election Commission of Sri Lanka. 2015. Archived from the original on 2019-12-19. Retrieved 2020-06-10.
  6. "2010 Sri Lankan presidential election Results". elections.gov.lk. Election Commission of Sri Lanka. 2010. Archived from the original on 2019-12-19. Retrieved 2020-06-10.
  7. "2005 Sri Lankan presidential election Results". elections.gov.lk. Election Commission of Sri Lanka. 2005. Archived from the original on 2019-12-19. Retrieved 2020-06-10.
  8. "1999 Sri Lankan presidential election Results". elections.gov.lk. Election Commission of Sri Lanka. 1999. Archived from the original on 2019-12-19. Retrieved 2020-06-10.
  9. "1994 Sri Lankan presidential election Results". elections.gov.lk. Election Commission of Sri Lanka. 1994. Archived from the original on 2019-12-19. Retrieved 2020-06-10.
  10. "1988 Sri Lankan presidential election Results". elections.gov.lk. Election Commission of Sri Lanka. 1988. Archived from the original on 2019-12-19. Retrieved 2020-06-10.
  11. "1982 Sri Lankan presidential election Results". elections.gov.lk. Election Commission of Sri Lanka. 1982. Archived from the original on 2019-12-19. Retrieved 2020-06-10.
  12. The mean absolute error, between the percentages of votes each party got in Panadura and the Kalutara Electoral District. It is a measure of the difference in voting behaviour between the two regions.
  13. The mean absolute error, between the percentages of votes each party got in Panadura and the country. It is a measure of the difference in voting behaviour between the two regions.
  14. "2015 Sri Lankan parliamentary election Results" (PDF). elections.gov.lk. Election Commission of Sri Lanka. 2015.
  15. "2010 Sri Lankan parliamentary election Results" (PDF). elections.gov.lk. Election Commission of Sri Lanka. 2010.
  16. "2004 Sri Lankan parliamentary election Results" (PDF). elections.gov.lk. Election Commission of Sri Lanka. 2004.
  17. "2001 Sri Lankan parliamentary election Results" (PDF). elections.gov.lk. Election Commission of Sri Lanka. 2001.
  18. "2000 Sri Lankan parliamentary election Results" (PDF). elections.gov.lk. Election Commission of Sri Lanka. 2000.
  19. "1994 Sri Lankan parliamentary election Results" (PDF). elections.gov.lk. Election Commission of Sri Lanka. 1994.
  20. "1989 Sri Lankan parliamentary election Results" (PDF). elections.gov.lk. Election Commission of Sri Lanka. 1989.