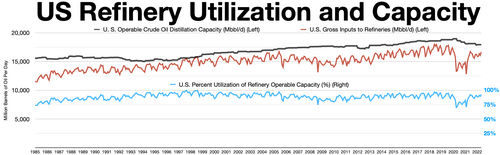
Petroleum refining in the United States in 2024 had a capacity of 18.4 million barrels per day.[2] Although the U.S. was the world's largest net importer of refined petroleum products as recently as 2008, the U.S. became a net exporter in 2010, and in 2014 was the largest exporter and the largest net exporter of refined petroleum.[3] As of January 2019, there were 135 operating refineries in the US, distributed among 30 states.[4]
Total operable atmospheric crude oil distillation capacity as of 1 January 2024. Phillips 66 capacity includes 50% ownership of Wood River and Borger refineries. Source:[5]
The first known U.S. petroleum refiner was Samuel Kier of Pittsburgh, who in the 1850s produced an illuminating oil for miners' lamps.
American petroleum refining largely grew out of oil shale refining. When the Drake Well started producing in 1859, the oil shale industry was growing rapidly, and establishing refineries near cannel coal deposits along the Ohio River Valley. As oil production increased, the oil shale refiners discovered that their refining process worked just as well with petroleum, and that petroleum was a cheaper raw material than shale oil. In 1861, the existing oil shale refiners switched to petroleum feedstock, and the oil shale mines shut down.
In the 1800s, the principal refined product was kerosene for illuminating oil. The heaviest fraction was used as lubricating oil. A market developed for fuel oil as it was discovered that petroleum was superior to coal in powering the large engines of ships and railroad locomotives.
The prevalence of the automobile in the early 1900s created a mass market for gasoline, and a shortage soon developed of the lighter gasoline fractions of crude oil. The shortage was solved by the invention of fluid catalytic cracking, which broke long hydrocarbon chains into smaller molecules.
The newest large refinery built in the US was completed in 1976 in Garyville, Louisiana.[7] Since then, while some existing refineries have expanded, new refinery construction has faced significant barriers in environmental regulation, permitting, and local political opposition.[8] Industrial accidents such as the 2019 Philadelphia Energy Solutions refinery explosion have led to refinery closures which reversed some of the gains made through expansion of refineries.[9]
Geography
USEIA - Map of US Oil Refineries in 2012
Most large refineries are near navigable waterways, especially seaports or Great Lakes ports. The single largest concentration of refineries is along the Gulf Coast.[10] Although there are refineries in 30 states, just three states dominate US refining: Texas (47 operating refineries), Louisiana (19), and California (18). As of January 2015, these three states contain 45% of all US refineries and 59% of all US refining capacity.[11]
Products
The three largest-volume products of US refineries are gasoline, fuel oil (including diesel fuel and home heating oil), and aviation fuel, which together make up more than 84 percent of output.[12]
Petroleum refineries recover elemental sulfur as a byproduct. In 2012, US oil refineries recovered 7.4 million metric tons of sulfur, worth about $915 million, and amounting to 88% of the elemental sulfur produced in the US.[13] Sulfur removal (as well as other contaminants) was a key theme of US refinery investment during 1990 to 2017 leading to additional sulfur production. New sulfur regulations enacted by the EPA have steadily reduced sulfur content. Since 2006, ultralow sulfur diesel with a maximum sulfur content of 15 ppm has been standard for on-road vehicles, extended to non-road vehicles in 2010, and to locomotives and marine vessels by 2012. Starting in January 2017, gasoline has been limited to an annual average of 10 ppm sulfur, with a maximum of 80 ppm allowed per batch at the refinery gate and up to 95 ppm downstream.[14] At this point, nearly all road and industrial fuels produced in the US have been substantially desulfurized to levels of 15 parts per million or less.
International trade
U.S. exports minus imports (net exports) of refined petroleum products, 1980-2013. Data from OPEC
Up until 2008, the United States was for decades the world's largest net importer of refined petroleum products. But the situation quickly changed in 2008 as American refineries became much more cost-competitive due to large increases in US production of oil, natural gas, and natural gas liquids. The US became a net exporter of refined petroleum in 2010, and since 2013 has been the world's largest net exporter of refined petroleum. In 2014, the US exported 3.83 million barrels per day and imported 1.35 million barrels per day of refined petroleum, for net exports of 2.48 million barrels per day.[15] The largest net importers of US refined products in 2017 were, in descending order: Mexico, Brazil, Japan, China, and Singapore.[16]
The competitive advantage of US refiners has been attributed to the lower price of American crude oil, as reflected by the Oklahoma-based index price West Texas Intermediate, versus the more expensive European-based index price Brent Crude. Due to the great surge in American production of oil, natural gas, and natural gas liquids since 2008, those products have been cheaper in the North American market than worldwide, giving American refiners a major cost advantage.[17] The discount on US crude is partially attributed to the long-standing federal ban on exports of American crude oil.[18]
European Union refiners have been hard-hit by the growth in US exports. They lost much of their previous gasoline exports to the US, and also market share in the worldwide market to the newly competitive US refineries. In addition, US refineries have increasingly exported petroleum products to the EU. In 2008, US exports of gas oil (home heating fuel) surged to a 31% market share in the EU, up from 5% the previous year; in 2011, US imports held a 37% market share of gasoil in the EU.[19] There has been discussion that EU refineries would have to shut down without government intervention.[20]
This page is based on this Wikipedia article Text is available under the CC BY-SA 4.0 license; additional terms may apply. Images, videos and audio are available under their respective licenses.